Glial insulin regulates cooperative or antagonistic Golden goal/Flamingo interactions during photoreceptor axon guidance
←
→
Page content transcription
If your browser does not render page correctly, please read the page content below
RESEARCH ARTICLE

                                    Glial insulin regulates cooperative or
                                    antagonistic Golden goal/Flamingo
                                    interactions during photoreceptor axon
                                    guidance
                                    Hiroki Takechi1, Satoko Hakeda-Suzuki1*, Yohei Nitta2,3, Yuichi Ishiwata1,
                                    Riku Iwanaga1, Makoto Sato4,5, Atsushi Sugie2,3, Takashi Suzuki1*
                                    1
                                      Graduate School of Life Science and Technology, Tokyo Institute of Technology,
                                    Yokohama, Japan; 2Center for Transdisciplinary Research, Niigata University,
                                    Niigata, Japan; 3Brain Research Institute, Niigata University, Niigata, Japan;
                                    4
                                      Mathematical Neuroscience Unit, Institute for Frontier Science Initiative, Kanazawa
                                    University, Kanazawa, Japan; 5Laboratory of Developmental Neurobiology,
                                    Graduate School of Medical Sciences, Kanazawa University, Kanazawa, Japan

                                    Abstract Transmembrane protein Golden goal (Gogo) interacts with atypical cadherin Flamingo
                                    (Fmi) to direct R8 photoreceptor axons in the Drosophila visual system. However, the precise
                                    mechanisms underlying Gogo regulation during columnar- and layer-specific R8 axon targeting are
                                    unknown. Our studies demonstrated that the insulin secreted from surface and cortex glia switches
                                    the phosphorylation status of Gogo, thereby regulating its two distinct functions. Non-
                                    phosphorylated Gogo mediates the initial recognition of the glial protrusion in the center of the
                                    medulla column, whereas phosphorylated Gogo suppresses radial filopodia extension by
                                    counteracting Flamingo to maintain a one axon-to-one column ratio. Later, Gogo expression ceases
                                    during the midpupal stage, thus allowing R8 filopodia to extend vertically into the M3 layer. These
*For correspondence:                results demonstrate that the long- and short-range signaling between the glia and R8 axon growth
hakeda@bio.titech.ac.jp (SH-S);     cones regulates growth cone dynamics in a stepwise manner, and thus shapes the entire
suzukit@bio.titech.ac.jp (TS)       organization of the visual system.
Competing interests: The
authors declare that no
competing interests exist.
Funding: See page 20                Introduction
Received: 20 January 2021           During development, well-defined synaptic connections are formed in the brain between specific
Accepted: 02 March 2021             neurons to facilitate higher-order information processing. Synapses are often arranged into struc-
Published: 05 March 2021            tures that reflect the functional organization of synaptic contacts (Huberman et al., 2010; Luo and
                                    Flanagan, 2007; Sanes and Yamagata, 2009). Each brain layer receives discrete axonal inputs that
Reviewing editor: Claude
Desplan, New York University,
                                    carry specific information. Therefore, external inputs dissolve into distinct modules in the brain. In
United States                       the visual system, photoreceptors connect to columns located around the target region, thereby
                                    preserving the spatial relationships between the visual world and its representation in the brain
   Copyright Takechi et al. This
                                    (Huberman et al., 2010; Sanes and Zipursky, 2010). Layers separate the brain into horizontal
article is distributed under the
                                    planes, whereas columnar units group the axons into bundles that are perpendicular to the layers
terms of the Creative Commons
Attribution License, which          (Clandinin and Zipursky, 2002; Mountcastle, 1997; Sanes and Zipursky, 2010). The integration of
permits unrestricted use and        the individual column and layer processes enables the modular processing of perceived information.
redistribution provided that the    Thus, specific layer-column axonal targeting to unique synaptic partners is a fundamental step in the
original author and source are      complex formation of functional neuronal networks inside the brain (Huberman et al., 2010;
credited.                           Luo and Flanagan, 2007; Millard and Pecot, 2018; Nériec and Desplan, 2016).

Takechi et al. eLife 2021;10:e66718. DOI: https://doi.org/10.7554/eLife.66718                                                      1 of 24
Research article                                                                            Developmental Biology Neuroscience

                                       The Drosophila visual system is an attractive model for studying the formation of the functional
                                    organization of synaptic connections because its optic ganglion has a layered and columnar structure
                                    (Hadjieconomou et al., 2011; Millard and Pecot, 2018; Sanes and Zipursky, 2010). The visual sys-
                                    tem of the adult Drosophila consists of the compound eye and four optic ganglia (in order: lamina,
                                    medulla, and lobula complex). The compound eye is composed of an array of approximately 800
                                    ommatidia, each containing eight photoreceptor cells (R cells, R1–R8) arranged in a stereotypic pat-
                                    tern. R7 and R8 axons project to the second optic ganglion, namely, the medulla. The medulla is
                                    subdivided into columnar units and 10 distinct layers. R7, R8, and Mi1 axons elongate into the
                                    medulla at the earliest stage. They function as the pioneering axons during the formation of the
                                    medulla columns, which are comprised of approximately 100 different axons (Trush et al., 2019). R8
                                    extends its axon to a single medulla column, followed by a single R7 axon. Eventually, R8 targets the
                                    M3 layer of the medulla, whereas R7 targets the M6 layer. Across development, the R8 neurons
                                    undergo three stages of axonal targeting (Akin and Zipursky, 2016; Hadjieconomou et al., 2011).
                                    First, single R8 axons project to a single column and form a horseshoe-shaped terminal that encircles
                                    the medulla columnar center (phase 1: third instar larva). Second, the R8 axons remain at the
                                    medulla neuropil surface without bundling with each other (phase 2: 24% APF [After Puparium For-
                                    mation]). Third, R8 axons extend filopodia to target the M3 layer (phase 3: 48% APF). Many studies
                                    have detailed the molecular mechanisms that underlie the layer-specific targeting of R neurons
                                    (Akin and Zipursky, 2016; Hadjieconomou et al., 2011; Hakeda-Suzuki and Suzuki, 2014;
                                    Hakeda-Suzuki et al., 2017; Kulkarni et al., 2016; Mencarelli and Pichaud, 2015; Millard and
                                    Pecot, 2018; Özel et al., 2015). However, little is known about the formation of the medulla colum-
                                    nar structure.
                                       Previous work in our lab identified a single transmembrane protein, Golden goal (Gogo), by a
                                    large-scale screen to search for genes that control R axon pathfinding (Berger et al., 2008). Func-
                                    tional studies have revealed that Gogo, with the atypical cadherin Flamingo (Fmi), guides R8 axons
                                    to the M3 layer (Hakeda-Suzuki et al., 2011; Senti et al., 2003; Tomasi et al., 2008). Gogo and
                                    Fmi colocalization is essential for this function. The R8 axons of gogo or fmi single mutants exhibit
                                    similar phenotypes, including defects in the axonal array due to the irregular distances between
                                    axons and the difficulty in targeting the M3 layer. Furthermore, the dephosphorylated state of a trip-
                                    let Tyr-Tyr-Asp (YYD) motif in the Gogo cytoplasmic domain is important for R8 axon targeting
                                    (Mann et al., 2012). However, when the YYD motif is phosphorylated, Gogo appears to interfere
                                    with the ability of the R8 axon to target the M3 layer. The Drosophila insulin receptor (DInR), a tyro-
                                    sine kinase receptor, is one of the kinases that phosphorylate the YYD motif of Gogo (Mann et al.,
                                    2012). A growing number of recent studies have revealed the functional involvement of DInR in ner-
                                    vous system development (Fernandes et al., 2017; Rossi and Fernandes, 2018; Song et al., 2003).
                                    Therefore, DInR may be one mechanism through which Gogo and Fmi regulate R8 axon pathfinding.
                                    Because Gogo and Fmi are conserved across C. elegans to humans, elucidating their role in develop-
                                    ment in Drosophila can greatly enhance our understanding of the molecular mechanisms of develop-
                                    ment in higher-order species.
                                       The current study was able to examine stepwise R8 axonal targeting events across development
                                    by following protein localization and by specifically controlling Gogo and Fmi levels in R8 axons. In
                                    phase 1, Gogo and Fmi cooperated in guiding the R8 growth cone to its correct place inside the col-
                                    umn (gogo function 1). In phase 2, Gogo was phosphorylated by the glial insulin signal and began to
                                    counteract Fmi to repress filopodia extension (gogo function 2). In phase 3, R8 axons only expressed
                                    Fmi, which directed them to the M3 layer (no gogo function). These results indicate that the glial
                                    insulin signal controls Gogo phosphorylation, thereby regulating growth cone dynamics, including
                                    the formation of the horseshoe shape and filopodia extension. Overall, this regulates axon-column
                                    and axon-axon interactions. Gogo possesses an interesting property wherein the phosphorylation
                                    states maintain two separate axon pathfinding functions. This is an economical strategy for increas-
                                    ing protein functions when there are a limited number of genes. As a result, this mechanism main-
                                    tains the regular distance between R8 axons and enables the ordered R8 axonal targeting of the
                                    column.

Takechi et al. eLife 2021;10:e66718. DOI: https://doi.org/10.7554/eLife.66718                                                       2 of 24
Research article                                                                             Developmental Biology Neuroscience

                                    Results
                                    Gogo expression, but not Fmi expression, ceases around the midpupal
                                    stage
                                    During development, Gogo and Fmi proteins are expressed broadly and dynamically in photorecep-
                                    tors and the optic lobe. To monitor the precise expression and localization patterns of Gogo and
                                    Fmi proteins during R8 axonal targeting, knock-in flies that tag the desired proteins in a cell-specific
                                    manner with GFP or mCherry were generated using the CRISPR/Cas9 system (Chen et al., 2014;
                                    Kondo and Ueda, 2013; Sander and Joung, 2014). The use of these flies allowed the observation
                                    of endogenous R8 axon-specific Gogo and Fmi localization across the developmental stages
                                    between the third instar larvae and adulthood (Figure 1). Gogo protein was strongly expressed in
                                    the tip of R8 axons during developmental phases 1 and 2 (Figure 1C–E). Contrary to previous
                                    hypotheses (Hakeda-Suzuki et al., 2011), Gogo protein was not present during phase 3, when R8
                                    axons filopodia elongate toward the deeper medulla layers (Figure 1F,G and Figure 1—figure sup-
                                    plement 1). Conversely, Fmi-mCherry expression in R8 axons was observed throughout the develop-
                                    ment stages (Figure 1H–K). Fmi was localized in the R8 axon tip, including thin filopodia structures
                                    during phase 3, when Gogo expression was not present (Figure 1K). Gogo and Fmi protein localiza-
                                    tion in the R8 axon tip during phase 1 essentially overlapped, although there were several character-
                                    istic differences (Figure 1M–P). Gogo-GFP signal was relatively weak in the filopodia, but
                                    accumulated at the rim of the horseshoe-shaped axon terminal that encircled the medulla columnar
                                    center (Figure 1M’, N). On the other hand, Fmi-mCherry signal was widely distributed in the R8
                                    axon terminal, including filopodia-like protrusions (Figure 1M”, N). These protein localization data
                                    indicate that Gogo and Fmi functionally cooperate, so that R8 axons recognize the center of the
                                    medulla column during phase 1. The results indicate that Fmi alone promotes vertical filopodia elon-
                                    gation into the M3 layer during phase 3.

                                    Gogo and Fmi cooperatively guide R8 axons to encircle the columnar
                                    center of the medulla
                                    R8 cell-specific strong loss-of-function (LOF) animals were generated to observe phase-specific
                                    Gogo and Fmi functions (Figure 2). An RNAi insertion and a heterozygous null mutation were com-
                                    bined (Hakeda-Suzuki et al., 2017), thus resulting in a strong phenotype equivalent to known gogo
                                    or fmi null mutations (Figure 2—figure supplement 1A–F). In the R8 cell-specific gogo LOF, R8
                                    axons correctly targeted each column, but the termini intruded into the medulla columnar center
                                    and failed to form a proper horseshoe shape during phase 1 (Figure 2A,B and D). In phase 2, the
                                    R8 axonal termini displayed greater horizontal filopodial extension than normal, thereby enhancing
                                    the probability of encountering neighboring gogo loss-of-function R8 axons over time (Figure 2B).
                                    This excessive R8 filopodia coincides with the disrupted R8 axon termini lineup and the invasion of
                                    layers slightly deeper than M1 during phases 2 and 3 (Figure 2E,F,H and J). Axon bundling and
                                    incorrect targeting become more prominent later in development. As a result, multiple R8 axons
                                    (usually two) were often observed innervating a single column (yellow arrow in Figure 2F and J).
                                    During live imaging, vertical extension could be observed during phase 3 in tangled gogo loss-of-
                                    function R8 axons, thus indicating that it is difficult to uncouple axons once they have become tan-
                                    gled (Figure 2—videos 1 and 2). This can explain the observation that columnar organization
                                    becomes worse in a larger mutant area compared with a single isolated mutant axon (Tomasi et al.,
                                    2008).
                                       To determine whether Gogo function in phase 2 is independent of phase 1, we performed a
                                    phase-specific knockdown of gogo using Gal80ts. The temperature was changed from 18˚C to 27˚C
                                    during white pupal formation, so that the gogo RNAi began to be expressed after the early pupal
                                    stage. By this stage, the R8 axons that innervate the anterior half of the optic lobe had already
                                    developed a horseshoe shape as a wild type (Figure 2—figure supplement 1H). In phase 2, those
                                    anterior R8 axon growth cones extended longer filopodia in more radial directions than the wild
                                    type (Figure 2O–P’’’), indicating that gogo loss-of-function defects observed in phase 2 were inde-
                                    pendent of those of phase 1. Altogether, these data suggest that gogo has two functions: column
                                    center encircling (function 1) in phase 1, and proper filopodia extension (function 2) during phase 2.

Takechi et al. eLife 2021;10:e66718. DOI: https://doi.org/10.7554/eLife.66718                                                        3 of 24
Research article                                                                                      Developmental Biology Neuroscience

                                    Figure 1. R8-specific labeling of Gogo and Fmi. (A) Schematics of the Drosophila visual system in the third instar
                                    larva and the adult. (B) Schematics of the phase-specific R8 targeting during development. (C–G) Gogo
                                    localization at the terminals of R8 axons (green) during developmental phases was visualized by combining Gogo-
                                    FsF-GFP and R8-specific FLPase (sensFLP) co-labeled with R8-specific myr-RFP (C) or mAb24B10 for all R axons (D–
                                    G) (magenta). The numbers indicate the average intensity of GFP (max. 85, n = 3, 24 axons each). (H–L) Fmi
                                    protein localization at the terminals of R8 axons (green) during developmental phases was visualized by Fmi-FsF-
                                    mCherry and R8-specific FLPase (sensFLP) co-labeled with R8-specific mCD8GFP (H) or mAb24B10 for all R axons
                                    (I–L) (magenta). The numbers indicate the average intensity of mCherry (max. 85, n = 3, 24 axons each). (M–P)
                                    Localization of Gogo (green) and Fmi (magenta) protein at the tip of the R8 axon in third instar larva (phase 1) (M).
                                    (N) The fluorescent intensity of Gogo-GFP (green) and Fmi-mCherry (magenta) was measured from outside to
                                    inside of the columns across the horseshoes as shown in M (yellow dotted lines). The average of eight axons (n = 3
                                    animals) was calculated. Gogo was strongly enriched at the rim of the horseshoe-shaped R8 axon terminal (M’,
                                    arrow in N). Fmi was distributed broadly including filopodia (M’’, bracket in N). 3D images of Gogo (green) and
                                    Fmi (red) localization at the tip of R8 axon (blue) in third instar larva (phase 1) (O). Schematic of Gogo (green) and
                                    Fmi (red) expression in R8 cells (blue) (P). Scale bars 10 mm.
                                    The online version of this article includes the following source data and figure supplement(s) for figure 1:
                                    Source data 1. Source data for the quantification in Figure 1C-H.
                                    Source data 2. Source data for the quantification in Figure 1N.
                                    Figure supplement 1. gogo expression gradually declines during midpupal stages.

                                    Both of these functions were essential for avoiding axon bundling and for promoting a proper array
                                    of medulla columns during later development (Figure 2I’, J’ and M).
                                       Similar to the gogo phenotype, the fmi LOF had R8 axon terminals that intruded into the medulla
                                    columnar center and failed to form a proper horseshoe shape during phase 1 (Figure 2C and D). In
                                    contrast to the gogo LOF, R8 filopodia horizontal extension was abnormally shortened. As a result,
                                    R8 axons maintained their distance from neighboring R8 axons and lined up orderly at the medulla

Takechi et al. eLife 2021;10:e66718. DOI: https://doi.org/10.7554/eLife.66718                                                                     4 of 24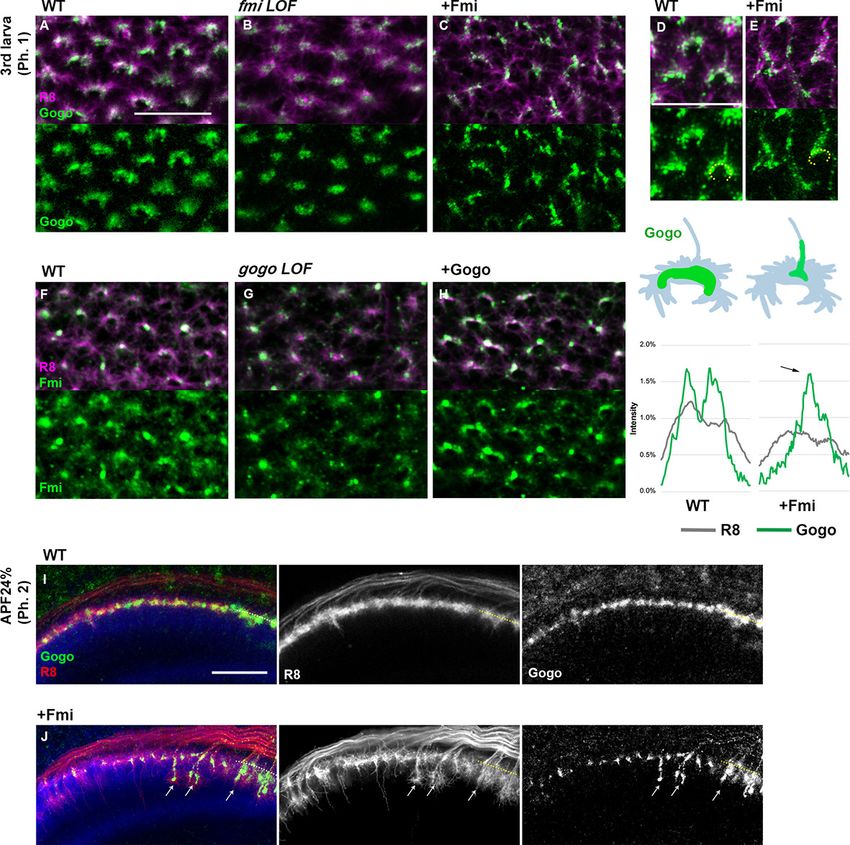
Research article                                                                                   Developmental Biology Neuroscience

                                    Figure 2. Gogo and Fmi regulates the growth cone dynamic. (A–L) The medulla of control, R8-specific gogo loss-
                                    of-function mutations, and R8-specific fmi loss-of-function was analyzed. (A–C) The medulla of the third instar
                                    larvae (phase 1) was labeled with UAS-mCD8GFP for R8 (green) and anti-N-cadherin (magenta) to visualize
                                    columns. The dashed circles demarcate columns. The numbers indicate the average diameter of the medulla
                                    columns visualized with anti-N-cadherin (n = 3, 18 columns). (D) Quantification of the R8 axon terminals that
                                    intruded into the medulla columnar center and failed to form a proper horseshoe shape during phase 1. (E–G) The
                                    medulla at APF24% (phase 2) was labeled with UAS-mCD8GFP for R8 (green), mAb24B10 for all R axons (red) and
                                    anti-N-cadherin (blue). gogo loss-of-functions showed R8 axon bundling and overextension beyond the R8
                                    temporary layer (arrows). (H) Quantification of the invasion R8 axons at phase 2. (I–K) The medulla at APF48%
                                    (phase 3) was labeled with UAS-mCD8GFP for R8 (green), mAb24B10 for all R axons (red), and anti-N-cadherin
                                    (blue). gogo loss-of-function showed R8 axon bundling (arrows), whereas in fmi loss-of-functions, R8 axons failed
                                    to extend filopodia vertically toward the M3 layer (arrowheads). (I’–K’) Medulla were labeled with N-cadherin
                                    (magenta) and R axons with mAb24B10 (green) to highlight the columnar pattern. (L) Quantification of R8 axons
                                    that failed to vertically extend their filopodia toward the M3 layer during phase 3. (M, N) Schematics of R8-
                                    targeting phenotype in gogo loss-of-function and fmi loss-of-function in each phase. (O, P). To elucidate the
                                    function of Gogo in phase 2, gogo RNAi was expressed in R8 axons in gogo heterozygous mutant only after
                                    puparium formation (APF0%) using Gal80ts to eliminate the effect of gogo LOF in phase 1. Since the axons were
                                    sparsely labeled using Flp-out system, some axon terminals were isolated and each filopodia can be identifiable
                                    Figure 2 continued on next page

Takechi et al. eLife 2021;10:e66718. DOI: https://doi.org/10.7554/eLife.66718                                                                 5 of 24
Research article                                                                                     Developmental Biology Neuroscience

                                    Figure 2 continued
                                    (white square in O and P. Enlarged images in O’ and P’). The centers of the growth cones were plotted, and the
                                    orientation of axon growth perpendicular to boundary line of medulla was determined. Tips of the five longest
                                    filopodia were connected to the center by red lines (O’’, P’’). Fifty lines from ten axons were collected and merged
                                    into one image (O’’’, P’’’). In the phase 2-specific gogo LOF, anterior R8 axon growth cones extended longer
                                    filopodia in more radial directions than wild type. Scale bars 10 mm.
                                    The online version of this article includes the following video, source data, and figure supplement(s) for figure 2:
                                    Source data 1. Source data for the quantification in Figure 2A-C.
                                    Source data 2. Source data for the quantification in Figure 2D.
                                    Source data 3. Source data for the quantification in Figure 2H.
                                    Source data 4. Source data for the quantification in Figure 2L.
                                    Figure supplement 1. R cell-specific loss-of-funtion of Gogo and Fmi.
                                    Figure 2—video 1. Filopodial dynamics of the control animal.
                                    https://elifesciences.org/articles/66718#fig2video1
                                    Figure 2—video 2. Filopodial dynamics of gogo mutant.
                                    https://elifesciences.org/articles/66718#fig2video2

                                    surface during phase 2 (Figure 2G and H). Toward phase 3, R8 axons began to lose proper distance
                                    among themselves, thus resulting in defective columnar organization (Figure 2I’ and K’). We attrib-
                                    uted these defects to the initial failure of fmi R8 axons to encircle the medulla columnar center dur-
                                    ing phase 1. Moreover, in phase 3, fmi R8 axons failed to vertically extend their filopodia toward the
                                    M3 layer (Figure 2K and L). These results indicate that Gogo and Fmi function in opposing manners
                                    during phases 2 and 3 of R8 axon targeting (Figure 2M and N). Given that gogo and fmi LOFs had
                                    disorganized medulla columns in later stages (Figure 2J’ and K’), it can be concluded that the col-
                                    umn center encircling during phase 1 is important for R8 axons to follow the correct columnar path
                                    and to develop organized arrays.

                                    Gogo performs a cooperative and antagonistic function toward Fmi
                                    Previous studies that are primarily based on genetic interactions have indicated that Gogo and Fmi
                                    must interact to recognize their ligand molecule (Hakeda-Suzuki et al., 2011). Loss-of-function
                                    mutations were used to observe any genetic Gogo/Fmi interactions during phase 1. The use of RNAi
                                    lines to knockdown each gene in an R8-specific manner resulted in morphological defects in the ter-
                                    mini of a fraction of R8 axons (38.2% of gogoRNAi and 11.9% of fmiRNAi; Figure 3A,B,C and E).
                                    Double knockdown synergistically enhanced these morphological defects (76.6% of termini;
                                    Figure 3D and E), thus suggesting that Gogo and Fmi cooperate during phase 1 to correctly recog-
                                    nize and encircle the medulla columnar center.
                                        The next set of experiments was attempted to rescue these loss-of-function mutant phenotypes
                                    by overexpressing the opposing gene to test whether Gogo and Fmi are mutually compensatory.
                                    Fmi overexpression in R8-specific gogo LOF did not rescue R8 axon termini morphological defects
                                    (Figure 3—figure supplement 1I and K). Likewise, Gogo overexpression in R8-specific fmi LOF did
                                    not rescue the morphological defects (Figure 3—figure supplement 1J and L). These results indi-
                                    cate that Gogo and Fmi do not have redundant gene functions and cannot compensate for each
                                    other.
                                        To investigate the function 2 of Gogo, we examined the genetic interaction between gogo and
                                    fmi LOF in phase 2. Compared to the gogo single LOF, gogo/fmi double LOF showed much milder
                                    bundling and invasion defects in phase 2 (Figure 3—figure supplement 1A–H), suggesting an
                                    antagonistic function between gogo and fmi in phase 2. The antagonistic effect was more dramatic
                                    when these genes were overexpressed. When gogo was overexpressed in an R8-specific manner in
                                    phase 3, gogo-overexpressed R8 axons failed to vertically extend their filopodia toward the M3
                                    layer, similar to that in fmi LOF (Figure 3F–H, compared with Figure 2K). Conversely, fmi-overex-
                                    pressed R8 axons extended their filopodia vertically toward the layers much deeper than the wild
                                    type and passes through the medulla during phase 2 (Figure 3I). To observe the genetic relationship
                                    between Gogo and Fmi, Gogo levels were manipulated, and the effect on filopodia extension in fmi-
                                    overexpressed R8 axons was observed. gogo knockdown on an fmi overexpression background
                                    enhanced premature vertical filopodia extension during phase 2 (Figure 3J and L), thus resulting in

Takechi et al. eLife 2021;10:e66718. DOI: https://doi.org/10.7554/eLife.66718                                                                   6 of 24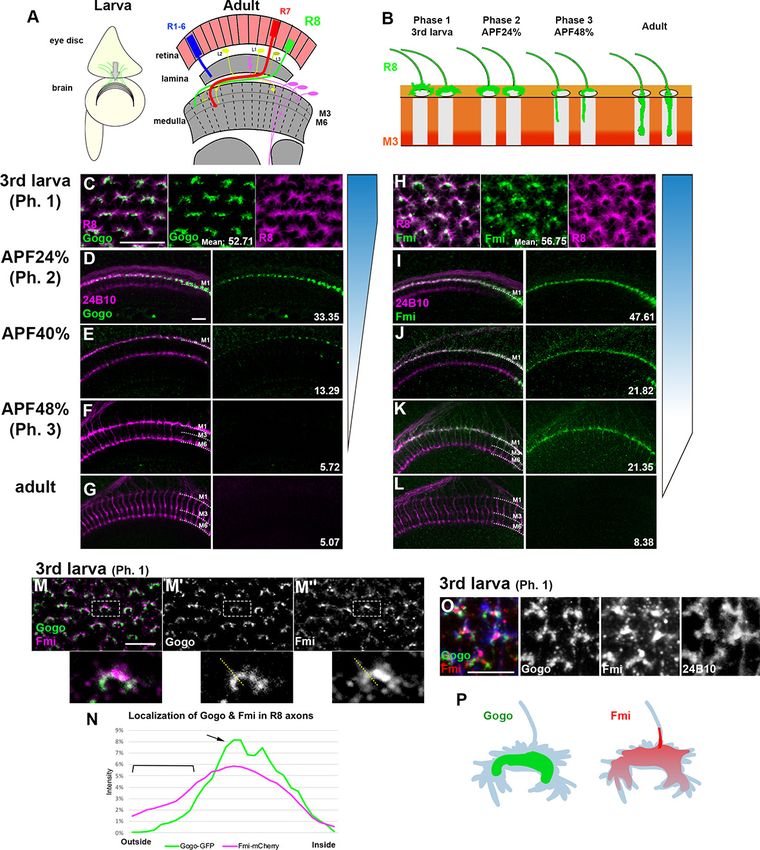
Research article                                                                                     Developmental Biology Neuroscience

                                    Figure 3. Gogo has dual functions, ’cooperative’ and ‘antagonistic’ toward Fmi. (A–E) R8 axons in wild type (A),
                                    R8-specific knockdowns of gogo (B), fmi (C), and gogo, fmi double knockdowns (D) in phase 1 were visualized
                                    using R8-specific UAS-mCD8GFP (green) counterstained with anti-N-cadherin (magenta). (E) Quantification of the
                                    R8 axon terminals that intruded into the medulla columnar center and failed to form a proper horseshoe shape at
                                    phase 1 (third instar larva). (F–L) Genetic interaction between fmi and gogo. R8 axons are labeled with mCD8GFP
                                    (green), and counterstained with mAb24B10 (red) and anti-N-cadherin (blue). R8 axons overexpressing gogo failed
                                    to extend their filopodia vertically toward the M3 layer (arrowheads in G compared with F). (H) Quantification of R8
                                    axons failed to vertically extend their filopodia toward the M3 layer during phase 3 (APF48%). (I) Upon fmi
                                    overexpression, R8 cells extended their vertical filopodia toward the deeper layer of the medulla during phase 2
                                    (APF24%). The vertical filopodia extension was further promoted by gogo RNAi (J) and strongly suppressed by
                                    gogo overexpression (K). (L) Quantification of R8 filopodia length. The length of the longest filopodia was
                                    measured in 3D images and divided into three classes: 15 mm
                                    (magenta). Scale bars 10 mm.
                                    The online version of this article includes the following source data and figure supplement(s) for figure 3:
                                    Source data 1. Source data for the quantification in Figure 3E.
                                    Source data 2. Source data for the quantification in Figure 3H.
                                    Source data 3. Source data for the quantification in Figure 3L.
                                    Figure supplement 1. Gogo and Fmi functions are not redundant.
                                    Figure supplement 2. Functional domain analysis of Gogo.
                                    Figure supplement 2—source data 1. Source data for the quantification in Figure 3—figure supplement 2O.

Takechi et al. eLife 2021;10:e66718. DOI: https://doi.org/10.7554/eLife.66718                                                                   7 of 24
Research article Developmental Biology Neuroscience
the R8 axon bundling phenotype observed at the adult stage (Figure 3—figure supplement 1M–P).
Conversely, gogo and fmi cooverexpression suppressed filopodia extension compared with fmi over-
expression alone (Figure 3K and L). These results underscore that Fmi promotes filopodia extension,
which is counteracted by Gogo. Thus, as the development proceeds, Gogo genetically showed
cooperative interaction (phase 1) to antagonizing interaction (phase 2) toward Fmi.
The two functions of Gogo are regulated by the same functional
ectodomain
To examine how Gogo switches its functional role regarding Fmi, we first checked if Gogo has multi-
ple functional stretches in the extracellular domain that could elicit each function. Gogo has a
GOGO domain that contains eight conserved cysteines, a Tsp1 domain, and a CUB domain in its
extracellular portion. Previous work has shown that both the GOGO and Tsp1 domains are required
for Gogo function (Tomasi et al., 2008). To determine which Gogo ectodomain is required in higher
resolution, a smaller segment of each domain was deleted from the genome using CRISPR/Cas9.
Severe morphological phenotypes similar to the gogo null mutant were observed in any of the small
GOGO or Tsp1 domain deletions in phase 1 (Figure 3—figure supplement 2A–H). Furthermore,
overexpression of the Gogo fragment lacking GOGO or Tsp1 domains showed weaker suppression
of filopodia extension in the fmi overexpression mutants compared to the full-length Gogo overex-
pression (Figure 3—figure supplement 2I–O). These results demonstrated that GOGO and Tsp1
domains are required in both phases 1 and 2. Therefore, the same stretch of extracellular portion
(GOGO–Tsp1) is required for the both functions of Gogo, indicating that switching between two
functions of Gogo is not relevant to the extracellular portion during the early developmental stages.
Gogo localization is dependent on Fmi localization inside filopodia
The functional domain in the extracellular portion of Gogo indicates that Gogo/Fmi interactions
occur throughout development, including phases 1 and 2. Previous studies have shown that Gogo
and Fmi colocalize at the cell-cell contacts of cultured cells (Hakeda-Suzuki et al., 2011). In order to
test it in more in vivo situation, we tried to observe the changes of the Gogo or Fmi protein localiza-
tion at phase 1 in the loss- or gain-of-function mutants (Figure 4). In the LOF mutants, interpretation
of the localization changes was not possible because the growth cone morphology had changed
drastically. Therefore, we focused on situations in which the protein was overexpressed. Fmi localiza-
tion was not altered in gogo overexpression mutants (Figure 4F and H). Conversely, in fmi overex-
pression, Gogo localization shifted toward the stalk of the axon terminal, where Fmi accumulates
(Figure 4C–E). Moreover, Gogo localization was shifted along the vertical filopodia stimulated by
Fmi to prematurely extend during phase 2 (Figure 4I and J). These results indicate that Gogo locali-
zation is controlled by Fmi, and that the physical interaction between Gogo and Fmi controls the for-
mation of the horseshoe structure during phase 1 and filopodia extension during phase 2.
Dephosphorylated and phosphorylated Gogo have distinct functions
toward Fmi
We next tested whether cytoplasmic domain of Gogo serves as a switch to change between its two-
faced functions. Previous studies suggest that the cytoplasmic domain of Gogo is important for
Gogo/Fmi collaborative functions, while they interact in cis (Hakeda-Suzuki et al., 2011;
Tomasi et al., 2008). It has also been shown that the YYD tripeptide motif in the cytoplasmic
domain is required for Gogo function (Mann et al., 2012). Furthermore, Tyr1019 and Tyr1020 are
known as the true phosphorylation sites in vivo (Mann et al., 2012). To test whether regulation of
Gogo phosphorylation is required for function 1 during phase 1, the Gogo phosphomimetic form
(GogoDDD), non-phosphomimetic form (GogoFFD) and deletion of the entire cytoplasmic domain
(GogoDC) were used to rescue the gogo mutant phenotype. GogoDDD and GogoDC were unable
to rescue the mutant morphological phenotype, whereas wild-type Gogo and GogoFFD significantly
rescued the phenotype during phase 1 (Figure 5A–F). These results indicate that the unphosphory-
lated YYD motif of the cytoplasmic domain is required for R8 axons to correctly recognize the
medulla column and encircle the columnar center (function 1).
Next, we sought to determine which Gogo form is functional during filopodia extension in phase
2. The GogoFFD and GogoDDD transgenes were expressed in fmi-overexpressed flies (Figure 5G–
Takechi et al. eLife 2021;10:e66718. DOI: https://doi.org/10.7554/eLife.66718 8 of 24Research article Developmental Biology Neuroscience
Figure 4. Gogo localization in R8 changes depending on the expression level of Fmi. (A–H) Localization of R8-
specific Gogo-GFP (A–E) and Fmi-mCherry (D–H) in loss-of-function (heterozygous mutation with R8-specific RNAi)
or overexpression backgrounds. R8 axons were labeled with myr-RFP or mCD8GFP. (D–E) 3D images of Gogo
localization in R8 cells of wild type (D) or Fmi overexpression (E). The fluorescent intensity of Gogo-GFP (green)
and R8 myr-RFP (gray) was measured along the horseshoe structures (the dotted lines in D, E) and the average of
four axons (n = 2 animals) is shown in the graph below each image. Upon Fmi overexpression, strong Gogo
expression was observed at the stalk of the axon terminal (C and E compared with A and D, arrow in the
histogram of +Fmi). (F–H) Fmi localization did not show remarkable change in gogo loss-of-function (G) nor in
gogo overexpression (H) mutants compared with the wild type (F). (I, J) R8-specific Gogo-GFP (green) during
phase 2 in wild type (I) and Fmi overexpression mutants (J). R8 axons are labeled with myr-RFP (red) and
counterstained with anti-N-cadherin (blue). Gogo protein was localized along the vertical filopodia that
prematurely extended during phase 2 (arrows in J compared with I). Scale bars 10 mm.
The online version of this article includes the following source data for figure 4:
Source data 1. Source data for the quantification in Figure 4D-E.
L). GogoFFD did not suppress filopodia extension (Figure 5J and L), but GogoDDD did (Figure 5K
and L). This indicates that the phosphorylated form of Gogo is required for filopodia suppression
(function 2).
In previous studies, GogoFFD rescued the R axon targeting defects in adult stage to a consider-
able extent (Mann et al., 2012). However, in the current study at earlier stages, GogoFFD did not
completely rescue ectopic filopodia extension and axon bundling, thus resulting in a slightly prema-
ture R8 termini intrusion into the medulla neuropil during phase 2 (Figure 5M–Q). Therefore, Gogo
phosphorylation may occur sometime between phases 1 and 2 to suppress excessive filopodia for-
mation and extension during normal R8 axon development. These results suggest that non-phos-
phorylated Gogo governs function 1, while the phosphorylated form controls function 2, and that
each phosphorylation state has a decisive function in axon pathfinding to form complex functional
neuronal circuits.
Takechi et al. eLife 2021;10:e66718. DOI: https://doi.org/10.7554/eLife.66718 9 of 24Research article Developmental Biology Neuroscience
Figure 5. Dual function of Gogo controlled by the phosphorylation of YYD motif. (A–F) gogo rescue experiments
in a background of gogo[H1675]/gogo[D1600] during phase 1 (third instar larva). R8 axons were visualized with
mCD8GFP (green), and columns were labeled with N-cadherin (magenta). The targeting defects of gogo mutants
(A) were almost completely rescued by wild-type Gogo (B) and GogoFFD (D, non-phosphomimetic), but not
rescued by GogoDC (C) or GogoDDD (E, phosphomimetic). (F) Quantification of R8 axon terminals that intruded
into the medulla columnar center and failed to form a proper horseshoe shape at phase 1 (third instar larva). (G–L)
Horizontal images of R8 axons expressing GogoFFD or GogoDDD in an Fmi overexpression background at phase
2 (APF24%). R8 filopodia elongation was significantly repressed by wild-type Gogo (H) or GogoDDD (K), but not
by GogoDC (I) nor GogoFFD expression (J). Quantification of R8 axon filopodia length (L). The length of the
longest filopodia in a 3D image was measured and divided into three classes: 15 mm (magenta). (M–Q) Ectopic filopodia extension and axon bundling (arrows in M) in gogo mutants
(gogo[H1675]/gogo[D1600]) were rescued by wild-type Gogo (N), but not by GogoFFD expression (arrows in O)
during phase 2 (APF24%). (P) The R8 axons in GogoDDD-rescued animals were too disrupted to be quantified. (Q)
Quantification of the R8 axon invasion during phase 2. Scale bars 10 mm.
The online version of this article includes the following source data and figure supplement(s) for figure 5:
Source data 1. Source data for the quantification in Figure 5F.
Source data 2. Source data for the quantification in Figure 5L.
Source data 3. Source data for the quantification in Figure 5Q.
Figure 5 continued on next page
Takechi et al. eLife 2021;10:e66718. DOI: https://doi.org/10.7554/eLife.66718 10 of 24Research article Developmental Biology Neuroscience
Figure 5 continued
Figure supplement 1. Gogo and Fmi cytoplasmic domain change its functional properties.
Figure supplement 1—source data 1. Source data for the quantification in Figure 5—figure supplement 1B.
Figure supplement 1—source data 2. Source data for the quantification in Figure 5—figure supplement 1E.
Figure supplement 1—source data 3. Source data for the quantification in Figure 5—figure supplement 1H.
Suppression of Fmi by phosphorylated Gogo is mediated via adducin
Gogo interacts with the actin-capping protein Hu-li tai shao (Hts, Drosophila adducin homolog) to
control R8 neuron axonal extension (Ohler et al., 2011). Thus, we hypothesized that function 2 of
Gogo, which suppresses filopodia, relies on the actin-capping ability of Hts. Thereafter, R8-specific
hts LOF was analyzed. During phase 2, hts LOF R8 axon termini had excessive radial filopodia exten-
sions and an axon-axon bundling phenotype similar to gogo-/- mutants (Figure 5—figure supple-
ment 1A and B), suggesting that Hts works with Gogo to prevent excessive filopodia extension. To
determine which Gogo form works with Hts, Hts was co-overexpressed with GogoDDD or GogoFFD,
and observed during phase 3 (Figure 5—figure supplement 1C) and in adulthood (Figure 5—figure
supplement 1D). Wild-type Gogo or GogoDDD overexpression partially suppressed filopodia exten-
sion (Figure 5—figure supplement 1C). GogoDDD/Hts coexpression, but not GogoFFD/Hts coex-
pression, synergistically suppressed filopodia extension or resulted in R8 axon stalling at the medulla
surface layers (Figure 5—figure supplement 1C–E). These data indicate that phosphorylated Gogo
sends signals via Hts to suppress filopodia extension.
Glial cell insulin signal is critical for Gogo phosphorylation
The Gogo/Fmi interaction phenotype can be considered ‘cooperative’ in function 1 (phase 1) but
changes to ‘antagonistic’ in function 2 (phase 2) (Figures 2 and 3). This indicates that Gogo is phos-
phorylated during the transition from functions 1 to 2, but the mechanism is unclear. Previous work
indicates that DInR phosphorylates Gogo and is important for its function (Mann et al., 2012). DInR
has tyrosine kinase activity and is known to phosphorylate the YYD motif. Therefore, R8-specific dinr
LOF was created. The dinr LOF did not have defects in phase 1 (Figure 6A). During phase 2, the
dinr LOF R8 axons displayed a similar phenotype to the GogoFFD rescue and exhibited radial filopo-
dia extensions, thus resulting in R8 axon bundling and the premature invasion of the deeper medulla
layers (Figure 6A–C, compare with Figure 5D and O).
We next sought to determine how DInRs on R8 axons receive insulin signals. Previous gene
expression studies in the developing optic lobe revealed that among the eight dilp genes, dilp6 is
expressed in glial cells in Drosophila (Fernandes et al., 2017; Okamoto and Nishimura, 2015;
Rossi and Fernandes, 2018; Sousa-Nunes et al., 2011). By using Gal4 lines, dilp6 was confirmed to
be expressed in the surface and cortex glia at all developmental stages (Figure 6D and Figure 6—
figure supplement 1A–I). To identify whether glia contributes to Gogo phosphorylation in R8 axons,
glial-specific protein secretion was blocked during phase 2. Dynamin is known to control peptide
secretion, including insulin-like peptides (Wong et al., 2015). The temperature-sensitive dynamin
mutant (shibirets1 [shits1]) was specifically expressed in glial cells to block Dilp secretion. This pro-
duced a defective phenotype similar to the dinr LOF; R8 axons showed radical filopodia extensions
and bundling with premature invasion into deeper medulla layers (Figure 6E and F). These defects
were also observed when shits1 was specifically overexpressed in surface and cortex glial cells
(Figure 6G,J and M). Conversely, we could not see any defects when we block the protein secretion
from insulin-producing cells (IPC) (Figure 6K and M) or other types of glial cells, including medulla
neuropil glia and Chiasm glia (Figure 6H,I and M).
The hobbit gene is known to regulate Dilp secretion (Neuman and Bashirullah, 2018). Therefore,
hobbit was knocked down to block Dilp secretion specifically in glial cells. This produced a similar
phenotype as the dinr LOF, thus supporting the idea that glial Dilp controls R8 axonal targeting
(Figure 6L).
We further investigated the genetic interaction between dilp6 and Fmi overexpression
(Figure 6N–Q). Fmi overexpression counteracted phosphorylated Gogo, and created the sensitized
background to study Gogo function 2 (Figure 5K). In this background, we found that dilp6 RNAi
Takechi et al. eLife 2021;10:e66718. DOI: https://doi.org/10.7554/eLife.66718 11 of 24Research article Developmental Biology Neuroscience Figure 6. Glial insulin switches the Gogo-Fmi function from ‘cooperative’ to ‘antagonistic’. (A–C) The phenotype of R8-specific dinr loss-of-function (dinr heterozygotes with R8 cell-specific RNAi) at the third instar larvae and APF24% (phase 1 and 2) was analyzed using R8-specific mCD8GFP (green) counterstained with mAb24B10 (red in B) and anti-N-cadherin (magenta in A, blue in B). R8 axons bundled together, resulting in invasion into deeper medullar layers in phase 2 (arrows in B). (C) Quantification of the R8 axon invasion during phase 2. (D) Dilp6-Gal4 expression monitored by nuclear GFP Figure 6 continued on next page Takechi et al. eLife 2021;10:e66718. DOI: https://doi.org/10.7554/eLife.66718 12 of 24
Research article                                                                                       Developmental Biology Neuroscience

Figure 6 continued
reporter (green) was mainly observed in cortex and surface glial cells in the optic lobe during phase 2 (arrowheads). Glial cells were labeled with anti-
repo (red), and optic neuropils with anti-N-cadherin (blue). (E–K) The secretion of the Dilp was blocked in cells expressing UAS-shits1 using loco-Gal4 (E
and F) in all glial cells, GMR85G01-Gal4 (G) in surface and cortex glia, GMR25A01-Gal4 (H), Mz97-Gal4 (I) in wrapping and neuropil glia, dilp6-Gal4 (J)
and dilp2-Gal4 (K). During phase 2, R8 axons labeled by myr-tdTomato (green) showed the bundling phenotype in surface and cortex glia-specific shits1
expression (arrows in F, G, and J). Although these Gal4 drivers were expressed from the larval stages, the effect of blocking by shi[ts] began from
APF0% when the temperature was shifted to 29˚C. (L) Glia-specific inhibition of Dilp secretion by hobbit RNAi expressed under a loco-Gal4 driver. R8
axons bundled with each other, resulting in invasion into the deeper medullar layers (arrows). (M) Quantification of R8 axon invasion in E–L. (N–Q) To
investigate the genetic interaction between glial dilp6 and filopodia extension during phase 2, dilp6 RNAi was expressed in glial cells using dilp6-Gal4,
and Fmi was overexpressed in photoreceptors using GMR-Fmi. R8 axons were visualized using myr-tdTomato (red, white in the right side of each panel)
together with all photoreceptor axons (green) and N-cadherin (blue). GMR-Fmi flies showed enhanced filopodia extension (O). Knockdown of dilp6
using dilp6-Gal4 and UAS-dilp6RNAi significantly enhanced the phenotype (P), and several filopodia extended over the medulla (arrow). The dotted
line indicates the lower edge of the medulla. (Q) Quantification of the number of axons that extend over the medulla. Medulla region was determined
according to the Ncad staining. Total number of the filopodia extensions beyond the medulla were counted from several images, and the average
number per 10 mm section was calculated. **p
Research article                                                                                       Developmental Biology Neuroscience

                                    Figure 7. Glial Fmi and R8 Gogo/Fmi instruct R8 to recognize the columnar center. (A) R8 axon terminals
                                    visualized with myr-tdTomato (red, white) and glial cells visualized with mCD8GFP (green) and counterstained with
                                    anti-N-cadherin (blue) in phase 1 (third instar larva). The glial protrusion extended into the medulla layers as early
                                    as the R8 growth cone enters (arrowhead). In the oldest column, the glial protrusions have begun to retract (yellow
                                    arrow). (B) Fmi protein localization at the terminals of glial cells (red) was visualized by Fmi-FsF-mCherry and glial-
                                    specific FLPase (loco-Gal4 UAS-FLP) co-labeled with glial-specific mCD8GFP (green) and mAb24B10 for all R axons
                                    (blue) in phase 1 (third instar larva). The fluorescence intensity of Fmi-mCherry (red), glial-specific mCD8GFP
                                    (green), and stained R axons (blue) was measured across the column (dotted lines) and the average of eight axons
                                    (n = 3 animals) was shown in the graph (B’). (C–E) Medulla of the wild type (C) and glial-specific fmi loss-of-
                                    function (fmi heterozygote with glial cell-specific RNAi [loco-Gal4, UAS-RNAi, at 29℃]) (D) at each phase (third
                                    instar larvae, APF24%, 48%). Labeling is the same as in (A). The medulla columnar pattern is labeled with
                                    N-cadherin (magenta) and R axons with mAb24B10 (green). In glial-specific fmi loss-of-function, R8 axon terminals
                                    intruded into the medulla columnar center and failed to form a proper horseshoe shape during phase 1 (D), but
                                    no bundling was observed during phase 2 (D’). The columnar array was disrupted at APF48% (phase 3) (D’’). (E)
                                    Quantification of the R8 axon terminals that intruded into the medulla columnar center and failed to form a proper
                                    horseshoe shape at phase 1 (third instar larva). (F, G) The protrusions of glial cells (green) in medulla neuropils and
                                    Fmi-mCherry (red) in R8 cells were visualized in phase 1 (third instar larva). R axons were labeled with mAb24B10
                                    (blue). (H, I) Localization of R8 specific Gogo-GFP (green) in glia-specific fmi loss-of-function. R axons are labeled
                                    with mAb24B10 (magenta) in phase 1 (third instar larva). (J) Model for the interaction between dual-function Gogo
                                    and Fmi to navigate R8 axons. In phase 1, non-phosphorylated Gogo/Fmi at R8 termini interact in trans with Fmi
                                    localized on the glial surface to correctly recognize the medulla columnar center (gogo function 1). In phase 2,
                                    Figure 7 continued on next page

Takechi et al. eLife 2021;10:e66718. DOI: https://doi.org/10.7554/eLife.66718                                                                     14 of 24
Research article Developmental Biology Neuroscience
Figure 7 continued
Gogo is phosphorylated dependent on insulin signaling derived from surface and cortex glia. Phospho-Gogo
antagonizes Fmi, thereby suppressing filopodia extension (gogo function 2). In phase 3, Fmi alone brings the R8
axon to the M3 layer, since Gogo protein is no longer expressed in R8 axons by this phase (no gogo function).
Scale bars 10 mm.
The online version of this article includes the following source data and figure supplement(s) for figure 7:
Source data 1. Source data for the quantification in Figure 7E.
Figure supplement 1. Gogo and Fmi interact with Fmi to regulate cytoskeletal reorganization.
Figure supplement 1—source data 1. Source data for the quantification in Figure 7—figure supplement 1J.
Figure supplement 2. Genetic interaction between gogo and fmi in mushroom body.
Fmi relocate from the R8 axon horseshoe rim to other regions when R8 axon Fmi cannot bind to glial
Fmi. These results also indicate that the in trans interaction between glial Fmi and R8 Gogo/Fmi
mediates precise R8 axon recognition of the medulla columnar center, including the formation of a
horseshoe structure. Therefore, the phenotypes described here may be the consequence of the spe-
cific interruption of function 1, but not function 2 of Gogo. In other words, this glial Fmi and R8
Gogo interaction is mediated by non-phosphorylated Gogo, and later the phosphorylation of Gogo
switches the Gogo/Fmi function from ‘collaborative’ (function 1) to ‘antagonistic’ (function 2)
(Figure 5).
Taken together, these results suggest that the glial insulin signal controls the phosphorylation sta-
tus of Gogo, which regulates the growth cone dynamics of R8 and mediates axon-glia and axon-
axon interactions (Figure 6). This mechanism maintains a consistent distance between R8 axons, ena-
bles ordered R8 targeting of the column, and eventually contributes to the formation of the orga-
nized array of the medulla columns (Figure 7J).
Discussion
The current study demonstrated that R8 axons are guided in a stepwise manner via Gogo/Fmi inter-
actions that initially have a collaborative relationship, which later becomes antagonistic during the
development of the visual system (Figure 7J). During phase 1, dephosphorylated Gogo interacts
with Fmi in cis, and cooperatively functions to navigate R8 axons to the correct target. During this
stage, R8 Gogo interacts with glial Fmi to locate the column center and enable R8 axon terminals to
form a horseshoe-like morphology that encircles the central area of the medulla column. During
phase 2, Gogo is phosphorylated by the insulin signal derived from the surface and cortex glia. Phos-
phorylated Gogo antagonizes Fmi via Hts (adducin) to suppress filopodia extension. During phase 3,
Gogo is no longer expressed in R8 axons; therefore, Fmi alone navigates R8 axons to the M3 layer.
Two Gogo states control axon-axon interaction to maintain R8 axon distance and axon-column inter-
action for proper column targeting.
Similar Gogo/Fmi interactions are broadly utilized in the Drosophila nervous system. Previous
work has shown that Gogo and Fmi function in dendrite formation during the embryonic stage
(Hakeda-Suzuki et al., 2011; Hakeda and Suzuki, 2013). Additionally, phenotypic and genetic inter-
action analysis of gogo/fmi mutants/knockdowns in the mushroom body (MB) revealed that Gogo
and Fmi functionally cooperate or antagonize depending on the context to regulate correct axon
targeting similar to visual system (Figure 7—figure supplement 2). The MB is a higher center for
olfactory learning and memory (de Belle and Heisenberg, 1994). Previous studies have shown that
fmi mutant axons also have targeting defects in MB neurons (Reuter et al., 2003). Given that Fmi is
broadly functionally conserved among species (Berger-Müller and Suzuki, 2011; Rapti et al., 2017;
Shi et al., 2014; Tissir et al., 2002), elucidating the conserved function of Gogo/Fmi interactions in
the Drosophila brain can provide valuable insights into the formation of higher-order nervous sys-
tems, such as the mammalian brain.
Gogo and Fmi cooperatively mediate R8 axon-column interaction in
function 1 (phase 1)
During phase 1, R8 axon terminals form a horseshoe-like shape and encircle the medulla column cen-
ter. In this phase, Gogo and Fmi protein localize at the R8 axon terminal fringe surrounding the
Takechi et al. eLife 2021;10:e66718. DOI: https://doi.org/10.7554/eLife.66718 15 of 24Research article Developmental Biology Neuroscience
medulla center and appear to interact in cis (Figure 1M). Because GogoFFD rescued the gogo
mutant phenotype at this time point, it can be deduced that only the non-phosphorylated version is
required (Figure 5D–F).
We asked what does phosphorylation do to the function of Gogo. Gogo/Fmi interactions in cis
occur with the same affinity regardless of the Gogo phosphomimetic version in S2 cultured cells
(Mann et al., 2012). Furthermore, GogoDDD and GogoFFD localization did not differ in the R8
axon termini during phase 1 in vivo (Figure 5—figure supplement 1F), suggesting that the phos-
phorylation status of Gogo does not change the molecular affinity of Gogo/Fmi.
Gogo phosphorylation may control multiple aspects of this process, including downstream Gogo/
Fmi intracellular signaling. The Fmi downstream signaling pathway components that regulate den-
drite formation or planar cell polarity (PCP) are well known (Berger-Müller and Suzuki, 2011;
Kimura et al., 2006; Li et al., 2016; Lu et al., 1999; Usui et al., 1999; Wang et al., 2016). Previous
studies have shown that PCP complex mutants display normal R8 axon targeting in adulthood
(Hakeda-Suzuki et al., 2011). Moreover, the RNAi knockdown of components that are thought to
regulate the dendrite formation downstream of Fmi, such as PCP complexes and G alpha proteins,
did not result in defective R8 axon targeting phenotypes (data not shown). Functionally, the deletion
of the intracellular domain of Fmi can promote filopodia elongation but does not mediate column
center encircling (Figure 5—figure supplement 1G–I). Given that the Gogo cytoplasmic domain is
also required for column center encircling (Figure 5C), the Gogo/Fmi interaction in phase 1 may
send signals via both Gogo and Fmi cytoplasmic domains.
Previous studies have reported that Gogo/Fmi co-overexpression in R7 axons redirects them to
the M3 layer. This occurs when GogoFFD, but not GogoDDD, is expressed (Mann et al., 2012). The
observation of this redirection process showed that R7 axons do not extend in a stepwise manner
such as R8 axons but retreat to the M3 layer from M6 (Figure 7—figure supplement 1C and D).
This indicates that Gogo/Fmi co-overexpression does not form a code for M3 targeting but pro-
motes cytoskeletal reorganization, which might lead to R7 axon retraction. Consistent with this idea,
R7 retraction was recapitulated by overexpressing Rho by using GMR-Rho1 (Figure 7—figure sup-
plement 1F). It is well known that Rho promotes cytoskeletal reorganization by activating caspase
(Aznar and Lacal, 2001; Barrett et al., 1997; Mashima et al., 1999; Shi and Wei, 2007;
Sokolowski et al., 2014). The retraction ratio was also enhanced by co-overexpressing Gogo (Fig-
ure 7—figure supplement 1H and J).
Strong Gogo/Fmi co-overexpression results in serious cell death in the retina (Tomasi et al.,
2008), with greater cell death in GogoFFD than in GogoDDD. If these cell deaths are the result of
increased cytoskeleton reorganization, it may indicate that GogoFFD and Fmi cooperatively regulate
the cytoskeleton ectopically in various phases throughout photoreceptor development. This cyto-
skeletal reorganization mediated by GogoFFD might regulate the cytoskeleton in a similar manner
when R8 axon Gogo/Fmi interact with glial Fmi to form the horseshoe structure during phase 1 (Fig-
ures 2 and 7). However, the manner in which GogoFFD sends signals via downstream components
and regulates cytoskeleton reorganization is unknown; this must be addressed in the future.
Glia interact with R8 cells to guide R8 axons in function 1 (phase 1)
This study shows that Gogo/Fmi at the R8 termini interacts in trans with Fmi, which is localized on
the glial surface during phase 1 (Figure 7). Related to these findings, N-cadherin (Ncad) plays a role
in medulla column formation (Trush et al., 2019). Ncad mutant R8 axons have a defect in targeting
the medulla column, which is thought to be due to the difference in adhesive properties of the axons
in the column, that is, the differential adhesion hypothesis (DAH) (Foty and Steinberg, 2005;
Murakawa and Togashi, 2015; Trush et al., 2019). In this system, axons with greater Ncad expres-
sion tend to target the center of the column, whereas those with lower expression tend to surround
the edge of the column border. Ncad overexpression in R8 axons results in changes in termini mor-
phology and in the coverage of the entire medulla column surface (Trush et al., 2019).
In the current studies, Fmi overexpression in the R8 axon termini did not change the horseshoe
shape (Figure 3—figure supplement 1I). However, fmi LOF in R8 axons resulted in misguided filo-
podia invading the column center; this does not support the DAH theory for Fmi (Figure 2C). There-
fore, we suggest that as a cadherin, Fmi interacts homophilically in trans as Fmi/Fmi between glia
and R8 cells. Conversely, Gogo interacts with Fmi in cis to form Gogo/Fmi on the R8 membrane.
Takechi et al. eLife 2021;10:e66718. DOI: https://doi.org/10.7554/eLife.66718 16 of 24Research article Developmental Biology Neuroscience
Distinct signaling regulation via Gogo and Fmi cytoplasmic domains enables R8 axons to correctly
target the medulla column.
One interesting observation is that Gogo localization differed between R8 axon- and glial-specific
fmi LOFs: Gogo protein localization is more diffuse in R8 fmi LOF than in glial fmi LOF (Figures 4B
and 7I). It is known that Gogo and Fmi do not interact in trans, which was shown in cell culture sys-
tems (Hakeda-Suzuki et al., 2011). These observations suggest that Gogo/Fmi is not only interact-
ing with glial Fmi, but the Gogo ligand (factor X) exists on the glial membrane and interacts with
Gogo as Gogo/factor X, in addition to the Fmi/Fmi interaction. The functional role of factor X on
glial cells is unknown. Therefore, it is important to identify the role of factor X to reveal the functional
significance of glial-derived signaling during phase 1 of R8 axon targeting.
Temporal and spatial regulation of Gogo phosphorylation status by glia
In phase 1, R8 axons interact with Fmi on glial cells. In phase 2, R8 axons receive insulin from surface
and cortex glia. However, insulin expression started at the transcriptional level during phase 1 (Fig-
ure 6—figure supplement 1H and I); therefore, the temporal relationship of Gogo phosphorylation
and insulin expression onset does not match apparently.
One explanation is that it is regulated via changes in the relative position between the glia and
medulla during development. Glial position changes across phases 1 to 2 as the entire brain struc-
ture changes. There is a huge distance between glia and the medulla neuropil during phase 1 that
drastically shrinks by phase 2. This physical distance between glia and R8 axon termini might influ-
ence the reception efficiency of insulin.
The second explanation is that there might be a slow transition between the non-phosphorylated
state to the phosphorylated state. Gogo coexists as two phosphorylated states in the tip of R8 axons
when R8 axons reach the medulla column. Only the microlocalization of the two phosphorylated
states might be differently regulated. The shape of the growth cone was shown to be different
between GogoFFD rescue and wild type rescue in the gogo mutant during phase 1 (Figure 5B and
D). This difference might be due to Gogo phosphorylation and may occur even in wild type overex-
pression that gained the ability to suppress filopodia extension in phase 1.
The transition of total Gogo protein levels in the R8 axons also appeared to be slow. This is based
on the observation that gogo-Gal4 strain, in which Gal4 is knocked into the gogo intron locus by
using the MiMIC system (Venken et al., 2011), loses GFP protein levels (monitored by UAS-
mCD8GFP, Figure 1—figure supplement 1) gradually, similar to the gradual decrease of Gogo-GFP
fusion protein during the midpupal stages. This indicates that Gogo protein perdurance is similar to
mCD8GFP and is not actively degraded by the ubiquitin-proteasome pathway. In summary, in con-
trast to the stepwise regulation of R8 axon extension that occurs in precise temporal phases, the
slow transition of Gogo phosphorylation and the protein level decrease seem not to be the only reg-
ulatory signals that determine whether R8 axons are extended or not.
Gogo acts antagonistically against Fmi in R8 axon-axon interactions in
function 2 (phase 2)
Filopodia are formed by actin polymerization. If the concentration is above a specific threshold, in
vitro experiments suggest that actin can polymerize itself. The actin concentration in vivo is typically
higher than the threshold. This suggests that actin should primarily be controlled by factors that
interfere with or suppress uncoordinated actin fiber polymerization in the R8 axon growth cone
(Pantaloni et al., 2001; Pollard and Borisy, 2003). To prevent filopodia extension, actin-capping
proteins bind to the end of F-actin, which blocks further actin fiber polymerization. The current study
showed that phosphorylated Gogo activates the actin-capping protein Hts to prevent uncontrolled
actin polymerization in R8 axon termini (Figure 5—figure supplement 1C–E). The overexpression of
Hts in R8 axons alone did not prevent R8 filopodia extension, thus suggesting that phosphorylated
Gogo is required. However, a previous cell culture study demonstrated that physical Gogo/Hts inter-
actions take place regardless of the phosphorylation status of the YYD motif (Mann et al., 2012).
This suggests that phosphorylated Gogo regulates Hts enzymatic activity rather than binding. The
enzymatic activity of the Hts homolog adducin is controlled by Ser/Thr kinases in mammals
(Fukata et al., 1999; Matsuoka et al., 1996; Matsuoka et al., 2000). This type of Ser/Thr kinase
activation might occur in conjunction with the activation of the Tyr kinase that phosphorylates the
Takechi et al. eLife 2021;10:e66718. DOI: https://doi.org/10.7554/eLife.66718 17 of 24You can also read