Future Airspace Strategy (FAS): UK Continuous Climb Operations (CCOs) Cost Benefit Analysis - (CBA) CAP 1062 - Civil Aviation ...
←
→
Page content transcription
If your browser does not render page correctly, please read the page content below

Future Airspace Strategy (FAS): UK Continuous
Climb Operations (CCOs) Cost Benefit Analysis
(CBA)
CAP 1062
CAP 1062

Future Airspace Strategy (FAS): UK
Continuous Climb Operations (CCOs) Cost
Benefit Analysis (CBA)

www.caa.co.uk

July 2013

© Civil Aviation Authority 2013

All rights reserved. Copies of this publication may be reproduced for personal use, or for use within a
company or organisation, but may not otherwise be reproduced for publication.

To use or reference CAA publications for any other purpose, for example within training material for
students, please contact the CAA at the address below for formal agreement.

Enquiries regarding the content of this publication should be addressed to:
Regulatory Policy Group, Civil Aviation Authority, CAA House, 45 - 49 Kingsway, London, WC2B 6TE

The latest version of this document is available in electronic format at www.caa.co.uk/publications

CAP 1062                                                                      Contents

            Contents

            Foreword		                                                   9

            Executive Summary                                            11
                         Background                                      11
                         Benefit to Cost Ratio (BCR)                     11
                         Benefits                                        12
                         Costs                                           13

            Section 1		                                                  14

            Future Airspace Strategy (FAS)                               14

            Section 2		                                                  15

            CCO study scope and limitations                              15

            Section 3		                                                  17

            CBA Design and Methodology                                   17

            Section 4		                                                  18

            Continuous Climb Operations (CCOs)                           18

            Section 5		                                                  20

            CCO Assumptions                                              20
                         Performance Based Navigation (PBN) capability   20
                         Scenarios                                       22
                         Major airspace redesign programmes              23
                         Coverage of costs and benefits                  24
                              Transition Altitude (TA)                   27
                              LAMP                                       28
                              NTCA                                       28

July 2013                                                                       Page 5
CAP 1062 Contents
Other airspace redesign costs 28
Aircraft categories 29
Calculating flight efficiency and CO2 savings 30
Air Traffic Demand 32
Airport Capacity 33
Fuel prices 34
Passenger time 34
Delay cost savings 34
Carbon prices 35
Price levels 35
Discount rate 36
Section 6 37
CCO Benefits 37
Quantified fuel efficiency, CO2 and time savings 37
Noise Benefits 39
Safety 41
Access to controlled airspace 42
ATC workload / sector capacity increase 43
Benefits at airports not included in this study 43
Section 7 45
Direct CCO Costs (operations at airports included in this study) 45
Attributing costs 45
Aircraft equipage – Performance Based Navigation (PBN) 46
Airspace Modernisation 51
Major Airspace Modernisation Programmes (TA, LAMP,
NTCA) 51
Airport level airspace redesign costs 53
NPV of Total Costs 53
Section 8 55
Indirect costs (operations at impacted airports outside of this study) 55
Military costs 55
July 2013 Page 6CAP 1062 Contents
Cost to operators at airports outside the study 56
Section 9 58
Summary of NPV of Costs and Benefits 58
Section 10 59
Benefit to Cost Ratio (BCR) 59
Section 11 62
Distributional Analysis 62
Annex A
Assessing the Overall Benefits of FAS Deployment 64
Annex B
Developing a Cost Benefit Analysis (CBA) framework for the FAS 66
Annex C
Total Aircraft Movements 2011 68
Annex D
CCO baseline performance at Heathrow, Gatwick, Stansted,
Manchester and Birmingham 70
Annex E
Carbon prices 73
Annex F
Example of derivation of baseline 2011 expected benefits by aircraft
type at Heathrow 75
July 2013 Page 7CAP 1062 Contents
Annex G
Baseline year (2011) benefits by airport 78
Annex H
Sensitivity Analysis 81
CCO Scenario – 80 per cent and 60 per cent continuous
climbs achieved 81
Discount Rate – UK recommended rate of 3.5 per cent 85
Exchange Rate – 2012 average Euro exchange rate 86
Annex I
CAA PBN Capability Study results 89
Annex J
Summary of Assumptions and Uncertainties 90
Annex K
York Aviation Independent Validation Commentary 96
July 2013 Page 8CAP 1062 Foreword
Foreword
Aviation relies on the scarce resource that is airspace to ensure that consumers,
businesses, the military and leisure flyers enjoy the many benefits aviation brings.
The basic structure of the UK’s airspace was developed over forty years ago. Since
then there have been huge changes in the pressures on airspace, including a hundred
fold increase in demand for aviation coupled with intense pressure to mitigate the
environmental impacts of aviation From the airline perspective, fuel accounts for their
largest cost and, as a consequence, any operational profile that reduces fuel burn has
both an environmental and an economic benefit.
Throughout Europe there is ambition to simplify and harmonise the way airspace
and air traffic control is used through the Single European Sky project. In the UK and
Ireland we’re meeting those and other issues through the Future Airspace Strategy
(FAS) which sets out a plan to modernise airspace by 2020.
To help quantify the benefits that FAS can deliver, and the costs of implementing
these changes, we have undertaken a detailed study on one of the main benefits that
we anticipate – Continuous Climb Operations (CCO), where an aircraft is able to climb
to its optimal cruising height without having to stop at various levels in-between,
which is currently the case in many tactical situations.
We wanted to scope the benefits to consumers and wider society from this FAS
deliverable and also provide findings from a wider consumer and societal perspective,
rather than the commercially focused assessments industry stakeholders will
produce as part of their own investment strategies to realise the benefits of FAS.
While the study examines only one of the operational improvements that FAS could
bring, it also aims to set a framework for future FAS analysis that would build a
comprehensive picture of the full benefits and costs associated with this important
project.
We encourage you to review this document and use it and its findings where
appropriate in your organisation. We are keen to hear any feedback that you have on
this type of work and the benefits you consider it brings to the industry. If you have
any comments on it or would like to discuss this work in more detail please email
Amanda Downing (amanda.downing@caa.co.uk)
Mark Swan
Director of Airspace Policy
July 2013 Page 9York York Aviation LLP
Primary House
Aviation Spring Gardens
Macclesfield
Cheshire SK10 2DX
Tel: 01625 614051
Fax: 01625 426159
E-mail: louise.congdon@yorkaviation.co.uk
www.yorkaviation.co.uk
18th April 2013
Continuous Climb Operations (CCOs) Cost Benefit Analysis: Validation & Assurance
We have now had the opportunity to review the revised draft of Continuous Climb Operations
(CCOs) Cost Benefit Analysis. We note that this version has addressed the great majority of our
comments from the previous draft.
We have revised our note (see Annex K) to delete points which have been fully resolved. The
comments that remain have generally been addressed in the revised draft, but they relate to issues
and uncertainties that are not practically solvable and which we believe need to be recorded as
such. Where this is the case, we recognise that appropriate wording has been added to the Report
to clarify the position in relation to these issues and note their existence and their potential impact
on the analysis. They do, however, of course, remain weaknesses and hence they remain in our
accompanying note.
We have also reiterated some previous comments that agreed with the approach taken in relation
to potentially particularly important assumptions.
Overall, we are happy to verify that we believe the Continuous Climb Operations (CCOs) Cost
Benefit Analysis to:
be methodologically appropriate to undertaking a high level analysis of an
operation outcome in this context and that it includes all relevant aspects;
have taken a sensible approach to the limitations and biases of the sources of
data;
have been conducted in line with best practice.
Best regards
Louise Congdon
Managing PartnerCAP 1062 Executive Summary
Executive Summary
Background
1. The approach of this study was to provide a high level assessment of
the benefits and costs of continuous climb implementation across the
UK.
2. It forms only one part of the overall evaluation of FAS benefits. It
captures the impact of implementing fully systemised continuous climb
operations only and therefore does not capture all the benefits expected
from full FAS deployment.
3. The costs and benefits are highly dependent on the deployment plan
timescale and therefore represent an illustration of what benefits
and costs could be expected under such timescales and will change
depending on the final timescale agreed for FAS deployments affecting
continuous climb operations.
4. At this stage, not all the costs and benefits are known but quantification
of the benefits and costs has been done to the maximum possible
extent and remain estimates in approximate terms. Qualitative benefits
and costs have also been identified and described where possible.
Benefit to Cost Ratio (BCR)
5. The BCR was positive for central scenarios assuming fully systemised
CCOs for the airports included in this study. This indicates a net benefit
to the UK from supporting the implementation of fully systemised
CCOs.
6. The BCRs ranges from 2.1 (benefits 110 per cent greater than costs) to
4.1 (benefits 310 per cent greater than costs) depending on how quickly
fully systemised CCOs could be implemented and the extent of the
costs faced.
7. If fully systemised CCOs were not able to be achieved, the BCRs
decrease significantly. 80 per cent CCO achievement generates a BCR
range of 1.3 to 2.6 and a 60 per cent CCO achievement generates a BCR
range of 0.6 to 1.3. These situations include scenarios where the net
benefits are not greater than the net costs.
July 2013 Page 11CAP 1062 Executive Summary
8. Military costs have not been factored into this analysis. However, as
long as military costs directly attributable to fully systemised CCOs are
less than approximately £70 million a net benefit to the UK from fully
systemised CCOs should remain.
9. Passengers and commercial aircraft operators at the airports included
in the study would be clear winners of fully systemised CCOs with
benefits significantly greater than the costs.
10. The position of airports, ANSPs and aircraft operators outside the
airports in this study is less clear as many of the benefits to these
stakeholders have not been able to be fully quantified, e.g. safety
benefits, pilot and controller workload and potential airspace capacity
release. However, this is only one operational improvement and it is
widely expected that these stakeholders will receive significant benefits
in other areas.
11. The military position is less favourable, with costs incurred but the
benefit limited to the ability to continue to operate as they do currently.
Benefits
12. Quantified benefits include fuel savings, passenger time savings,
operator time savings and CO2 emission savings. Other possible
qualitative benefits include safety, air traffic controller workload, and the
release of controlled airspace.
13. The expected benefits from fully systemised continuous climb
operations (CCOs) across the UK could be up to £16 million per year.
Of this 26 per cent is expected to accrue to aircraft operators through
reduced fuel costs, a further 30 per cent to aircraft operators through
time and maintenance savings, 43 per cent to passengers through time
savings and 2 per cent to reduced carbon emissions.
14. Over the timeframe of the FAS (up to 2030) expected benefits from
fully systemised CCOs could range from £142 million to £208 million
depending on the implementation timescales of the different airports.
15. Expected benefits from CCOs depend on the implementation
timeframe for the airports with the greatest possible benefits to be
achieved. Expected benefits are highest when fully systemised CCOs
at Heathrow and London City airports are implemented at the beginning
rather than the end of the deployment phase. A late implementation of
July 2013 Page 12CAP 1062 Executive Summary
Heathrow and London City airports results in approximately 30 per cent
loss of total expected benefits.
16. Expected benefits from CCOs are also highly dependent on the extent
to which full systemisation of CCOs can be achieved. Fully systemised
CCOs generated 60 per cent greater benefits compared to 80 per cent
CCO achievement, and fully systemised CCOs generated 230 per cent
greater benefits compared to a 60% CCO achievement level.
Costs
17. Quantified direct costs include aircraft retrofit, airport airspace redesign,
and major airspace redesign and potential indirect costs to other
operators. These costs have been assumed to include the necessary
training, consultation, certification and publication of procedure costs.
18. It is not currently possible to quantify any costs to the UK military
related to aircraft retrofit.
19. Over the timeframe of the FAS (up to 2030) estimated direct costs
attributable to fully systemised CCOs could range from £41.7 million
under a low cost scenario to £65.3 million under a high cost scenario
depending on the implementation timescales of the different airports.
20. If indirect costs are included the estimated costs attributable to fully
systemised climbs would increase to £42.1 million under a low cost
scenario to £70.7 million under a high cost scenario.
July 2013 Page 13CAP 1062 Section 1: Future Airspace Strategy (FAS)
SECTION 1
1
Future Airspace Strategy (FAS)
1.1 The UK’s FAS was developed by the CAA, with contributions from
the Department for Transport (DfT), Ministry of Defence (MoD) and
NATS (the UK’s main Air Navigation Service Provider), and considers
the development of the UK’s airspace system from 2011 to 2030.
The Strategy sets the direction for how planning, management and
regulation of UK airspace should develop to maintain and improve
the UK’s high levels of safety while addressing the many different
requirements on the airspace system, and delivering balanced or
‘optimal’ outcomes, taking into account all those involved in, or affected
by, the use of airspace.1
1.2 The FAS itself did not provide a detailed roadmap or plan for the
implementation of changes to the UK’s airspace system. Similarly,
it did not provide a blueprint, or future design for the UK’s airspace
structure, but it did set the direction for future detailed pieces of work
to be progressed in these areas. A FAS industry implementation group
(FASIIG) was set up in 2011 in order to drive forward the development of
a network-wide FAS deployment plan by end of 2012. The deployment
plan includes detailed actions required across the industry as well as
a network-wide assessment of the benefits and costs associated with
FAS deployment.
1 CAA (2011) Future Airspace Strategy for the United Kingdom 2011 to 2030; http://www.caa.co.uk/
default.aspx?catid=64&pageid=12068
July 2013 Page 14CAP 1062 Section 2: CCO study scope and limitations
SECTION 2
2
CCO study scope and limitations
2.1 The CAA is particularly interested in the benefits to consumers and
wider society from the FAS and is therefore leading this work to assess
the costs and benefits from a wider consumer and societal perspective
separately from the commercially focused assessments industry
stakeholders will produce as part of their own investment strategies.
2.2 This study examines only one of the operational improvements,
CCOs, expected as part of FAS deployment and does not capture all
the benefits expected from full FAS deployment. It also aims to set
a framework for future strategic FAS deployment analysis working
towards a more comprehensive picture of the full benefits and costs
associated with FAS deployment.
2.3 This work is purposely structured from a strategic network-wide
level and does not attempt to capture the level of detail that one
would expect to see from industry stakeholders regarding their own
individual business cases for FAS deployment. It is intended to provide
the industry, and the CAA, with an assessment of the strategic
benefits available to consumers and society from the FAS and leaves
industry stakeholders to develop a commercially viable deployment
plan to realise these benefits. It is recognised that the realisation of
CCO benefits in this study is dependent on this commercially viable
deployment plan, which may be more difficult for some stakeholders.
However, the CAA hope that the results of this study and evidence
of wider network benefits could be used by stakeholders in the
development of their individual commercial investment plans.
2.4 It is not expected that the figures in this report will align exactly to other
cost benefit studies in the industry2. The scope and focus of this study
is likely to be different as this report solely captures CCO benefits and
other reports are likely to cover other operational changes or different
2 Other cost benefits studies in the industry include SESAR Macroeconomic CBA (http://www.
sesarju.eu/news-press/documents/assessing-macroeconomic-impact-sesar-874), and other
potential organisation specific business cases, e.g. future LAMP, TA, or NTCA business cases
produced by NATS, airport business cases for airspace changes, or aircraft operator business cases
for aircraft retrofit.
July 2013 Page 15CAP 1062 Section 2: CCO study scope and limitations
timescales; however, this reports uses transparent industry and UK
recommended standard assumptions where possible.
2.5 Sections 4 and 5 describe continuous climb operations (CCOs) and
the assumptions used in the study to assess the benefits and costs
of CCOs. Sections 6 and 7, respectively, set out how the estimated
benefits and costs of implementing full continuous climb operations
have been calculated. Section 8 describes the impact at airports and to
airspace users not included in this study and finally section 9 illustrates
the impact across different groups of users in the UK.
July 2013 Page 16CAP 1062 Section 3: CBA Design and Methodology
SECTION 3
3
CBA Design and Methodology
3.1 Quantification of the benefits and costs has been done to the extent
required to provide a robust strategic assessment of the costs and
benefits. Qualitative benefits and costs have also been identified and
described where possible.
3.2 As an initial step towards developing a methodology to be applied
rigorously in the future, this study covers the costs and benefits for
continuous climb operations only, which is only one of many operational
improvement areas in the FAS. Annex A in this report covers the wider
context of the overall assessment of the benefits of the FAS and Annex
B describes the development of a cost benefit analysis framework for
operational improvements in the FAS that was used in order to conduct
this study.
July 2013 Page 17CAP 1062 Section 4: Continuous Climb Operations (CCOs)
SECTION 4
4
Continuous Climb Operations (CCOs)
4.1 One of the characteristics of the UK’s future airspace system as
described in the FAS document is routeing based on ‘user preferred
trajectories’. User preferred trajectories include a 2D element to allow
users’ preferences to fly as direct a route as possible across the ground
(horizontal performance); a 3D element to allow users’ preference
to fly an optimal vertical profile that minimises fuel burn (vertical
performance); and a 4D element that introduces the dimension of
time, allowing users to combine horizontal and vertical performance
while ensuring synchronisation of flight profiles to minimise, and where
possible, remove delays and optimise the overall flow of air traffic.
4.2 In June 2012 a voluntary industry Departures Code of Practice was
published by Sustainable Aviation compiled by a group representing
aerospace manufacturers, airlines, airports, air traffic control, and the
CAA’s Environmental Research and Consultancy Department (ERCD).3
It gives advice on operational techniques, including CCOs, aimed
at improving the environmental impacts of aircraft operations. The
Sustainable Aviation work has been used in this study to define the
concept of a CCO, but not in the actual calculation of expected benefits.
4.3 In this study, CCOs refer to the removal of the airspace constraints
that result in a stepped climb to cruise, thereby providing an optimised
continuous climb, dependent on the aircraft’s own configuration and
performance capability, which varies across the fleet of aircraft operating
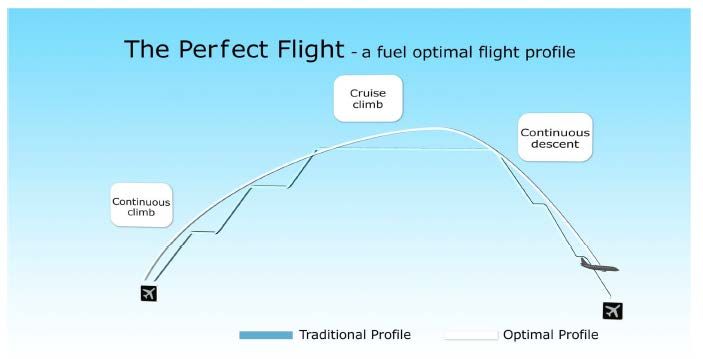
in UK airspace. Figure 1 below illustrates the components of a perfect
flight based on vertical performance, which includes a continuous climb
component. A continuous climb from departure to cruising altitude
significantly increases the fuel efficiency of the aircraft delivering fuel
savings to aircraft operators as well as delivering emission savings.
4.4 As highlighted in the Departures Code, the principle of a CCO is
to provide a continuous climb from lift-off to optimum cruise level.
However, fuel savings can also be realised by minimising the duration
of level flight and/or increasing the altitude at which any necessary
3 Sustainable Aviation (June 2012) Reducing the Environmental Impacts of Ground Operations
and Departing Aircraft. http://www.sustainableaviation.co.uk/wp-content/uploads/
DCOPractice2012approvedhi-res.pdf (last accessed 17/8/2012)
July 2013 Page 18CAP 1062 Section 4: Continuous Climb Operations (CCOs)
level offs are given. Fuel penalties increase with the number of level off
segments incurred by the aircraft. The Departures Code illustrates that
the fuel penalty for an aircraft with one level off segment at 6,000ft at
ten nautical miles is between three and seven per cent, which is lower
than the fuel penalty of between five and eight per cent for two level
offs with one at 6,000ft for ten nautical miles and a second at flight level
195 for five nautical miles. As mentioned in 4.2 this data has not been
used in the actual calculation of expected benefits in this study, but
does support that fuel savings can be expected from removing level off
segments.
4.5 Currently within the UK, aircraft can be offered a continuous climb if it is
cleared to do so by an air traffic controller (ATC) on a tactical basis and
the airspace design permits it to occur; however these procedures are
not included in the standard instrument departures (SIDs) and cannot be
offered on a routine basis. This is due to the complexity of the current
airspace design from a number of factors, such as the close proximity
of other airports, the need to level off aircraft to de-conflict with another
aircraft trajectory and the use of, and need to avoid, airborne holding
stacks. Full user preferred trajectories would not be possible in densely
trafficked terminal manouvering areas (TMAs), due to the complexity
cause by a wide range of different arrival and departure routes.
Consequently the optimum design within a TMA is likely to be a highly
systemised structure of 2 and 3-D routes that incorporate continuous
climb and continuous descent operations.
Figure 1 - NATS depiction of the perfect flight based on vertical performance
July 2013 Page 19CAP 1062 Section 5: CCO Assumptions
SECTION 5
5
CCO Assumptions
5.1 This section describes the assumptions that have been used in this
study.
Performance Based Navigation (PBN) capability
5.2 PBN sets the level of accuracy, integrity and continuity that an
aircraft’s navigation systems will have to meet as well as the required
functionality. PBN will allow the implementation of airspace structures
that take advantage of aircraft able to fly more flexible, accurate,
repeatable and therefore deterministic three dimensional flight paths
using onboard equipment capabilities. It has been described as
reengineering the way we fly.
5.3 PBN requirements are expressed in navigation specifications in terms of
accuracy, integrity, continuity and functionality required for the operation
on a particular route or procedure. PBN is described through RNAV and
RNP Applications with respective RNAV and RNP Operations.
5.4 RNAV (RNAV1 , RNAV 5 etc.)– navigation specification based on
area navigation that does not include the requirement for on-board
performance monitoring and alerting
5.5 RNP (RNP 4 etc.) – navigation specification based on area navigation
that includes the requirement for on-board performance monitoring and
alerting.
5.6 In October 2011, the CAA and IAA jointly published the Policy for the
Application of Performance-based Navigation in UK/Ireland Airspace4.
It set out the framework around which PBN can be applied as well
as providing the regulatory mechanism for the scale of change that
will have to be undertaken by the respective Air Navigation Service
Providers (ANSPs) in order to realise the projected benefits. The PBN
policy stated that RNAV1 capable aircraft should operate on strategic
ATS routes, all new terminal airspace procedures shall be designed
using PBN terminal airspace procedure criteria and that all new terminal
airspace designs should facilitate the use of CCO and CDOs. A “soft
4 CAA (October 2011) Policy for the Application of Performance-based Navigation in UK/Ireland
Airspace; http://www.caa.co.uk/default.aspx?catid=7&pagetype=90&pageid=13334
July 2013 Page 20CAP 1062 Section 5: CCO Assumptions
mandate” for PBN in terminal airspace is also provided, which could
mean that the CAA would provide a mandate for a specific route or
volume of airspace only rather than a requirement for all UK aircraft
operators. This study has assumed PBN capability for only aircraft
operating at the airports included in this study in line with the “soft
mandate” approach.
5.7 PBN will lead to flight efficiency improvement and allow optimisation
of the airspace. Without the constraints of navigating via fixed, ground-
based aids, it provides the airspace designer with a powerful tool in
terms of positioning routes and instrument flight procedures in relation
to areas of congestion or population density. PBN can offer predictable
and repeatable path trajectories moving to a systemised environment
with designed interactions, and closer spaced routes, amongst other
benefits.
5.8 From an airspace and airports perspective the envisaged benefits of
PBN include an increase in capacity in existing controlled airspace,
greater access to airports (especially for general aviation (GA) aircraft
which have traditionally been limited due to their basic equipment),
improvements in safety, and a reduction in the effects that flights have
on the environment from more efficient routes and more accurate path
keeping for noise abatement.
5.9 From an ANSP perspective the envisaged benefits of PBN include
reduced service cost through reduced navigational infrastructure,
increased systemisation and increased controller productivity;
improvement in safety and improvement in the quality of the service to
meet new airspace user requirements. The navigation infrastructure is
a key element of PBN and is linked to a move towards a space-based
navigation environment. This in turn will allow rationalisation of ground
infrastructure (e.g. VOR) leading to savings from capital investment,
maintenance and spectrum utilisation.
5.10 Given the strong regulatory policy direction this study assumes that
all future SID and airspace redesigns included in an airspace change
proposal under CAP725 will be based on PBN procedures and therefore
require PBN compliance from aircraft operating in that area. Specifically,
this study has assumed that airspace changes to implement fully
systemised CCOs will require a RNAV1 level of PBN capability.
July 2013 Page 21CAP 1062 Section 5: CCO Assumptions
Scenarios
5.11 The benefits and costs in this study have been assessed against a
baseline, or “do nothing”, scenario. The baseline scenario is based on the
actual radar data and current CCO performance up to at least 18,000ft
and assumes a continuation of this level of CCO performance in the
future. It is recognised that this does not take into account departures
where a level off was first incurred at/or above 18,000ft; however,
the vast majority of level off segments will occur below 18,000ft and
therefore this is deemed to be a satisfactory approximation for baseline
performance.
5.12 Currently CCOs in the UK are generally offered on a tactical basis by air
traffic controllers based on available capacity. In the baseline scenario, if
increased traffic levels were to decrease the frequency at which tactical
CCOs could be offered the baseline CCO performance level would
decrease. If this were the case benefits would be expected to be higher
than those included in this study as there would be a greater potential
benefit from fully systemised CCOs.
5.13 The three CCO scenarios, or “do something” scenarios, in this study
assume a full continuous climb (based on aircraft performance)
from departure to cruise level and attempt to reflect the difference
in expected benefits related to the timing and coordination of
implementation:
CCO Scenario 1 – early full implementation
All airports implement CCOs by 2016
CCO Scenario 2 – staged implementation leading with Heathrow
LTMA5 – Heathrow / London city from 2016; Gatwick from 2018;
Stansted/Luton from 2020
NTCA6 – all from 2016
Elsewhere7 from 2016
CCO Scenario 3 – staged implementation finishing with Heathrow
LTMA – Stansted/Luton from 2016; Gatwick from 2018; Heathrow /
London city from 2020
5 Includes Heathrow, Gatwick, Stansted, Luton and London City airports
6 Includes Manchester, Liverpool John Lennon, and Newcastle airports
7 Includes Birmingham, Edinburgh and Glasgow, Bristol
July 2013 Page 22CAP 1062 Section 5: CCO Assumptions
NTCA – all from 2016
Elsewhere from 2016
5.14 These scenarios are affected by three key factors. Firstly, benefits and
costs are highly dependent on implementation timescales that are
currently being determined and agreed as part of FAS Deployment.
Actual implementation timescales will likely change from those
assumed in this study, but the scenarios still give an indication of
how the net benefits would change with different implementation
timescales.
5.15 Secondly, although the vision in the FAS is to enable fully systemised
CCOs, in reality the complexity of UK airspace, particularly in the London
Terminal Manoeuvring Area (LTMA), may mean this is not feasible for
all SIDs or for all times in the day. Therefore, it is acknowledged that
the figures in the CCO scenarios represent maximum benefits which
could be achieved. Sensitivity analysis has been conducted on the CCO
scenarios assumption of full continuous climbs, with analysis of the
benefits realised with an 80 per cent and 60 per cent achievement of
fully systemised CCOs where current performance levels are below
those levels. The results of this sensitivity analysis can be found in
Annex H.
5.16 Finally, the CCO scenarios do not cover any changes to the length or
horizontal profiles of the SIDs which is very important to bear in mind.
It is envisaged that PBN capabilities will enable changes to SIDs other
than just vertical performance and therefore these scenarios are on
the conservative side from airspace redesigns with departure profile
changes. It is not possible to currently quantify potential benefits of
horizontal changes to departure profiles.
5.17 Costs in the study have been assumed to arise from the baseline year in
2011 for both aircraft equipage and airspace redesigns and are assumed
to be evenly spread across during the implementation phases. It is
recognised that this may overestimate the net present value of the
costs through lower discounting of costs if in practice costs are not
incurred until a later date.
Major airspace redesign programmes
5.18 Major airspace redesign programmes are a cornerstone of the FAS
deployment and form one of NATS’ main contribution to the FAS.
The current airspace design does not effectively separate arrival and
July 2013 Page 23CAP 1062 Section 5: CCO Assumptions
departure flows to individual airports onto dedicated routes. Interactions
between traffic flows create the need for tactical interventions that
interrupt CCOs as well as interrupting CDOs, increasing controller and
pilot workload and reducing airspace capacity.
5.19 Currently many departures, mainly in the London terminal environment,
level off at between four and seven thousand feet in order avoid
incoming traffic not allowing for fully systemised CCOs. The London
Airspace Management Programme (LAMP) and the Northern Terminal
Control Area (NTCA) airspace redesigns, in conjunction with a change to
the Transition Altitude (TA) across the UK to 18,000 ft, aim to maximise
the achievement of CCOs.
5.20 This study assumes that the TA, LAMP and NTCA major airspace
redesigns are implemented as required for each of the benefit
scenarios, and that other airspace redesigns are undertaken where
necessary to facilitate fully systemised CCOs at the airports included
in this study. The full costs of all initiatives included in this section have
been included.
Coverage of costs and benefits
5.21 The starting point for identifying airports to include in the study was UK
airports with annual commercial movements around or above 40,000 air
traffic movements (ATM) per year in order to capture the airports that
could be expected to derive the greatest benefits from CCOs.
5.22 Airports from this group were then chosen based on the information
that was available to the CAA in order to appropriately compare baseline
and future scenarios and estimate the benefits from the change in
operation. Radar data was available for several airports and other
airports were judged to have relatively similar mixes of traffic and/or
movements. Table 1 lists the UK airports that have been included in this
report to generate the expected benefits.
July 2013 Page 24CAP 1062 Section 5: CCO Assumptions
Table 1 – Airports used in the study to calculate expected benefits and
source of data
Radar data Estimated from radar data at proxy
airport
Heathrow
Gatwick
Stansted Luton
Manchester
London City
Birmingham Edinburgh
Glasgow
Liverpool
Newcastle
Bristol
5.23 Stansted was chosen as a proxy for Luton airport as it was the most
similar London airport8. Birmingham airport was chosen as the proxy
airport for Edinburgh, Glasgow, Liverpool, Newcastle and Bristol airports
due to the relatively similar expected baseline CCO performance of the
airports9.
5.24 Five airports were omitted from the study as they were deemed to have
traffic mixes that were unique and therefore did not fit close enough
with the radar data that was available10.
5.25 Radar data covering a 92 day period over the summer 2011 was
used to estimate baseline data for Heathrow, Gatwick, Stansted and
Manchester airports. Data for London City airport was from the same
8 It is acknowledged that Luton airport has a slightly different mix of commercial and business traffic;
however it was deemed to be an appropriate approximation at the aggregate level of this study.
Additionally Luton has lower movements per year and therefore the benefits have been adjusted to
the proportionate level (67 per cent) of traffic compared to Stansted.
9 It is recognised that Liverpool, Newcastle and Bristol airports annual ATM movements are almost
half those at Birmingham and therefore overestimate the benefits at these airports. Therefore
benefits figures at these airports have been computed at 50 per cent of Birmingham figures for
2011.
10 These airports included Aberdeen, East Midlands International, Belfast International, Belfast City
and Southampton.
July 2013 Page 25CAP 1062 Section 5: CCO Assumptions
92 day summer period, but from 2006 rather than 2011 due to data
accessibility. Birmingham airport radar data covered the full year in 2011.
5.26 It was not deemed necessary to include all regional airports in the
study due to relatively high levels of current CCO performance at many
of these airports and therefore low expected benefits. The airports
included in this study represent 56 per cent of all UK aircraft movements
and 66 per cent of all UK commercial aircraft movement for 2011. Annex
C includes information on 2011 aircraft movements for the airports
included in this study.
5.27 The data in this study is based on a baseline CCO performance level at
each of the airports, ranging from a high of 90 per cent at Birmingham
and Manchester airports to a low of 4 per cent at London City. This
means that whilst 90 per cent of flights in the sample period received
a CCO up to at least 18,000ft out of Birmingham and Manchester,
only 4 per cent of flights out of London City received a CCO up to at
least 18,000ft11. Annex D provides the full distributions of baseline
CCO performance across the sample periods at Heathrow, Gatwick,
Stansted, Manchester and Birmingham in 2011.
5.28 In the development of the methodology and scope for this study the
issue of what baseline should be used for measuring current CCO
performance was questioned and particularly the use of baseline
data from 2011 where traffic levels were not as high as those seen
previously in UK airspace. The level of expected benefits is directly
correlated with and highly sensitive to baseline CCO performance levels;
higher air traffic levels could be associated with a lower base CCO
performance level and therefore the expected benefits from moving to
fully systemised CCOs could be greater than those estimated here. A
fully systemised CCO environment designed to cope with traffic growth
should remove or minimise the risk of not achieving the 100 per cent
achievement levels included in this report.
5.29 Distributions of CCO performance over the same period in 2008, 2009,
2010 and 2011 at London Heathrow were examined and showed that
baseline CCO performance was indeed lower in 2008 at 33 per cent
(compared to 40 per cent in 2009, 2010, and 2011) with the higher
11 Baseline performance data is based on 2011 data except for London City airport which is based on
a sample from 2006. It is possible that part of the low performance for London City airport is due to
the fact that the sample was taken from a year with higher traffic levels; however London City SIDs
are constrained by arrivals into and out of London Heathrow and therefore it is not unreasonable to
assume that this level of performance is a regular occurrence.
July 2013 Page 26CAP 1062 Section 5: CCO Assumptions
traffic levels. However, CCO performance has been stable over the last
three years and UK traffic levels are predicted to recover slowly from
the recent economic downturn, therefore 2011 has been deemed an
appropriate year for baseline CCO performance in this study.
5.30 It should be noted that there was no objection to the use of 2011 for
baseline CCO performance in the interim report; however it is still
recognised that if CCO baseline performance levels were to decrease
from the 2011 levels the benefits of implementing CCOs in the UK
would be greater than those included in this report.
5.31 Major airspace change programmes, such as LAMP or NTCA, will
cover multiple airports including those within and outside of this
study. Therefore the costs of the major airspace change programmes
are spread across a wider set of stakeholders than those generating
the expected benefits included in this report. The full cost of these
programmes has been included as it is not possible to ascertain the
specific cost of these programmes to each of the airport locations
included in this study.
5.32 Additionally, stakeholders transiting through a designated PBN airspace
volume may also require PBN capability. This extends the number of
airspace users required to equip with the necessary PBN capability in
order to achieve the expected benefits at the airports included in this
study. The costs in this study attempt capture these users as best as
possible based on current information in section 8.
5.33 Therefore the coverage of benefits and costs across stakeholders is not
perfectly aligned with the expected benefits capturing a smaller subset
of stakeholders compared to the expected costs. However, it was
deemed more important to capture the costs imposed on other airspace
users even if the benefits they would achieve were too small or not
able to be measured in a comparable way to the airports included in this
study.
Transition Altitude (TA)
5.34 In order to achieve the aims of both the LAMP and NTCA programmes
a change to the TA level across the UK is needed. TA is the altitude at or
below which the vertical position of an aircraft is normally controlled by
reference to altitude. The TA at most major airports in the UK is 6,000
ft and in the Manchester Terminal Manoeuvring Area (TMA) area it is
5,000ft. At most minor aerodromes and for most uncontrolled airspace
the TA is 3,000 ft. In Ireland the TA for major airports is 5,000 ft. The
July 2013 Page 27CAP 1062 Section 5: CCO Assumptions
current situation is therefore confusing and has the potential to result in
altimeter setting errors. For those aircraft that climb quickly the problem
is exacerbated by creating a high workload for a relatively low TA and
has the potential for continuing safety implications if not resolved.
5.35 The CAA published a consultation document in January 2012 related
to the policy to raise and harmonise the TA both inside and outside
controlled airspace (CAS) in the London and Scottish Flight Information
Regions (FIRs) at 18,000 ft. With due regard to feedback from the first
consultation and further discussions and work on the issues around the
TA, a second CAA consultation will likely be conducted in Spring 2014 at
the earliest.
LAMP
5.36 The LAMP programme considers a fundamental redesign of the
terminal airspace at a network level, above circa 4,000 ft and will
improve the route network and remove stack holding in normal
operations freeing up valuable airspace capacity. More precise,
systemised, departure and arrival procedures will be implemented to
capitalise on the available airspace thereby enabling the systemised
CCOs required to realise the expected benefits in this study.
5.37 The LAMP programme includes Heathrow, Gatwick, Stansted, Luton,
London City and Birmingham airports.
NTCA
5.38 In the NTCA environment traffic levels are lower and there is more
spare capacity, which enables a higher tactical CCO performance level
currently. Nevertheless the redesign of NTCA route network presents
similar opportunities to systemise CCOs and achieve the expected
benefits estimated as part of this study. A NTCA redesign would include
Manchester and Liverpool airports.
Other airspace redesign costs
5.39 Airspace redesigns at Edinburgh, Glasgow, Bristol and Newcastle
airports would not be included in the LAMP or NTCA redesign
programmes, and therefore this study assumes that the necessary
airspace changes would be implemented at these airports to facilitate
fully systemised CCOs.
July 2013 Page 28CAP 1062 Section 5: CCO Assumptions
Aircraft categories
5.40 Given the variation in fuel consumption between types of aircraft,
the analysis was broken down into aircraft categories. The benefits
assessment included in this final report is based on the following aircraft
categories:
Regional jet (CRJ900)
Single aisle (A319, A320, A321, B72212, B738, B752, MD83)
Twin aisle 2-engine (A333, B762, B763, B772, B773, DC10)
Twin aisle 4-engine (A343, A346, A380, B744)
5.41 It is accepted that significant advances have been made recently in
aircraft fuel and emission performance and therefore future fuel and
emission savings may be lower than those calculated in this report;
however, there is also a counter effect from increased fuel burn and
emission associated with up scaling fleets to larger planes.13
5.42 Overall DfT forecasts indicate that there is likely to be an increase
in fuel burn and CO2 emissions even with the changes to fleet mix
and efficiency improvements. However, given the complexity of the
interaction of these two factors and uncertainty in the trends for both
replacement and up scaling of aircraft fleets at each of the individual
airports, is has been decided that the mix of aircraft has been assumed
to remain constant for the purpose of this report.
5.43 Sensitivity analysis has not been conducted on the impact of changes
in aircraft fleet mix due to the complexity in forecasting which aircraft
types will increase and decrease and by how much.
12 A comment was received following the interim report on the use of the B722 as an aircraft
category in the modelling due to its scarcity in UK aircraft fleet. The modelling reflects the number
of the different aircraft types in operation and therefore only a very small level of benefit are
associated with this aircraft in this study, but it was included to represent this type of aircraft for
completeness.
13 Sustainable Aviation have produced a discussion paper which includes the role of aircraft
design in reducing environmental impact from aviation and the interaction between designs
for fuel efficiency and other environment factors. Sustainable Aviation (September 2010)
Interdependencies between emission of CO2,NOX & Noise; Policy Discussion Paper http://www.
sustainableaviation.co.uk/wp-content/uploads/sa-inter-dependencies-sep-2010.pdf
July 2013 Page 29CAP 1062 Section 5: CCO Assumptions
Calculating flight efficiency and CO2 savings
5.44 The primary quantifiable benefits from CCOs have been identified as
flight efficiency benefits (fuel and time savings) and the associated
environmental benefits from more efficient flight plans (CO2and noise).
5.45 The calculation of the difference in fuel burn was evaluated based on
ICAO guidance on ensuring a common measurement point14. Fuel burn
comparisons can only be evaluated once the aircraft on a stepped climb
and the aircraft on a continuous climb have reached a common point,
and beyond that everything else is the same. After departure the first
common point (in terms of speed, height and distance) is an adjusted
top of climb, which ICAO refer to as ‘Point X’ and is depicted in figure 2
below.
Figure 2 – ICAO recommended adjusted top of climb (Point X) comparison
measurement15
14 ICAO (2008) ICAO Circular 317: Effects of PAN-OPS Noise Abatement Departure Procedures on
Nose and Gaseous Emissions.
15 ICAO (2008) ICAO Circular 317: Effects of PAN-OPS Noise Abatement Departure Procedures on
Nose and Gaseous Emissions; Figure 4.1.
July 2013 Page 30CAP 1062 Section 5: CCO Assumptions
5.46 The fuel, CO2 and time savings benefits were then calculated by the
CAA’s ERCD from baseline radar data using the BADA 3.9 model16.
BADA 3.9 is a theoretical model to estimate fuel burn and therefore may
not be as accurate as the manufacturers’ models, but it was chosen for
this study as the most consistent method for estimating the benefits
across the many different types of aircraft operating at UK airports.
5.47 The benefits from CCOs have been calculated for each aircraft type
by taking the difference in flight efficiency between the baseline
performance level and that which has been estimated using the BADA
3.9 model under a fully systemised CCO for each aircraft type. This
saving has then been extrapolated across the increase in the number
of CCOs that would be expected again for each aircraft type based on
the existing aircraft fleet mix. The fuel, time and CO2 savings for each
aircraft type have then been aggregated according to the total number
of departures to generate a 2011 baseline saving. This saving is the
extrapolated into future years using the assumptions detailed in the rest
of this section. Annex F includes a breakdown of these calculations for
Heathrow to illustrate how the expected benefits have been derived.
5.48 It is important to note that the fuel savings calculations do not include
additional fuel efficiency savings that aircraft operators would make
from uploading less fuel than they would have previously. Aircraft
operators are required to carry fuel to cover the entire flight plan, plus
contingency, and if they are able to plan for systemised CCOs they
may be able to lower the amount of fuel they uplift to the aircraft. This
reduces the weight of the aircraft, which in turn reduces fuel burn.
5.49 Data from industry workshops held in May 2012 was used to compare
industry estimates to the modelling used in this study. Any differences
were generally found to be down to differences in the approach taken
to calculate the benefit or due to data being estimated directly from the
manufacturer’s modelling rather than the theoretical model used in this
report. It was found that the manufacturer’s models tended to produce
higher expected benefits than those estimated using the BADA 3.9
model in this study and therefore this study potentially reflects a more
conservative picture of potential fuel burn and time savings.
16 http://www.eurocontrol.int/eec/public/standard_page/proj_BADA_documents_39.html (last
accessed 29 August 2012)
July 2013 Page 31CAP 1062 Section 5: CCO Assumptions
Air Traffic Demand
5.50 The expected benefits are based on 2011 traffic levels with assumptions
made about growth in air traffic demand. The demand predictions are
based on the central forecast from the Department for Transport ‘s
(DfT) UK Aviation Forecasts 201117 and include the predictions in table
2 relevant to the period and airports under examination in this report.
Sensitivity of traffic levels has been undertaken and the results are
included in Annex H.
5.51 Since the work was undertaken to calculate the benefits in this study,
the DfT has published an update to its UK Aviation Forecasts18 in
January 2013. The central forecasts of passenger numbers in the 2013
report have been reduced by around seven percent from the levels
assumed in this report, which were forecast by the DfT in 2011. The
major South East airports are still forecast to be fully by 2030 (could be
as early as 2025 or as late as 2040) and Heathrow airport in particular
is forecast to remain full across all the demand cases as in the 2011
forecasts.
5.52 The expected benefits in this report have not been updated to reflect
the 2013 forecasts. This is due to the fact that sensitivity analysis
based on 2011 forecasts indicated the expected benefits were not very
sensitive to changes in traffic forecasts; however it is recognised that
where 2013 forecasts are lower at airports included in this study, there
could be a small overestimation in the expected benefits included in this
report.
17 Department for Transport (August 2011) UK Aviation Forecasts 2011; http://assets.dft.gov.uk/
publications/uk-aviation-forecasts-2011/uk-aviation-forecasts.pdf (last accessed 20 August 2012)
18 Department for Transport (January 2013) UK Aviation Forecasts 2013; https://www.gov.uk/
government/uploads/system/uploads/attachment_data/file/183931/aviation-forecasts.pdf (last
accessed 11 April 2013)
July 2013 Page 32CAP 1062 Section 5: CCO Assumptions
Table 2 –DfT ATM Forecasts (000s) at UK airports (central forecast) 19
Airport 2010 2030 Average annual growth
2011-2020
Heathrow 450 480 0.3%
Gatwick 230 260 0.7%
Manchester 150 280 4.3%
Stansted 140 260 4.3%
Birmingham 85 210 7.4%
Glasgow 70 75 0.4%
Luton 75 130 3.7%
Edinburgh 100 190 4.5%
Newcastle 50 55 0.5%
Liverpool John 45 55 1.1%
Lennon
London City 65 120 4.2%
Bristol 55 85 2.7%
Airport Capacity
5.53 This study assumes that no new runway capacity is available in the UK
in the period covered to 2030, but that airports continue to develop
to maximum use of their current potential runway capacities. This
is consistent with the modelling assumptions used by the DfT in
developing their UK Aviation Forecasts described above.
5.54 The complexity of UK airspace, particularly in the South East of England,
means that changes to airport capacity or throughput may have an
impact on the ability to offer CCOs in some parts of the airspace.
Therefore, if there were to be significant change in airport capacity in
the South East of England, the benefits included in this report may need
to be reassessed.
19 Department for Transport (August 2011) UK Aviation Forecasts 2011; table H.3, page 160, central
forecast.
July 2013 Page 33CAP 1062 Section 5: CCO Assumptions
Fuel prices
5.55 Fuel prices have been based on the 2011 average jet fuel prices
handled by IATA €710 per tonne or £618 per tonne as recommended by
Eurocontrol20. Fuel price inflation is covered in section 5.13.
Passenger time
5.56 As described by Eurocontrol the passenger value of time is an
opportunity cost, which corresponds to the monetary value associated
with a traveller (passenger) during a journey. It is essentially, how much
a traveller would be willing to pay in order to save time during a journey
(e.g. by travelling on a quicker service or a faster mode), or how much
‘compensation’ they would accept, directly or indirectly, for ‘lost time’.
5.57 The value of passenger time savings from fully systemised CCOs
has been estimated using the Eurocontrol recommended value for
passenger opportunity cost of €43.8 per minute or £38.01 per minute21.
5.58 It is recognised that there has been significant discussion about the use
of passenger time savings for small increments of time, and whether
or not they should be valued at lower rates than larger increments. It is
argued that there is greater difficulty in making effective use of smaller
increments of time savings, particularly when unanticipated. However,
as supported by the FAA the theoretical and empirical knowledge does
not appear to support valuing small increments of time less than larger
ones. Therefore, even though the average times savings per flight from
fully systemised CCOs are smaller increments it is felt to be appropriate
to capture this value to passengers.
Delay cost savings
5.59 The value of time to aircraft operators resulting from fully systemised
CCOs has been estimated based on the Eurocontrol recommended
value for delay costs22. The savings has been approximated based on
20 EUROCONTROL (Feb 2012) Standard Inputs for EUROCONTROL Cost Benefit Analyses.
21 EUROCONTROL (Feb 2012) Standard Inputs for EUROCONTROL Cost Benefit Analyses. http://
www.eurocontrol.int/documents/standard-inputs-eurocontrol-cost-benefit-analyses
Based on base scenario value for passenger opportunity cost of €43.8 per minute and converted to
£ based on EUROCONTROL exchange rate conversion for 2011 of £1.152475.
22 EUROCONTROL (Feb 2012) Standard Inputs for EUROCONTROL Cost Benefit Analyses. http://
www.eurocontrol.int/documents/standard-inputs-eurocontrol-cost-benefit-analyses
July 2013 Page 34CAP 1062 Section 5: CCO Assumptions
the strategic delay figure for the airborne stage of flight figure minus
the fuel costs estimate savings as this has been calculated separately.
Although the airborne delay cost is technically considered to exclude the
climb phase the values have been considered as an appropriate proxy
for the savings.
5.60 The figure used for 2011 was €31.1 per minute or £26.99 per minute23.
Carbon prices
5.61 Carbon prices has been estimated based on the Department for
Environment and Climate Change (DECC)’s central carbon value for the
traded sector24.
5.62 DECC has updated the carbon prices for traded sectors following the
modelling undertaken to calculate the estimated benefits included in
this report, which has reduced the value of the short term traded carbon
prices most significantly in the early years of this study with the values
in the later years returning to the level of the estimates included in this
study.
5.63 It is acknowledged that this results in an overestimation of the benefits
from carbon savings in this study; however as carbon savings make up
approximately two per cent of the total estimated benefits it was not
deemed necessary to update the figures included in this report at this
time.
Price levels
5.64 The figures in the final report are based on constant 2011 prices,
and therefore no assumptions have been made about general price
increases in the future.
5.65 However, fuel prices have been relatively volatile in recent years and
jet fuel prices are forecast to increase on average by a real 2.4 per cent
per year from 2010 to 2035 according to the Annual Energy Outlook
23 Based on the EUROCONTROL recommend value for delay costs for the Base Scenario for a
Strategic Airborne delay, minus the fuel costs, of €31.1 per minute and converted to £ based on
EUROCONTROL exchange rate conversion for 2011 of £1.152475 (£26.99).
24 Based on £13 for central carbon value for traded sector for 2011 in 2011 prices. DECC (October
2011) A brief guide to the carbon valuation methodology for UK policy appraisal. http://www.decc.
gov.uk/en/content/cms/emissions/valuation/valuation.aspx#
July 2013 Page 35CAP 1062 Section 5: CCO Assumptions
2012 published by the U.S Energy Information Administration25. Real
fuel prices increases of 2.4 per cent per year have been included in this
study.
5.66 Sensitivity analysis for real fuel price inflation has been undertaken in
Annex H.
Discount rate
5.67 The annual rate used to discount the stream of future costs and benefits
in this study was four per cent as recommended by Eurocontrol for
ATM investments26. This discount rate includes adjustments for a basic
risk free time value of money and a risk premium, and is inflation free.
This is also the rate recommended by the European Commission in
its impact assessment guidance and is used by the European Aviation
Safety Agency (EASA) for impact assessments.
5.68 The UK Green Book guidance for appraisal and evaluation in Central
Government recommends using the Social Time Preference Rate
(STPR) of 3.5 per cent as the standard real discount rate27. The STPR is
defined as the value society attaches to present, as opposed to future,
consumption. Sensitivity analysis on the use of the UK recommended
rate of 3.5 percent compared to the Eurocontrol recommended rate of 4
per cent has been conducted and is included in Annex H.
5.69 The benefits in this report are calculated out to 2030, which aligns to
the period of the FAS. It is recognised that this broadly in line with the
expected lifecycles of the major investments required to enable CCOs in
the wider context of a desire to move to user defined trajectory based
flight operations in the future.
25 U.S Energy Information Administration (June 2012) Annual Energy Outlook 2012 http://
www.eia.gov/oiaf/aeo/tablebrowser/#release=AEO2012&subject=3-AEO2012&table=12-
AEO2012®ion=0-0&cases=ref2012-d020112c (last accessed 17 August 2012)
26 EUROCONTROL (Feb 2012) Standard Inputs for EUROCONTROL Cost Benefit Analyses.
27 HM Treasury (2003) The Green Book: Appraisal and Evaluation in Central Government
July 2013 Page 36You can also read