Fusión de imágenes satelitales usando la transformada de Brovey y enriquecimiento espectral sobre computación heterogénea CPU/GPU
←
→
Page content transcription
If your browser does not render page correctly, please read the page content below

Fusión de imágenes satelitales usando la transformada
                                              de Brovey y enriquecimiento espectral sobre
                                                  computación heterogénea CPU/GPU
                                               Satellite-image fusion using Brovey transform
                                             and spectral richness calibration on heterogeneous
                                                            computing CPU/GPUs

                                                  Andrés Ovidio Restrepo Rodríguez               Nelson Enrique Vera Parra

                                                                       Rubén Javier Medina Daza

                                                                 Universidad Distrital Francisco José de caldas

                                       Resumen

                                       Objetivo: Acelerar el proceso de fusión de imágenes satelitales mediante un modelo de procesamiento
                                       paralelo masivo basado en computación heterogénea (CPU/GPU). Metodología: Para cumplir este
                                       propósito, se realizó una implementación paralela-heterogénea de la transformada de Brovey.
                                       La implementación se evaluó con un conjunto de imágenes de 4 tamaños diferentes y se comparó
                                       frente a una implementación secuencial en CPU. Resultados: Se evidenció un Speed-up de hasta
                                       532X en el proceso de fusión de una imagen de 8192 píxeles. En cuanto a calidad de la imagen
Recibido: 15/02/2021
                                       obtenida, al obtener el coeficiente de correlación entre la imagen fusionada y la pancromática,
Aceptado: 18/05/2021
                                       se obtuvo un promedio de detalle espacial por banda del 0.9714 en un espacio de color (R,G,B). La
Publicado: 01/07/2021
                                       implementación se encuentra disponible en https://github.com/Parall-UD/ParallelBrovey-Transform.
                                       Conclusiones: Se demostró que la programación paralela masiva en plataformas heterogéneas
                                       CPU/GPU representa una solución efectiva a la alta exigencia computacional del proceso de fusión
                                       de imágenes satelitales sin afectar la calidad de la imagen obtenida, comparada con soluciones
                                       secuenciales.

Correspondencia de autores:
                                       Palabras clave: Imágenes satelitales, Fusión, Transformada Brovey, procesamiento en paralelo,
aorestrepor@correo.udistrital.edu.co
                                       Matemáticas-Estadísticas; Imagen Multispectral, Imagen Pancromática.

                                       Abstract

                                       Objective: Accelerate the process of merging satellite images using a massive parallel processing
                                       model based on heterogeneous computing (CPU / GPU). Methodology: To fulfill this purpose, a
                                       parallel-heterogeneous implementation of the Brovey transform was performed. The implementation
                                       was evaluated with a set of images of 4 different sizes and compared against a sequential CPU
                                       implementation. Results: A Speed-up of up to 532X was evidenced in the fusion process of an
                                       8192-pixel image. Regarding the quality of the image obtained, when obtaining the correlation
                                       coefficient between the merged image and the panchromatic image, an average spatial detail per band
                                       of 0.9714 was obtained in a color space (R, G, B). The implementation is available at https://github.
                                       com/Parall-UD/ParallelBrovey-Transform. Conclusions: This project demonstrated that massive
                                       parallel programming on heterogeneous CPU / GPU platforms represents an effective solution to the
Copyrith 2020                          high computational demand of the satellite image fusion process without affecting the image quality
by Investigación e                     obtained, compared to sequential solutions.
Innovación en Ingenierías
                                       Keywords: Satellite-image fusion, Brovey transform, parallel processing, Mathematical-statistics;
                                       Multispectral image, Panchromatic image.

Como citar (IEEE): A. Restrepo-Rodríguez., N. Vera-Parra y R. Medina-Daza “Fusión de imágenes satelitales usando la trasformada
de Brovey y enriquecimiento espectral sobre computación heterogénea CPU/GPU”, Investigación e Innovación en Ingenierías, vol. 9,
n°2, 7-25, 2021. DOI: https://doi.org/10.17081/invinno.9.2.3961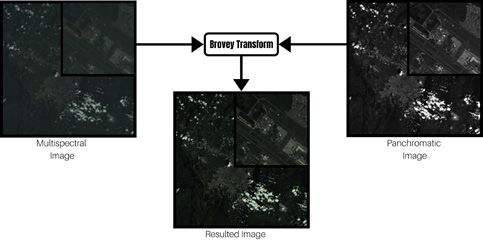
8   Andrés Ovidio Restrepo Rodríguez, Nelson Enrique Vera Parra, Rubén Javier Medina Daza

    Introducción

    Image processing is aimed at improving image quality so that relevant information can be detected,
    boosting pattern and feature recognition [1]. When taking an image as the starting point for data processing,
    it is possible to improve image quality by applying several processes, e.g. pixel-by-pixel operations,
    segmentation, brightness adjustments, contrast calibration, equalization, filtering, and image fusion. In
    [2], a literature survey gathered a set of techniques addressing image processing at a pixel level for tele-
    detection. These techniques were based on Principal Component Analysis (PCA), Intensity-Hue-Saturation
    (IHS), the Brovey transform, and the Wavelet transform among others. The studies conclude that image
    processing methods have a significant impact on the quality of the resulting (processed) images.

    Image fusion combines relevant information from a given set of images to produce a single image that
    exhibits higher quality when compared to any of the original images. For satellite image fusion it is necessary
    to provide a Panchromatic image, which has high spatial resolution, and a Multispectral image, which is
    has considerable spectral information [3]. In [4], a study was conducted employing seven image-fusion
    techniques. The effectiveness of the techniques was assessed using both quantitative and qualitative
    metrics. Based on a series of statistical metrics, the Wavelet transformed was found to be the most effective
    technique, followed by the Brovey transform. Moreover, in [5], the Fast Haar Wavelet Transform (FHWT) was
    identified as an excellent technique for satellite image fusion, achieving the best performance in several
    metrics such as the correlation coefficient, the Relative average spectral error, the ERGAS metric, and the
    Universal Quality index Qu.

    The capacity of parallel computing using Graphic Processing Units (GPUs) has raised an increasing interest
    among researchers and engineers studying high-performance computing [6]. For example, in [7], a search
    for electromagnetic emission sources was proposed based on interferometric data obtained from spectral-
    line radio-astronomy using parallel programing techniques; a 3.2 times faster processing was achieved
    when compared to the CPU process alone. Other studies [8] proposed an image-fusion algorithm employing
    convolution-based neural networks by means of a parallel processing architecture; results were compared
    to those obtained with traditional methods, showing an improvement in the network’s training time and
    satisfactory quality of the fusion process. When conducting satellite image fusion, the goal is to cover
    large areas of land. To this end, large-scale images are used, which significantly increases the processing
    time when employing a serial architecture. For example, in [9], assumptions are made about accelerating
    processing techniques, such as super-resolution (SR), by using GPU parallel processing.

    This paper presents preliminary results on satellite image fusion employing the Brovey transform along
    with spectral richness calibration using a CPU/GPU heterogeneous computing architecture. To guarantee
    correlation and quality, both spectral and spatial, several statistical metrics are assessed, such as the
    correlation coefficient, the Universal Image Q index, as well as the ERGAS and Bias tests [10]. The purpose of
    employing this method using a parallel processing architecture is to reduce the time necessary to complete
    the satellite image fusion stage together with the calibration of spectral richness. The type of image
    processing introduced herein is conducted using Python over the CUDA parallel processing architecture.

    This paper is organized as follows. Section 2 presents some background and related work. Section 3
    introduces the proposed methodology by parts; namely the general approach, the method, and the
    assessment procedure. Moreover, results are analyzed with regard to running times, visual comparison,
    and statistical metrics. Finally, conclusions and future works are presented.

      Revista Investigación e Innovación en Ingenierías, vol. 9, 2°. 1, pp. 7-25, Enero-julio 2021. DOI: https://doi.org/10.17081/invinno.9.2.3961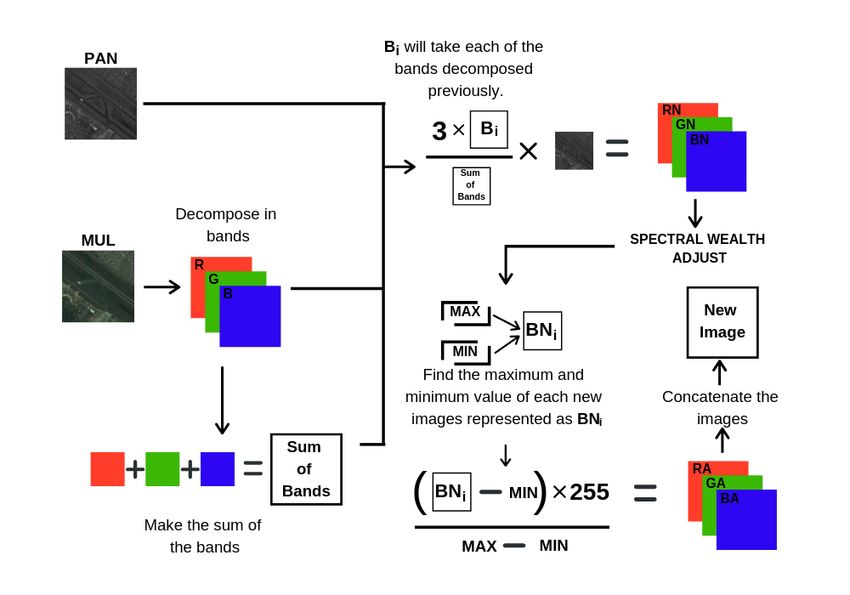
Fusión de imágenes satelitales usando la trasformada de Brovey y enriquecimiento espectral sobre                                                 9
computación heterogénea CPU/GPU

Materials and methods

Image processing refers to a variety of techniques that maximize the usefulness of the information
contained in an image for a particular target context [11]. In [12], image processing techniques were applied
to assess the performance of a convolution-based neural network when classifying images in the context
of augmented reality applications. The results were significant in terms of feature extraction and pattern
recognition improvements, namely the image processing techniques increased classification accuracy by
17%, which shows the importance of applying image processing techniques.

Image fusion is commonly defined as the process of combining information, extracted from two or more
images of the same scene, to consolidate a single compound image of higher quality, which provides
improved visual experience and better informatic processing [13]. This improvement occurs at different
levels, namely a pixel level, a functional level and a strategic level. Satellite image fusion is commonly
performed between a panchromatic image (PAN) and a multispectral image (MUL), which can be seen as
a structural, functional system. The structural content is provided by the PAN, since it brings high spatial
resolution, whereas the functional content is determined by the MUL due to its spectral richness, which
resides in the bands [14]. As a result, when conducting satellite image fusion, spatial information is properly
added to the multispectral image, increasing the spatial resolution while maintaining spectral richness.
To conduct image fusion, some methods are available, such as the HIS transform, the main component
transform, the Wavelet transform, and the Brovey transform, among others.

For this study, image fusion based on the Brovey transform is employed; this method decomposes the
pixel space of the multispectral image into color and luminance components. Then the method computes a
mathematical synthesis to obtain colored images and high-resolution images. Each band of colored images
is multiplied by the color-band integrated proportion of the color field of the data in high resolution,
resulting in an automatic re-sampling process that restores each band to a high-resolution size [15], as
shown in (1).

                                                                                                               (1)

where R, G, B correspond to the bands of the multispectral image, namely, red, green and blue, and PAN
represents the data from the panchromatic image; Bandi is every newly generated band.

When conducting image fusion, typically, it is necessary to compare the original image with the processed
image so that the intended goal can be tested. In order to evaluate the usefulness of fused images,
compared to the original multispectral images, quantitative tests exist, such as correlation, entropy, bias
and the universal image Q index test [10].

Another subject of study in the present paper is heterogeneous computation. At present, the development
of processing systems has focused on producing devices with simultaneous running capabilities using
two approaches. The first approach corresponds to the design of multi-core CPUs; the second approach
focuses on many-thread processing systems such as GPUs (Graphic Processing Units), which optimize the
performance by running parallelizable processes [16]. Heterogeneous computation refers to systems that
use a variety of computation units such as CPUs, GPUs, DSPs, FPGAs [8]. For the present study, a CPU/GPU
architecture is defined as the heterogeneous processing system.

Parallel computing resources include a multi-core CPU as well as a multi-core GPU. In general, the CPU
prepares and transfers the data, whereas the GPU is in charge of the arithmetic operations [17]. In [18], a
framework for cooperative heterogeneous computation was proposed to allow an efficient use of the cores

  Revista Investigación e Innovación en Ingenierías, vol. 9, n°. 2, pp. 7-25, Enero-julio 2021. DOI: https://doi.org/10.17081/invinno.9.2.3961
10   Andrés Ovidio Restrepo Rodríguez, Nelson Enrique Vera Parra, Rubén Javier Medina Daza

     of a host CPU as well as the CUDA cores intended for the GPU. As a result, the proposed framework attained
     the goals of parallel running.

     Based on the previous description, two main topics are identified for the present study; namely image
     processing using satellite image fusion techniques based on the Brovey transform, and heterogeneous
     processing using a CPU/GPU architecture. By combing these two topics in [19], a method for satellite image
     fusion was proposed based on a deep multichannel model. The experimental stage of this model involved
     a CPU/GPU architecture. The proposed model significantly improved the quality of the fusion process when
     compared to other methods in the literature. In [20], real-time parallel algorithms were proposed based on
     multi-GPUs intended for the processing of medical images. One of the proposed algorithms resulted in image
     processing 265 times faster than its serial CPU counterpart; another algorithm showed an improvement of
     667 times faster processing compared to the host CPU implementation.

     In this context, the present study is aimed at implementing the Brovey transform as the satellite image fusion
     method along with a spectral calibration stage. This proposal is conducted using a CPU/GPU heterogeneous
     computing architecture so that running times can be compared to their serial processing counterparts. The
     results are also compared in terms of visual evaluation and statistical index assessment.

     This section introduces the stages of this study by presenting a general approach, the implementation of
     the Brovey transform, and the assessment criteria.

     General Approach

     process of satellite image fusion using the Brovey transform with spectral calibration. The implementation
     of such a method for image fusion is conducted using both serial processing (CPU only) and parallel
     processing (CUDA-driven CPU/GPU heterogeneous computing architecture). In order to implement the
     Brovey transform, Python code is used by importing several modules such as numpy for serial processing,
     and pycuda for parallel processing. For the evaluation stage, the following items are defined: serial and
     parallel running times (i.e. execution times), resulting images after applying the Brovey transform, and the
     set of statistical indices such as correlation coefficient, Universal Image Q Index, ERGAS and Bias (Figure 1).

     Figure 1. General Approach

     Source: Own elaboration

       Revista Investigación e Innovación en Ingenierías, vol. 9, 2°. 1, pp. 7-25, Enero-julio 2021. DOI: https://doi.org/10.17081/invinno.9.2.3961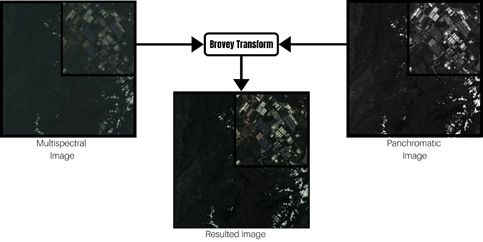
Fusión de imágenes satelitales usando la trasformada de Brovey y enriquecimiento espectral sobre                                                 11
computación heterogénea CPU/GPU

Implementation of the Brovey transform

The proposed method consists in applying the Brovey transform using its typical structure. Figure 2
presents the schematic representation of this method. The method begins with two input images, namely
the multispectral and panchromatic images. The first image is decomposed into its RGB bands, then the sum
of the bands is carried out. Subsequently, the Brovey transform is applied by taking each of the previously
decomposed bands for division into the sum of the bands, then multiplying this result by 3 (scalar) and also
by data from the panchromatic image. This process results in three new bands, namely Rn, Gn and Bn. From
this point onwards, a spectral calibration stage is implemented. To this end, each of the newly generated
bands is processed to find their corresponding maximum (max) and minimum (min) values. The min value
is subtracted from each band and the resulting data is multiplied by 255 for subsequent normalization
(division) by the difference between the max and min values. Once the bands with spectral calibration are
obtained, a process for concatenation of the bands is conducted, which yields the new image that holds
the calibrated spectral richness from the multispectral image together with the spatial resolution from the
panchromatic image.

Figure 2. Method Model

Source: Own elaboration

For the serial implementation of the presented method, a library called skimage was used so as to load
.TIF images of any depth. Additionally, the numpy library is employed to search the maximum and minimum
values, which are necessary for the spectral calibration stage. This implementation is composed mainly of
for cycles, which enclose each of the steps required to complete both the Brovey transform and the spectral
calibration stage.

  Revista Investigación e Innovación en Ingenierías, vol. 9, n°. 2, pp. 7-25, Enero-julio 2021. DOI: https://doi.org/10.17081/invinno.9.2.3961
12   Andrés Ovidio Restrepo Rodríguez, Nelson Enrique Vera Parra, Rubén Javier Medina Daza

     To carry out the implementation of the Brovey transform along with the spectral calibration stage in a
     parallel fashion, the CPU is used as a multi-core device whereas the GPU is used as a many-core device over
     the a CUDA framework. Moreover, the pycuda library is required to apply this framework based on Python
     code. As the algorithm runs, libraries such as gpuarray, skcuda and ElementwiseKernel nget involved to
     allow the computation of the spectral calibration stage. Figure 3 shows the resulting CPU/GPU interaction.

     Figure 3. CPU/CPU Interaction

     Source: Own elaboration

     Assessment

     The proposed implementation was carried out using the following equipment: Intel (R) Xeon (R) CPU
     E-52697 v3 @ 2.60GHZ with NVIDIA Tesla K80 graphics card. Also, the images used for the assessment of the
     proposal were obtained from satellites IKONOS and LANDSAT. Moreover, the assessment criteria to measure
     processing performance correspond to the running time, a visual analysis, and the correlation between the
     original and the processed image. To assess correlation, the following statistical indices were computed;
     correlation coefficient, universal image quality index Q, ERGAS, Bias; also, spatial gain is measured.

     Correlation coefficient

     This index defines the correlation level between fused images and original images. This index is considered,
     as reliable and so has been widely used in the literature. The value of the correlation coefficient is defined
     in the interval [-1,1]; a value of 0 indicates no correlation, whereas a value of 1 indicates that the two images
     are equal. A value of -1 indicates that images are the exact opposite of one another. Equation (2) presents
     the formal description of this index [10].

                                                                                                               (2)

       Revista Investigación e Innovación en Ingenierías, vol. 9, 2°. 1, pp. 7-25, Enero-julio 2021. DOI: https://doi.org/10.17081/invinno.9.2.3961
Fusión de imágenes satelitales usando la trasformada de Brovey y enriquecimiento espectral sobre                                                 13
computación heterogénea CPU/GPU

Universal Image Quality Index Qu

This index describes the quality of processed images. It is considered as a robust index since it is based on
average values and considers the standard deviation of the data. This index is defined in the interval (0,1)
[10]. Equation (3) describes the function to compute this index.

                                                                                                               (3)

BIAS

This index is based on the ratio of average values obtained from the processed image and the original
image. The optimal value for this index is 0, and the positive or negative values closer to zero represent a
strong similarity between the images [10]. Equation (4) describes this index.

                                                                                                              (4)

ERGAS

The Dimensionless Global Relative Error of Synthesis (ERGAS) has an ideal value of 0. The ERGAS index is
expressed as a percentage and its formal function for computation can be seen in equation (5) [10].

                                                                                                              (5)

Results Analysis

Muestra la estructuración de los datos recolectados en función a los objetivos propuestos. Deben ser
presentados de manera clara y precisa acorde al método planteado, incluya en este mismo apartado las
tablas y figuras necesarias para presentar los resultados.

This section shows the results obtained in the present study in terms of three assessment criteria, namely
the serial and parallel running time (execution time), the visual impact of the images obtained after applying
the Brovey transform, and the values of the various statistical indices chosen.

Running time (execution time)

Running times are presented for each type of computational architecture, also considering the size of the
images. Table 1 shows the average running time in milliseconds obtained from five trials per size.

  Revista Investigación e Innovación en Ingenierías, vol. 9, n°. 2, pp. 7-25, Enero-julio 2021. DOI: https://doi.org/10.17081/invinno.9.2.3961
14 Andrés Ovidio Restrepo Rodríguez, Nelson Enrique Vera Parra, Rubén Javier Medina Daza
Table 1. Execution Time CPU and GPU
Size CPU (ms) GPU(ms)
1024 19.85 1.42
2048 76.75 1.49
4096 311.11 1.72
8192 1437.85 2.70
Source: Own elaboration
Figure 4 shows a comparison of the running times obtained with both serial and parallel computing; the
results corresponds to the cases shown in Table 1. This comparison uses polynomial interpolation of degree
3 on the data.
Figure 4. Execution Time CPU vs GPU
Source: Own elaboration
In order to show the graphical behavior obtained from the Brovey transform applied on CPU/GPU
heterogeneous computing, Figure 5 presents a detailed curve of this behavior.
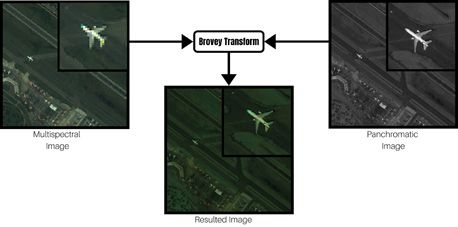
Revista Investigación e Innovación en Ingenierías, vol. 9, 2°. 1, pp. 7-25, Enero-julio 2021. DOI: https://doi.org/10.17081/invinno.9.2.3961Fusión de imágenes satelitales usando la trasformada de Brovey y enriquecimiento espectral sobre 15 computación heterogénea CPU/GPU Figure 5. Execution time GPU close up Source: Own elaboration Resulting images This section presents the images obtained after applying the satellite image fusion process using the Brovey transform method. The method takes the Multispectral and Panchromatic images as input and completes the process by calibrating spectral richness. For every image below, a specific geographic point was selected so that proper zoom-in frames clearly show that the resulting image captures the spectral richness of the multispectral input image as well as the spatial detail of the panchromatic input image. Figure 6 shows the resulting image after applying the Brovey transform over images with 1024 pixels. In this case, a frame containing an aircraft was selected as the specific geographic point so that the spectral richness and the spatial detail of the image can be observed. Figure 6. Brovey Transform with images of 1024 pixels Source: Own elaboration Revista Investigación e Innovación en Ingenierías, vol. 9, n°. 2, pp. 7-25, Enero-julio 2021. DOI: https://doi.org/10.17081/invinno.9.2.3961
16   Andrés Ovidio Restrepo Rodríguez, Nelson Enrique Vera Parra, Rubén Javier Medina Daza

     Figure 7 shows the resulting image after applying the Brovey transform over an image with 2048 pixels. The
     geographic point chosen shows three aircrafts so that spectral richness and spatial detail can be clearly
     appreciated.

     Figure 7. Brovey Transform with images of 2048 pixels

     Source: Own elaboration

     Figure 8 shows the results of applying the Brovey transform on 4096-pixel images. The geographic point
     selected corresponds to El Dorado airport (Bogotá – Colombia). Once again, both spectral richness and
     spatial detail can be clearly observed.

     Figure 8. Brovey Transform with images of 4096 pixels

     Source: Own elaboration

     Figure 9 shows the resulting image after applying the Brovey transform on a 8192-pixel image. The geographic
     point displays an industrial site located on the outskirts of Bogota. Here also, spectral richness and spatial
     detail can be observed.

       Revista Investigación e Innovación en Ingenierías, vol. 9, 2°. 1, pp. 7-25, Enero-julio 2021. DOI: https://doi.org/10.17081/invinno.9.2.3961
Fusión de imágenes satelitales usando la trasformada de Brovey y enriquecimiento espectral sobre 17
computación heterogénea CPU/GPU
Figure 9. Brovey Transform with images of 8192 pixels
Source: Own elaboration
Statistical indices
Table 2 shows the values obtained after computing the correlation coefficient, the Universal Image Q Index
as well as the ERGAS and Bias indices. These indices correspond to the processed imaged when compared to
the multispectral input image; therefore, this set of results are concerned with spectral richness. The same
assessment process was applied to all the image sizes used in the study.
Table 2. Spectral Mathematical-statistical Indices
CC band to band
Size Q ERGAS BIAS
R G B
1024 0.8698 0.8540 0.8578 0.54 11.81% 0.3753
2048 0.8591 0.8376 0.8270 0.43 13% 0.4316
4096 0.8984 0.8773 0.8681 0.52 23.14% 0.2582
8192 0.8542 0.8625 0.8358 0.48 25.83% 0.3248
Source: Own elaboration
Table 3, shows the values obtained after computing the correlation coefficient, the Universal Image Q Index,
the ERGAS index and the Bias index to compare the processed image with the panchromatic input image.
Thus, these results focus on assessing the spatial detail. As in the previous case, indices were computed for
all image sizes in the study.
Revista Investigación e Innovación en Ingenierías, vol. 9, n°. 2, pp. 7-25, Enero-julio 2021. DOI: https://doi.org/10.17081/invinno.9.2.396118 Andrés Ovidio Restrepo Rodríguez, Nelson Enrique Vera Parra, Rubén Javier Medina Daza
Table 3. Spatial Mathematical-statistical Indices
CC band to panchomatic
Size Q ERGAS BIAS
R G B
1024 0.9233 0.9955 0.9913 0.7611 10.12% 0.3800
2048 0.9213 0.9458 0.9878 0.7095 11.19% 0.4231
4096 0.9987 0.9996 0.9991 0.7360 16.64% 0.2423
8192 0.9584 0.9745 0.9625 0.7232 24.59% 0.3648
Source: Own elaboration
Table 4 shows the correlation coefficients obtained when comparing the multispectral image and the
panchromatic image so that the spatial gain can be computed.
Table 4. Correlation Coefficient Index Multispectral vs Panchromatic
CC band to panchomatic
Size
R G B
1024 0.8346 0.8648 0.8533
2048 0.8152 0.8452 0.8395
4096 0.9097 0.8761 0.8638
8192 0.8249 0.8636 0.8315
Source: Own elaboration
Spatial gain
To compute the spatial gain associated to each of the bands (between the multispectral panchromatic
image and the processed image), the data stored in the CC band-to-panchromatic column of Table 2 is used.
A band-to-band subtraction of the CC band-to-panchromatic values is applied to the original image using
the data summarized in Table 4. Table 5 shows the results.
Table 5. Spatial Gain
Size
Bands CC Image
1024 2048 4096 8192
MUL vs PAN 0.8346 0.8152 0.9097 0.849
R Fused vs PAN 0.9233 0.9213 0.9987 0.9584
Difference 0.0887 0.1061 0.0890 0.1094
MUL vs PAN 0.8648 0.8452 0.8761 0.8636
G Fused vs PAN 0.9955 0.9458 0.9996 0.9745
Difference 0.1307 0.1006 0.1235 0.1109
MUL vs PAN 0.8533 0.8395 0.8638 0.8315
B Fused vs PAN 0.9913 0.9878 0.9991 0.9625
Difference 0.1380 0.1483 0.1353 0.1310
Source: Own elaboration
Revista Investigación e Innovación en Ingenierías, vol. 9, 2°. 1, pp. 7-25, Enero-julio 2021. DOI: https://doi.org/10.17081/invinno.9.2.3961Fusión de imágenes satelitales usando la trasformada de Brovey y enriquecimiento espectral sobre 19
computación heterogénea CPU/GPU
Results analysis
Using the results presented above, the following analysis is threefold. First, the analysis focuses on running-
time performance, namely serial and parallel processing performance. Second, a visual comparison of
results is provided. Finally, the analysis focuses on the data gathered from the set of statistical metrics.
Regarding the running-time analysis, Table 1 and Figure 4 indicate that both serial processing and parallel
processing exhibit similar functions, namely increasing functions of the size of images. However, significant
differences in time can be observed when comparing the performance of the two types of computing
architecture. A detailed look at Figure 5 (the function close-up for parallel processing) confirms the
increasing function of image size. However, such a function is only polynomial increasing with small factors,
which indicates that significantly lower running times can be achieved with parallel computing compared
to the serial computing of the processing algorithms. Table 6 shows how many times faster the parallel
algorithm is compared to its serial counterpart.
Table 6. Speedup CPU/GPU
Size Speedup
1024 13.97x
2048 51.51x
4096 180.87x
8192 532.53x
Source: Own elaboration
Based on the results in Table 6, there is a clear picture of the performance improvement obtained from
implementation of the proposed method; a satellite image fusion method running over a CPU/GPU parallel
computing architecture. The method allows processing 8192-pixel images 532.53 times faster than in the
case of serial image processing. Moreover, it is important to highlight that, despite obtaining an increasing
time function of image size for parallel computing, the time-growing factors of the function do not rise
significantly with the size of images.
Regarding the analysis focused on visual comparison, especial attention is devoted to the previously
introduced geographical points. Fig.10 shows a visual comparison for the 1024-pixel image. Figure 10C shows
how the fused image exhibits high spatial detail together with spectral richness. In this resulting image, the
object can be easily recognized (the aircraft). Such an easily recognizable object appears a lot blurrier in
the first image. Figure 10A corresponds to the original multispectral image, whereas Figure10B corresponds
to the original panchromatic image.
Revista Investigación e Innovación en Ingenierías, vol. 9, n°. 2, pp. 7-25, Enero-julio 2021. DOI: https://doi.org/10.17081/invinno.9.2.396120 Andrés Ovidio Restrepo Rodríguez, Nelson Enrique Vera Parra, Rubén Javier Medina Daza
Figure 10. Specified geographical point 1024-pixel image
Source: Own elaboration
The visual comparison for the 2048-pixel image is shown in Figure 11. The resulting image of Fig.11C is
obtained after applying image fusion. In this image, objects can be easily identified since they are well
defined in shape and also exhibit well defined colors. Figure11A corresponds to the original multispectral
image while Fig.11B is the original panchromatic image.
Figure 11. Specified geographical point 2048-pixel image
Source: Own elaboration
Figure 12 offers a visual comparison of the results obtained with 4096-pixel images. The geographical area
chosen in this case corresponds to El Dorado airport (Bogota – Colombia). This set of images shows how the
Brovey transform, along with spectral calibration (Figure 12C), allow the visualization of particular spatial
details that are not distinguishable in Figure 12A, which corresponds to the original multispectral image;
Figure 12B shows the original panchromatic image also for comparison purposes.
Revista Investigación e Innovación en Ingenierías, vol. 9, 2°. 1, pp. 7-25, Enero-julio 2021. DOI: https://doi.org/10.17081/invinno.9.2.3961Fusión de imágenes satelitales usando la trasformada de Brovey y enriquecimiento espectral sobre 21 computación heterogénea CPU/GPU Figure 12. Specified geographical point 4096-pixel image Source: Authors Finally, the visual comparison for the case of 8192-pixel images is shown in Figure 13. The geographic point chosen for this set of images corresponds to the industrial site located in the outskirts of Bogota. Figure 13C exhibits great spatial detail together with color discrimination of objects due to spectral richness. Figure 13A corresponds to the original multispectral image and Figure 13B corresponds to the original panchromatic image Figure 13. Specified geographical point 8192-pixel image Source: Authors This final part of the analysis focuses on the values of the statistical indices presented above. Regarding the spectral assessment, it can be observed that the correlation coefficient between each of the bands of the processed image and the original multispectral image is kept above 0.82 for every image size. This indicates the high level of spatial correlation between the images. Conversely, when analyzing the values of the Universal Image Q Index, the interval [43%, 54%] contains all the quality percentages, indicating a fairly poor performance in this regard. Additionally, the average values of the BIAS index add to 0.3474, a value near zero, which indicates a strong similarity between the images. With regard to the ERGAS coefficient, an average value of 18% was obtained, which corresponds to a high-quality value considering that its ideal value lies near zero. In terms of spatial assessment, measured with statistical indices, it can be observed that the correlation coefficient for each of the bands of the processed image, compared to the panchromatic image, is maintained above 0.92 for every image size. This indicates a high degree of spatial correlation between the two images. Revista Investigación e Innovación en Ingenierías, vol. 9, n°. 2, pp. 7-25, Enero-julio 2021. DOI: https://doi.org/10.17081/invinno.9.2.3961
22   Andrés Ovidio Restrepo Rodríguez, Nelson Enrique Vera Parra, Rubén Javier Medina Daza

     Also, by observing the results of the Universal Image Q Index, the values of the quality percentage lie in the
     interval [70.95%, 76.11%], which is an acceptable range of percentages. Moreover, the BIAS index yields an
     average value of 0.3525, which is also a value near zero, indicating strong similarity between the two images.
     In addition, the ERGAS coefficient has an average value of 15.63%, which corresponds to a high percentage,
     sice its ideal value should also be near zero. Finally, the spatial gain indicator of Table 7, based on the value
     of a correlation coefficient, shows the average spatial gain for each of the RGB bands.

     Table 7 Spatial Gain mean values

                                                  Band                                      Spatial Gain

                                                    R                                           0.0983

                                                    G                                           0.1164

                                                    B                                           0.1381

     Source: Own elaboration

     Conclusions

     The analysis presented leads to conclude that, when evaluating image processing performance in terms of
     running time, the implementation of the proposed algorithm using the CPU/GPU heterogeneous computing
     architecture exhibits significantly shorter processing times. The reductions in processing time remain
     significant despite observing a degree-3 polynomial time-increasing function on the size of images for both
     the serial and parallel processing scenarios, at work [21] they conclude that as the image size increases,
     time increases significantly in CPU and relatively low in GPU.. Improvements can be dimensioned by
     observing specific results obtained with the serial and parallel architectures, namely, for the largest image
     size, processing time reductions led to 532.53 times faster processing, as you can see in the work done in
     [22, 23, 24]. For this particular study, when employing the Brovey transform along with a spectral richness
     calibration stage over heterogeneous processing, the size of the image has negligible impact on running
     times. This can be observed in the reduced time differences recorded in the CPU/GPU scenarios for different
     image sizes.

     The analysis derived from visual comparison between the original multispectral image, the panchromatic
     image, and the processed image indicates that the observable changes in images are significant, especially
     when comparing the resulting image with the input multispectral image. This is achieved by incorporating
     better spatial definition, leading to images in which objects can be clearly identified, also preserving and
     calibrating the spectral richness from the multispectral input image. Moreover, this level of spatial detail
     combined with a high degree of spectral richness provides a broad and detailed source of information that
     can be used in other application studies such as those on object detection, object recognition and object
     prediction.

     By gathering the values of several statistical indices used in both spatial and spectral assessment, it can
     be concluded that, for the proposed implementation, the correlation coefficient applied on a band-to-band
     basis shows no significant differences when changing the size of images. The same is true for the correlation
     coefficient in the case of the band-to-panchromatic comparison. Therefore, the size of the image has no
     direct impact on the correlation between the original images and the processed images. However, when
     comparing these two correlation indices, band-to-band vs band-to-panchromatic, it can be observed
     that, on average, the CC of the band-to-panchromatic case is higher than the band-to-band CC. Hence, the

       Revista Investigación e Innovación en Ingenierías, vol. 9, 2°. 1, pp. 7-25, Enero-julio 2021. DOI: https://doi.org/10.17081/invinno.9.2.3961
Fusión de imágenes satelitales usando la trasformada de Brovey y enriquecimiento espectral sobre 23
computación heterogénea CPU/GPU
panchromatic input image has a larger impact on the resulting processed image than the multispectral
input image although the quality of the final image depends on the two input images. In terms of spatial
gain, it is clear that every band exhibits a degree of spatial gain. However, the largest values of spatial gain
are observable in the Blue band (B). As you can see in the works of [25, 26, 27, 28].
Satellite image fusion should be aimed at increasing spatial detail of images while maintaining the level of
spectral components. Thus, significant contributions can be made for applications such as crop or water-
body identification, which arise permanently in agricultural and hydrology studies [25, 26, 27, 28, 29].
Bibliographic references
1. P. Erbao and Z. Guotong, “Image Processing Technology Research of On-Line Thread Processing,”
Energy Procedia, vol. 17, pp. 1408–1415, 2012. DOI: https://doi.org/10.1016/j.egypro.2012.02.260.
2. V. Solanky and S. K. Katiyar, “Pixel-level image fusion techniques in remote sensing: a review,” Spatial
Information Research, vol. 24, no. 4, pp. 475–483, Aug. 2016. DOI: https://doi.org/10.1007/s41324-016-
0046-6.
3. R. Swathika and T. S. Sharmila, “Image fusion for MODIS and Landsat images using top hat based
moving technique with FIS,” Cluster Computing, pp. 1–9, 2018. DOI: https://doi.org/10.1007/s10586-
018-1802-2.
4. A. Gupta and V. Dey, “A Comparative Investigation of Image Fusion in the Context of Classification,”
Journal of the Indian Society of Remote Sensing, vol. 40, no. 2, pp. 167–178, 2012. DOI: https://doi.
org/10.1007/s12524-011-0138-7.
5. R. J. Medina Daza, C. Pinilla Ruiz, and L. Joyanes Aguilar, “Two-dimensional fast Haar wavelet transform
for satellite-image fusion,” Journal of Applied Remote Sensing, vol. 7, no. 1, p. 073698, Sep. 2013. DOI:
https://doi.org/10.1117/1.jrs.7.073698.
6. C. L. Zhang, Y. P. Xu, Z. J. Xu, J. He, J. Wang, and J. H. Adu, “A Fuzzy Neural Network Based Dynamic Data
Allocation Model on Heterogeneous Multi-GPUs for Large-scale Computations,” International Journal
of Automation and Computing, vol. 15, no. 2, pp. 181–193, Apr. 2018. DOI: https://doi.org/10.1007/
s11633-018-1120-4.
7. S. Westerlund and C. Harris, “Performance analysis of GPU-accelerated filter-based source finding for
HI spectral line image data,” Experimental Astronomy, vol. 39, no. 1, pp. 95–117, Mar. 2015. DOI: https://
doi.org/10.1007/s10686-015-9445-2.
8. F. Ye, X. Li, and X. Zhang, “FusionCNN: a remote sensing image fusion algorithm based on deep
convolutional neural networks,” Multimedia Tools and Applications, vol. 78, no. 11, pp. 14683–14703,
Jun. 2019. DOI: https://doi.org/10.1007/s11042-018-6850-3.
9. V. Alvarez-Ramos, V. Ponomaryov, and R. Reyes-Reyes, “Image super-resolution via two coupled
dictionaries and sparse representation,” Multimedia Tools and Applications, vol. 77, no. 11, pp. 13487–
13511, Jun. 2018. DOI: https://doi.org/10.1007/s11042-017-4968-3.
10. A. D. Vaiopoulos, “Developing Matlab scripts for image analysis and quality assessment,” in
Earth Resources and Environmental Remote Sensing/GIS Applications II, 2011. DOI: https://doi.
org/10.1117/12.897806.
11. N. Jindal and K. Singh, “Applicability of fractional transforms in image processing - review, technical
challenges and future trends,” Multimedia Tools and Applications, vol. 78, no. 8, pp. 10673–10700, Apr.
2019. DOI: https://doi.org/10.1007/s11042-018-6594-0.
Revista Investigación e Innovación en Ingenierías, vol. 9, n°. 2, pp. 7-25, Enero-julio 2021. DOI: https://doi.org/10.17081/invinno.9.2.396124 Andrés Ovidio Restrepo Rodríguez, Nelson Enrique Vera Parra, Rubén Javier Medina Daza
12. A. O. R. Rodríguez, D. E. C. Mateus, P. A. G. García, C. E. M. Marín, and R. G. Crespo, “Hyperparameter
optimization for image recognition over an AR-Sandbox based on convolutional neural networks
applying a previous phase of segmentation by color-space,” Symmetry, vol. 10, no. 12, Dec. 2018. DOI:
https://doi.org/10.3390/sym10120743.
13. L. Meijie, D. Yongshou, Z. Jie, Z. Xi, M. Junmin, and X. Qinchuan, “PCA-based sea-ice image fusion of
optical data by HIS transform and SAR data by wavelet transform”. . DOI: https://doi.org/10.1007/
s13131-015.
14. X. Zhu and W. Bao, “Investigation of Remote Sensing Image Fusion Strategy Applying PCA to Wavelet
Packet Analysis Based on IHS Transform,” Journal of the Indian Society of Remote Sensing, vol. 47, no.
3, pp. 413–425, Mar. 2019. DOI: https://doi.org/10.1007/s12524-018-0930-8.
15. X. Li and L. Wang, “On the study of fusion techniques for bad geological remote sensing image,”
Journal of Ambient Intelligence and Humanized Computing, vol. 6, no. 1, pp. 141–149, 2015. DOI: https://
doi.org/10.1007/s12652-015-0255-1.
16. N. Vera, C. Rojas, and J. Peréz, OPENCL PRÁCTICO COMPUTACIÓN HETEROGÉNEA PARALELA. Bogotá:
Colección Doctorado en Ingeniería, Universidad Distrital Francisco José de Caldas, 2019.
17. W. Cao, C. fu Xu, Z. hua Wang, L. Yao, and H. yong Liu, “CPU/GPU computing for a multi-block structured
grid based high-order flow solver on a large heterogeneous system,” Cluster Computing, vol. 17, no.
2, pp. 255–270, 2014. DOI: https://doi.org/10.1007/s10586-013-0332-1.
18. C. Lee, W. W. Ro, and J. L. Gaudiot, “Boosting CUDA applications with CPU-GPU hybrid computing,”
International Journal of Parallel Programming, vol. 42, no. 2, pp. 384–404, 2014. DOI: https://doi.
org/10.1007/s10766-013-0252-y.
19. G. He, S. Xing, Z. Xia, Q. Huang, and J. Fan, “Panchromatic and multi-spectral image fusion for new
satellites based on multi-channel deep model,” in Machine Vision and Applications, 2018, vol. 29, no.
6, pp. 933–946. DOI: https://doi.org/10.1007/s00138-018-0964-5.
20. C. Graca, G. Falcao, I. N. Figueiredo, and S. Kumar, “Hybrid multi-GPU computing: accelerated kernels
for segmentation and object detection with medical image processing applications,” Journal of Real-
Time Image Processing, vol. 13, no. 1, pp. 227–244, Mar. 2017. DOI: https://doi.org/10.1007/s11554-015-
0517-3.
21. I. S. Acikgoz, M. Teke, U. Kutbay, and F. Hardalac, “Performance evaluation of pansharpening methods
on GPU for RASAT images,” RAST 2015 - Proceedings of 7th International Conference on Recent
Advances in Space Technologies, pp. 283–288, 2015. DOI: https://doi.org/10.1109/RAST.2015.7208356.
22. [22] A. Asaduzzaman, A. Martinez, and A. Sepehri, “A time-efficient image processing algorithm for
multicore/manycore parallel computing,” in Conference Proceedings - IEEE SOUTHEASTCON, 2015, vol.
2015-June, no. June. DOI: https://doi.org/10.1109/SECON.2015.7132924.
23. Y. Ma, L. Chen, P. Liu, and K. Lu, “Parallel programing templates for remote sensing image processing
on GPU architectures: design and implementation,” Computing, vol. 98, no. 1–2, pp. 7–33, Jan. 2016.
DOI: https://doi.org/10.1007/s00607-014-0392-y.
24. J. Zhang and K. H. Lim, “Implementation of a covariance-based principal component analysis
algorithm with a CUDA-enabled graphics processing unit,” in International Geoscience and Remote
Sensing Symposium (IGARSS), 2011. DOI: https://doi.org/10.1109/IGARSS.2011.6049460.
25. S. D. Jawak and A. J. Luis, “A Comprehensive Evaluation of PAN-Sharpening Algorithms Coupled
with Resampling Methods for Image Synthesis of Very High Resolution Remotely Sensed Satellite
Data,” Advances in Remote Sensing, vol. 02, no. 04, pp. 332–344, 2013. DOI: https://doi.org/10.4236/
ars.2013.24036.
Revista Investigación e Innovación en Ingenierías, vol. 9, 2°. 1, pp. 7-25, Enero-julio 2021. DOI: https://doi.org/10.17081/invinno.9.2.3961Fusión de imágenes satelitales usando la trasformada de Brovey y enriquecimiento espectral sobre 25
computación heterogénea CPU/GPU
26. M. Lillo-Saavedra, C. Gonzalo, A. Arquero, and E. Martinez, “Fusion of multispectral and panchromatic
satellite sensor imagery based on tailored filtering in the Fourier domain,” International Journal of
Remote Sensing, vol. 26, no. 6, pp. 1263–1268, Mar. 2005. DOI: https://doi.org/10.1080/0143116041233
1330239.
27. H. Ghassemian, “A review of remote sensing image fusion methods,” Information Fusion, vol. 32.
Elsevier B.V., pp. 75–89, 01-Nov-2016. DOI: https://doi.org/10.1016/j.inffus.2016.03.003.
28. Z. Liu, E. Blasch, G. Bhatnagar, V. John, W. Wu, and R. S. Blum, “Fusing synergistic information from
multi-sensor images: An overview from implementation to performance assessment,” Information
Fusion, vol. 42, pp. 127–145, Jul. 2018. DOI: https://doi.org/10.1016/j.inffus.2017.10.010.
29. L. Alparone, L. Wald, J. Chanussot, C. Thomas, P. Gamba, and L. M. Bruce, “Comparison of pansharpening
algorithms: Outcome of the 2006 GRS-S data-fusion contest,” in IEEE Transactions on Geoscience and
Remote Sensing, 2007, vol. 45, no. 10, pp. 3012–3021. DOI: https://doi.org/10.1109/TGRS.2007.904923.
Revista Investigación e Innovación en Ingenierías, vol. 9, n°. 2, pp. 7-25, Enero-julio 2021. DOI: https://doi.org/10.17081/invinno.9.2.3961You can also read