Full Year 2020 Results - 04 March 2021 LEADING THE WORLD OF MOLTEN METAL FLOW ENGINEERING - Vesuvius
←
→
Page content transcription
If your browser does not render page correctly, please read the page content below
Full Year 2020
                                                            Results
                                                              04 March 2021

LEADING THE WORLD OF MOLTEN METAL FLOW ENGINEERING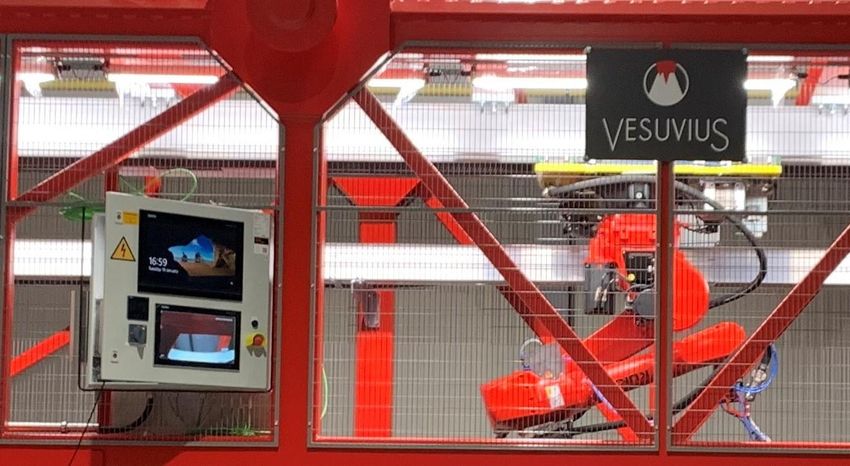
Disclaimer
This presentation (which includes this document, the oral presentation of this document, any question-and-answer session that follows that oral presentation and any other materials distributed at, or in
connection with, such presentation), which has been prepared by Vesuvius plc (the “Company”), includes statements that are, or may be deemed to be, “forward looking statements”, which can be
identified by the use of forward looking terminology, including (but not limited to) the terms “believes”, “estimates”, “plans”, “projects”, “anticipates”, “expects”, “intends”, “may”, “will”, or “should” or, in each
case, their negative or other variations or comparable terminology. These forward looking statements include matters that are not historical facts and include statements regarding the Company’s
intentions, beliefs or current expectations. By their nature, forward looking statements involve risk and uncertainty because they relate to future events and circumstances. A number of factors could cause
actual results and developments to differ materially from those expressed or implied by any forward looking statements. Any forward looking statement in this presentation reflects the Company’s view with
respect to future events as at the date of this presentation and is subject to risks relating to future events and other risks, uncertainties and assumptions relating to the Company and its subsidiaries’
operations, results of operations, growth strategy and liquidity. The Company undertakes no obligation publicly to release the results of any revisions or updates to any forward looking statement in this
presentation that may occur due to any change in its expectations or to reflect events or circumstances after the date of this presentation. In addition, forward looking statements contained in this
presentation regarding past trends or activities should not be taken as a representation that such trends or activities will continue in the future.
Certain industry and market data contained in this presentation has been derived from third-party sources. While the Company believes each of these sources to be accurate, there is no guarantee as to
the accuracy or completeness of such data, and the Company has not independently verified such data. In addition, certain of the industry and market data contained in this presentation has been derived
from the Company’s own internal research, knowledge and experience of the market. While the Company believes that such data is reasonable and reliable, both it and the underlying methodology and
assumptions have not been verified by any independent source for accuracy or completeness and are subject to change without notice. Accordingly, the Company makes no representation as to the
accuracy or completeness of the industry or market data contained in this presentation and no reliance should be placed on any of the industry or market data contained in this presentation.
This presentation includes extracts from the Announcement of Full Year results for the twelve months ended 31 December 2020. You should read the whole of that announcement. No reliance should be
placed for any purposes whatsoever on the information contained in this presentation or on its completeness. Except as required by applicable law, the Company (nor any of its affiliates, associates,
directors, officers, employees, advisers) or any other person is under any duty to update or inform a recipient of this presentation of any change to the information contained in this presentation.
The presentation is being provided for information purposes only. The information contained in the presentation does not constitute or form part of, and should not be construed as, an offer to sell or issue,
or the solicitation of an offer to buy or subscribe for, securities or other financial instruments of the Company or any of its subsidiaries in any jurisdiction, or an inducement to enter into investment activity.
No part of the presentation, nor the fact of its distribution, should form the basis of, or be relied on in connection with, any contract or commitment or investment decision whatsoever.
The presentation is being made only to, and is only directed at, persons to whom such presentation may lawfully be communicated. This presentation is being made only to and directed only at persons in
member states of the European Economic Area (“EEA”) who are qualified investors within the meaning of Article 2(1)(e) of the Prospectus Directive (Directive 2003/71/EC), as amended (“Qualified
Investors”). In the UK, this presentation is being made and directed only at Qualified Investors who are persons who have professional experience in matters relating to investments falling within Article
19(5) of the Financial Services and Markets Act 2000 (Financial Promotion) Order 2005, as amended (the “Order”), and persons who are high net worth entities falling within Article 49(2)(a) to (d) of the
Order, or are persons to whom it may otherwise be lawful to communicate it to (all such persons being referred to as “Relevant Persons”). This presentation must not be acted on (i) in the UK by persons
who are not Relevant Persons and (ii) in any member state of the EEA other than the UK, by persons who are not Qualified Investors. Any investment or investment activity to which this presentation
relates is available only to Relevant Persons in the UK and Qualified Investors in any member state of the EEA other than the UK and will be engaged in only with such persons.
This presentation is not an offer of securities and is not for publication or distribution in the United States or to persons in the US (within the meaning of Regulation S under the US Securities Act of 1933, as
amended), or in any other jurisdiction where such distribution is unlawful.
                                                                                                                                                                                                                           page 2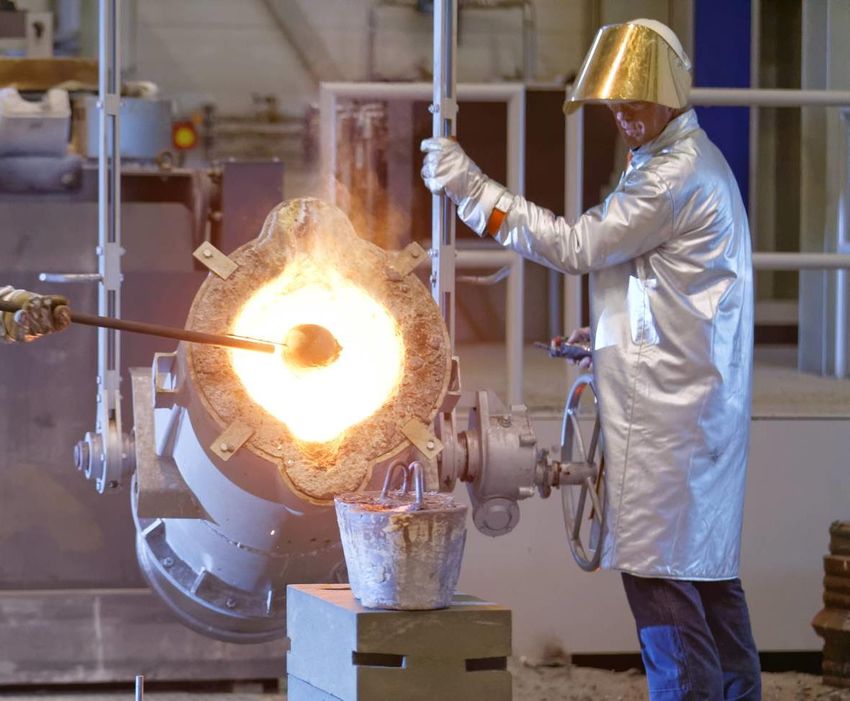
Contents
• Performance update
• Financial review
• Outlook
• Appendix
Performance
update
Summary financials
                     Revenue                            Trading profit          Return on sales

                  £1,458.3m                               £101.4m                       7.0%
                            -14.7%                           -44.1%                    -360 bps
                    Reported change                       Reported change           Reported change

                            -12.7%                           -43.3%                    -370 bps
                   Underlying change                     Underlying change          Underlying change

              Headline EPS                            Net debt / EBITDA        Cash conversion

                          23.2p                               1.2x                     173%
                           -48.6%                        Dec 2019: 1.1x             2019: 120.0%

                                             Proposed full year dividend of 17.4p
Net debt / EBITDA ratios are post IFRS-16.                                                              page 5
Decisive response enables Vesuvius to emerge stronger
from the crisis

Optimised plant network geared for growth after successful restructuring
  ▪ Delivered £20.6m of recurring savings in 2020 with a further £4.3m to be realised in 2021
  ▪ Global production capacity preserved despite plant closures, ready to follow market demand ramp-up

Leaner and more efficient, with new ways of working
  ▪ Delivered £39.0m of temporary cost savings in 2020 – more than £8m are expected to become permanent

Future top-line growth drivers protected during the crisis
  ▪ Maintained industry-leading level of R&D investment, supporting top-line growth
  ▪ 10 new products launched in 2020 with 22 new product launches planned in 2021

Strong cash management supported by our entrepreneurial, decentralised business model
 ▪ Working capital / sales (12m average) improved to 23.2% versus 24.0% at the end of 2019

                                                                                                          page 6
New Group Sustainability Initiative
Objective to reach NET ZERO carbon footprint by 2050 at the latest

Progress follow-up:
                                                                        Intermediate Targets
▪ 9 intermediate targets
                                                       Energy                       Energy CO2e
                                                1      consumption          2       emissions        3   Wastewater
▪ 56 KPIs monitored
                                                                                    Recovered &
▪ Establishment of the Vesuvius                 4      Solid waste          5       recycled         6   Safety
                                                                                    materials
  Sustainability Council
                                                                                    Supplier
                                                       Gender                                            Compliance
                                                7      diversity            8       sustainability   9   training
                                                                                    assessments

      UN Global Compact                                     Our targets directly support 6 of the UN SDGs
      Reflects our commitment to the UN
      principles in the areas of human rights,
      labour, the environment and anti-corruption
                                                    Sustainable Development Goals
                                                                                                                      page 7
Positive momentum on our intermediate targets
 KPI                                                                                  Target            Progress in 2020
 Energy Consumption                                                             10% reduction by 2025
                                                                                                              -3.4%
 Energy consumption per metric tonne of product packed for shipment                   (vs 2019)
 CO2 Emission                                                                   10% reduction by 2025
                                                                                                              -3.9%
 Energy CO2e emissions per metric tonne of product packed for shipment                (vs 2019)
 Waste Water                                                                    25% reduction by 2025
                                                                                                              -7.5%
 Waste water per metric tonne of product packed for shipment                          (vs 2019)
 Solid Waste                                                                     25% reduction 2025
 Solid waste (hazardous and sent to landfill) per metric tonne of product                                     -16.1%
 packed for shipment                                                                 (vs 2019)

 Recovered and Recycled Material
                                                                                7% to be used by 2025    5.8% (2019: 6.2%)
 Recovered or recycled materials from external sources
 Safety
                                                                                    Zero accident        1.12 (2019: 1.54)
 Lost Time Injury Frequency Rate (per million hours worked)
 Gender Diversity
                                                                                    30% by 2025         20% (2019: 12.5%)
 Female representation in Top Management (GEC plus key direct reports)
 Supply Chain                                                                    50% of Group spend        Programme
 Sustainability assessments of raw material suppliers                             by the end of 2023        launched
 Compliance Training
                                                                                At least 90% annually         100%
 Percentage of targeted staff completing Anti-Bribery and Corruption training
                                                                                                                             page 8
CO2e: carbon dioxide equivalent
We help our customers improve their sustainability
performance
Our area of expertise The product Key product feature Value creation for customer
▪ Improve safety
Multiple reuse
Material Duraflex and long-lasting
▪ Reduce raw materials
Science ladle shrouds consumption
refractory material
▪ Reduce CO2 emissions
Pattern redesign
Application with Feedex Metal yield increase ▪ Reduce CO2 emissions
engineering sleeves
Laser ▪ Reduce raw materials
Digital Contouring
Increase ladle lining lifetime
consumption
solutions System Increase ladle capacity ▪ Reduce CO2 emissions
Robotic Tube Eliminate exposure
▪ Improve safety
Mechatronics Changer to hot metal
page 9World steel production: Recovery in H2 2020 across all
regions
20.0%
Vietnam
15.0% +11.6% China
+5.2%
Crude steel production growth 2020
10.0%
Turkey
5.0% Middle East1
+6.0% CIS2
2.7% +1.0%
0.0%
Crude steel production volume 2020
EU 27 +UK
-5.0% India -11.8%
-10.6% Crude Steel Production
H1 2020 H2 2020 FY 2020
-10.0% Growth
South America World -6.0% 3.9% -0.9%
-8.6% China 1.4% 9.5% 5.2%
-15.0%
World ex-China -14.3% -2.9% -8.2%
NAFTA India -24.2% 1.9% -10.6%
-20.0% -15.5% NAFTA -17.6% -13.7% -15.5%
South America -19.9% 3.3% -8.6%
-25.0% EU 27 + UK -18.7% -5.0% -11.8%
Size of bubble represents relative revenue of Vesuvius’ Steel Division in 2020 CIS -3.9% 6.1% 1.0%
Turkey -4.1% 16.2% 6.0%
Note 1: Middle East: GCC + Iran
Note 2: CIS: Azerbaijan, Armenia, Belarus, Kazakhstan, Russia, Ukraine Middle East -0.3% 5.6% 2.7% page 10Steel division sales outperformed the steel market in most
regions
Steel division sales volume was 1.1% above steel production in the world excluding China & Iran
Average price impact on Steel Division sales -1.7%
40.0% Turkey
Vesuvius: +36.7%
WSA: +6.0%
Steel Division revenue growth 2020/2019
Vietnam
South America CIS2 Vesuvius: +16.7%
Vesuvius: +5.8% 20.0%
Vesuvius: +9.2% WSA: +11.6%
WSA: -8.6% WSA: +1.0%
0.0%
-20.0% -15.0% -10.0% -5.0% 0.0% 5.0% 10.0% 15.0% 20.0%
India Crude steel
Vesuvius: -10.5% China production growth
WSA: -10.6% -20.0% Vesuvius: -2.0%
WSA: +5.2%
EU 27 + UK
NAFTA: Vesuvius: -11.7%
Vesuvius: -15.5% WSA: -11.8% -40.0%
WSA: -15.5%
-60.0%
Middle East1
Vesuvius: -68.9%
Size of bubble represents relative revenue of Vesuvius’ Steel Division in 2020 WSA: +2.7%
-80.0%
Note 1: Middle East: GCC + Iran
Note 2: CIS: Azerbaijan, Armenia, Belarus, Kazakhstan, Russia, Ukraine Sales volume growth exceeding market growth Sales volume growth below market growth page 11Divisional performance: Steel
2020 performance Key Financials
Steel sales volume outperformed steel production Reported Underlying
in the world (ex-China and Iran) by 1.1% change
2020 2019 Change
• Market outperformance in EU 27+UK and NAFTA
Revenue 1,045.4 1,195.3 -12.5% -10.4%
• Strong performance in the growing markets of
India, Vietnam, Turkey, Russia, Ukraine and South Trading
76.4 120.1 -36.4% -36.2%
America Profit
Return on
• China: positive growth in Flow Control; whilst 7.3% 10.0% -270 bps -290 bps
Sales
Advanced Refractories retreated from some low-
margin businesses
Underlying Revenue1 / Return on Sales
• Middle East: our business was mostly impacted by 10.0%
lack of sales from Iran, where we stopped supply in
2019 7.3%
• Price decline limited to 1.7% (pass through of raw 1,141.9
material price declines to customers) 1,023.3
2019 2020
Note 1. 2020 underlying financials have been adjusted for the CCPI acquisition and 2019 underlying financials have been adjusted for the effects of currency translations and the CCPI acquisition page 12Foundry end-market volumes: Recovery since Q4 2020 after
unprecedented declines
30.0%
EEMEA Europe (EU 27 + UK) NAFTA India South America China
20.0%
10.0%
0.0%
-10.0%
-20.0%
-30.0%
-40.0%
-50.0%
-60.0%
-70.0%
Medium & Heavy Light Vehicles Mining and General Engineering Railway and Marine Power Generation
Vehicles Construction
Equipment
% of 13% 22% 18% 16% 5% 5%
Foundry
Revenues1
Note: 1. The remainder of Foundry sales are generated from other end-markets page 13Our Foundry division outperformed light vehicle volumes in
most markets
Light Vehicles represent c.22% of foundry revenues
20%
China
Foundry excluding Fused Silica (FS) Performance
South America Foundry ex-FS Sales: +10%
10%
Foundry ex-FS Sales: -1% LV Production: -5%
LV Production: -31%
0%
Vehicle Production Growth
EEMEA1
-10%
EU-28 Foundry ex-FS Sales: -11%
Foundry ex-FS Sales: -22% LV Production: -16%
LV Production: -24%
-20%
India NAFTA
-30% Foundry ex-FS Sales: -25% Foundry ex-FS Sales: -27%
LV Production: -25% LV Production: -21%
-40%
-40% -30% -20% -10% 0% 10%
Size of bubble represents relative revenue of Vesuvius’ Foundry Division in 2020
Note: 1. EMEA (ex EU 27 + UK) Sales volume growth exceeding market growth Sales volume growth below market growth
page 14Divisional performance: Foundry
2020 performance Key Financials
Performance of the Foundry division reflects Reported Underlying
diverse end-market exposure and market share change
2020 2019 Change
gains in some regions
• China: 10% Foundry revenue growth reflects Revenue 412.9 515.1 -19.8% -17.9%
increasing penetration and good level of Trading
business activity 25.0 61.3 -59.2% -57.1%
Profit
• South America: Strong market share gains Return on
6.1% 11.9% -580 bps -560 bps
reflected in stable sales despite significant Sales
end-market declines in the region
(e.g. 31% decline in vehicle production) Underlying Revenue1 / Return on Sales
• Foundry’s largest end-markets are expected to 11.9%
benefit strongly from economic recovery – 6.1%
notably mining & construction and vehicle
production (c. 53% of Foundry sales)
503.2
412.9
2019 2020
Note 1. 2019 underlying financials have been adjusted for the effects of currency translations
page 15R&D investment maintained to support future organic growth
Vesuvius maintained its industry-leading
level of R&D investment, supporting future R&D as % of revenues
new product launches and top-line growth
1.9% 1.9%
▪ New VISO Research Centre commissioned 1.7%
▪ Expansion and modernisation of
Mechatronics Centre-Of-Excellence
completed
▪ 10 new products launched in 2020; 22 new
products to be launched in 2021
▪ Three mechatronics systems installed at
customer locations in Asia during the year
• Five further active projects for customers in 2018 2019 2020
the pipeline
page 16Focus on value-creating solutions:
Flow Control – Duraflex
Breakthrough generation of ladle shrouds
▪ Custom-designed for direct connection between
ladle and tundish
• Increases steel quality
• Increases operator safety
▪ Longer life
▪ Increases process efficiency
▪ Reduces carbon footprint during production
▪ Reusable, reducing waste by a factor of up to four
times
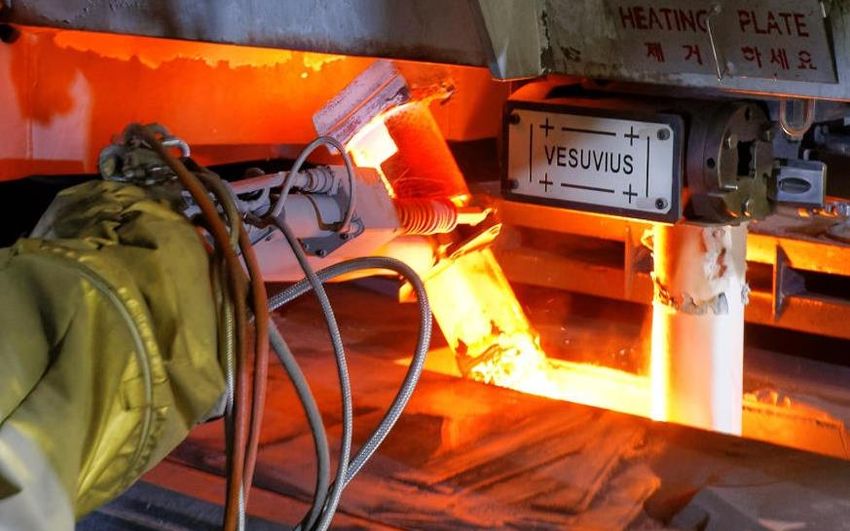
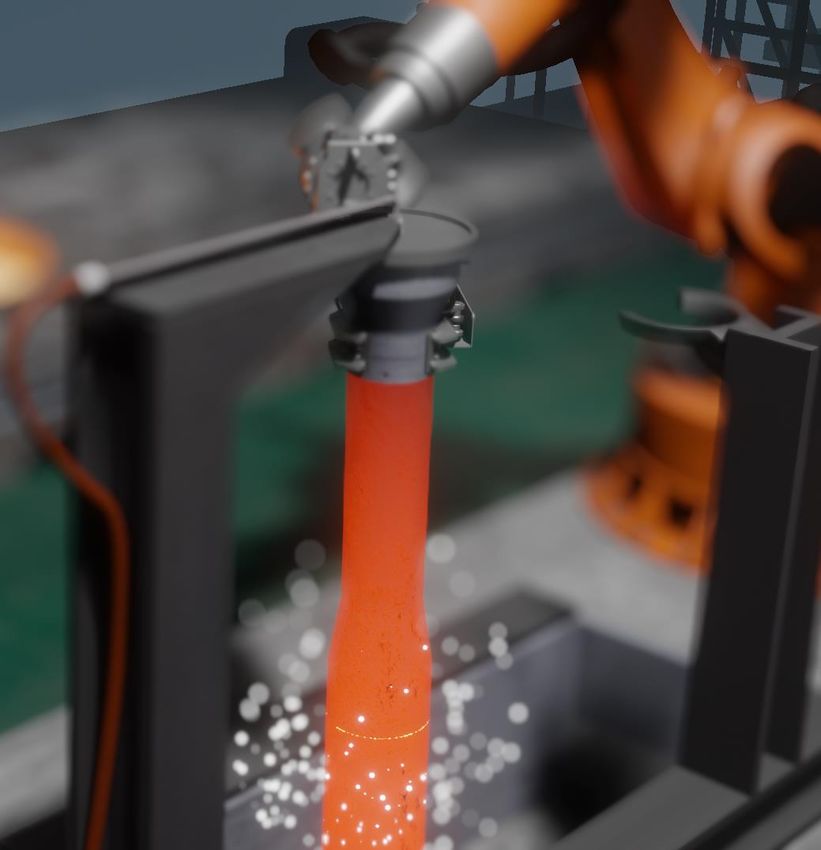
page 17Focus on value-creating solutions:
Advanced Refractories – NextGen Tundish Smart Robot
Fully-integrated spray application system
solution
▪ Computer-controlled robot ensures formula and
application consistency at all times
• Improves quality
• Reduces waste
▪ Digital data recording, tracking and remote
diagnostic features
• Increases operator safety
• Application flexibility increases process
efficiency
page 18Focus on value-creating solutions:
Foundry – Diamant degassing rotors
New suite of degassing consumables
▪ Patented rotor design
▪ Optimised hydrogen removal from aluminium melts
▪ Reduces gas consumption
▪ Service life increase of up to 200%
▪ More consistent degassing performance over time
▪ Reduces waste
▪ Lower cost per treatment
page 19Financial
review
page 20Sales impacted by Covid-19 crisis
Group revenues down 14.7% on a reported basis (-12.7% on an underlying basis)
(£m)
- 41.7 - 23.6
1,710.4 - 208.9
1,645.1
+ 22.1
1,436.2 1,458.3
2019 Reported FX Adjustments CCPI acquisition 2019 Underlying Steel & Foundry 2020 Underlying CCPI acquisition 2020 Reported
revenue revenue Divisions revenue revenue
page 21Decisive actions partially offset impact of sales decline
RoS
10.6%
(£m) - 7.0
- 2.5 - 84.3
181.4 171.9
7.0%
+ 18.3 + 4.0
- 8.5
97.5 101.4
2019 Reported FX Adjustments CCPI 2019 Underlying Steel & Foundry One-off costs Restructuring 2020 Underlying CCPI 2020 Reported
trading profit acquisition trading profit Divisions Savings¹ trading profit acquisition trading profit
Note 1: Excludes CCPI restructuring savings, which are captured in the CCPI bar. page 22Income statement
2020 2019 Change (%)
(£m unless indicated) Actual Actual As reported Underlying
Revenue 1,458.3 1,710.4 -14.7% -12.7%
Trading Profit 101.4 181.4 -44.1% -43.3%
ROS % 7.0% 10.6% -360 bps -370 bps
Post tax Share of JV Results 1.1 1.0
Net Finance Costs -10.9 -11.0
Headline Profit Before Tax 91.6 171.4 -46.6%
Effective Tax Rate 26.9% 25.7%
Tax -24.4 -43.8
Non-Controlling Interest -4.5 -6.2
Headline Earnings 62.7 121.4 -48.4%
Headline EPS (pence) 23.2 45.1 -48.6%
Notes:
Underlying basis is at constant currency and excludes separately reported items and the impact of acquisitions and disposals.
Income tax associated with headline performance, divided by the headline profit before tax and before the Group’s share of post-tax profit of joint ventures. page 23Track record of strong cash generation
Since 2016, our adjusted operating cash flow has grown 41% (2016-2020 CAGR of 8.8%)
Adjusted Operating Cash Flow
£250.0 m 200%
Cash Conversion Ratio %
173%
£200.0 m
150%
120%
£150.0 m 94% 104%
£m
91% 100%
£100.0 m
50%
£50.0 m
£125.0 m £171.5 m £179.4 m £217.7 m £175.2 m
£0.0 m 0%
2016 2017 2018 2019 2020
page 24Cash conversion of 173%
Focus on working capital management and capex reductions supported 173% cash
conversion (2019: 120%), demonstrating our ability to generate cash through the cycle
+ 23.8 + 1.6
+ 50.6 - 39.5
+ 37.5
175.2
101.4
2020 Reported Depreciation Net Capex 1 Trade Working Other Working Other Adjusted
Trading Profit Capital Capital operating cash
flow
Note 1. Net of proceeds from sale of property, plant and equipment. page 25Strong working capital performance
Improved working capital / sales ratio due to strong discipline in manufacturing
network to adjust production to sales without building significant excess inventory
Trade working capital / Sales (12m Trade working capital1 (£m)
average actuals)
26.6% 424.6
404.9
349.8 341.7
312.3
24.9%
23.9% 24.0%
23.2%
2016 2017 2018 2019 2020 Dec-18 Jun-19 Dec-19 Jun-20 Dec-20
Note 1: Trade Working Capital at constant currency. page 26£175.1m net debt and 1.2x net debt1 / LTM EBITDA
Net debt down £70m at £175.1m, versus £245.8m at year end 2019
(£m)
- 175.2
15.7 2.7
17.6
16.7 8.4
27.5 2.3
245.8
13.7
175.1
Net debt at year Adjusted Net interest Income taxes JV / Non Restructuring Dividends paid FX Impact Right of Use Others Net debt at year
end 2019 operating cash controlling Asset end 2020
flow interest Acquisition
dividends (Leases)
Note 1: Net debt / EBITDA ratios are post IFRS-16. page 27Outlook
page 28Outlook
▪ Clear signs of recovery are now apparent in both our Steel and Foundry end markets. We
believe that this recovery should accelerate in the second half of 2021, supported by the
lifting of most pandemic-related restrictions by then
▪ Vesuvius is emerging from this difficult period stronger than before. We have low leverage and an
optimised manufacturing footprint as a result of our successfully completed restructuring
programmes. We also benefit from our flexible and low capital intensive, entrepreneurial
and decentralised business model, which has proven its value during 2020
▪ We are confident that the Group will deliver a meaningful improvement in financial
performance in 2021
page 29Appendix LEADING THE WORLD OF MOLTEN METAL FLOW ENGINEERING
Environmental performance – long term CO2e emissions
     evolution (Scope 1 and 2)
     Our total CO2e emissions (energy + process) per Tonne of product packed per shipment have been reduced by
     18.0% since 2015

                                                                                     CO2e emission evolution per tonne produced
                                                                                                  (Scope 1 and 2)
                                                                        600
                       kg CO2e per metric tonne of product packed for

                                                                                                            -18.1%
                                                                        500

                                                                        400
                                         shipment

                                                                        300

                                                                        200

                                                                        100

                                                                              2015      2016         2017        2018            2019   2020
                                                                                     Energy CO2e                        Process CO2e
31
      CO2e: carbon dioxide equivalent                                                                                                          page 31
We help our customers improve their sustainability
Reduce exposure
to hot metal
Reduce consumption
of refractory material
per tonne of steel
Reduce CO2
emissions per tonne
of steel produced
Improve metal yield
(tonne of finished product
per tonne of molten metal)
page 32ISO 14001 certification of
Environmental impact manufacturing sites
analysis of Capex Sustainability assessments
Internal price of CO2 emissions of suppliers
at €30/t in 2021, reviewed
every year
10
Switch to green electricity
Support for education for women
on our sites whenever
in scientific fields
possible
i Priority ESG Actions
Employee engagement -Reduce Scopes 1 and 2 emissions
(+3% in 2020 despite the -Measure Scope 3 emissions,
pandemic) action plan to minimize
Our Planet Determine CO2 emissions
Gender diversity in
Assess new product avoided by customers,
top management
Our Communities developments and technologies action plan to maximize
based on their safety and
Our People environmental benefits
Our Customers page 335 year history at constant currency
2016 2017 2018 2019 2020
Revenue (£m) 1,431.2 1,610.6 1,766.3 1,668.8 1,458.3
Steel 961.1 1,098.7 1.213.9 1,165.6 1,045.4
Foundry 470.1 511.9 552.4 503.2 412.9
Trading Profit (£m) 137.1 157.8 191.9 174.4 101.4
Steel 81.3 96.4 124.8 116.0 76.4
Foundry 55.8 61.4 67.1 58.4 25.0
Return on Sales (%) 9.6% 9.8% 10.9% 10.4% 7.0%
Steel 8.5% 8.8% 10.3% 9.9% 7.3%
Foundry 11.9% 12.0% 12.2% 11.6% 6.1%
page 34Currency ready reckoner
Dec 2020 Rule of thumb for impact of a
movement in currency against
Currency Unit Approximate change in annual profit (£m) sterling (1 unit change)
USD 1 Cent 0.34 ▪ Amounts shown are movements
EUR 1 Cent (0.14) for each currency
INR 1 Rupee 0.13 ▪ Works both for strengthening and
weakening of currencies
RMB 0.1 RMB 0.35
JPY 1 Yen 0.05
BRL 0.1 Reais 0.11
ZAR 1 Rand 0.001
page 35Solid liquidity with significant balance sheet headroom
Net debt/EBITDA1 and headroom to
covenant (pre-IFRS 16)
▪ Reduced net debt on the back of strong cash
generation
▪ Wide headroom versus covenant2
▪ Stronger liquidity than at the start of the crisis
1.2 x
( £437m at end Dec 2020 versus £354m at
1.7 x 2.3 x
2.0 x 2.0 x end December 2019)
1.8 x
1.3 x
1.0 x 1.0 x 1.0 x
2016 2017 2018 2019 2020
Net debt / LTM EBITDA Headroom
Note: 1. Our covenants are based on net debt calculation excluding IFRS lease adjustments
2. The redemption of the 2010 USPP Notes raised our debt covenant limit from 3.0x to 3.25x net debt/LTM EBITDA page 36For further information, please contact: Euan Drysdale Group Head of Corporate Finance euan.drysdale@vesuvius.com Pamela Antay Head of Investor Relations pamela.antay@vesuvius.com LEADING THE WORLD OF MOLTEN METAL FLOW ENGINEERING
You can also read