From Metaphors to Formalism: A Heuristic Approach to Holistic Assessments of Ecosystem Health
←
→
Page content transcription
If your browser does not render page correctly, please read the page content below
RESEARCH ARTICLE

                                                          From Metaphors to Formalism: A Heuristic
                                                          Approach to Holistic Assessments of
                                                          Ecosystem Health
                                                          Heino O. Fock*, Gerd Kraus
                                                          Thünen Institute of Sea Fisheries, Hamburg, Germany

                                                          * Heino.fock@thuenen.de

       a11111
                                                          Abstract
                                                          Environmental policies employ metaphoric objectives such as ecosystem health, resilience
                                                          and sustainable provision of ecosystem services, which influence corresponding sustain-
                                                          ability assessments by means of normative settings such as assumptions on system
    OPEN ACCESS                                           description, indicator selection, aggregation of information and target setting. A heuristic
Citation: Fock HO, Kraus G (2016) From Metaphors
                                                          approach is developed for sustainability assessments to avoid ambiguity and applications
to Formalism: A Heuristic Approach to Holistic            to the EU Marine Strategy Framework Directive (MSFD) and OSPAR assessments are pre-
Assessments of Ecosystem Health. PLoS ONE 11(8):          sented. For MSFD, nineteen different assessment procedures have been proposed, but at
e0159481. doi:10.1371/journal.pone.0159481
                                                          present no agreed assessment procedure is available. The heuristic assessment frame-
Editor: Igor Linkov, US Army Engineer Research and        work is a functional-holistic approach comprising an ex-ante/ex-post assessment frame-
Development Center, UNITED STATES
                                                          work with specifically defined normative and systemic dimensions (EAEPNS). The outer
Received: August 30, 2015                                 normative dimension defines the ex-ante/ex-post framework, of which the latter branch
Accepted: July 5, 2016                                    delivers one measure of ecosystem health based on indicators and the former allows to
Published: August 10, 2016
                                                          account for the multi-dimensional nature of sustainability (social, economic, ecological) in
                                                          terms of modeling approaches. For MSFD, the ex-ante/ex-post framework replaces the cur-
Copyright: © 2016 Fock, Kraus. This is an open
access article distributed under the terms of the
                                                          rent distinction between assessments based on pressure and state descriptors. The ex-
Creative Commons Attribution License, which permits       ante and the ex-post branch each comprise an inner normative and a systemic dimension.
unrestricted use, distribution, and reproduction in any   The inner normative dimension in the ex-post branch considers additive utility models and
medium, provided the original author and source are
                                                          likelihood functions to standardize variables normalized with Bayesian modeling. Likelihood
credited.
                                                          functions allow precautionary target setting. The ex-post systemic dimension considers a
Data Availability Statement: All relevant data are
                                                          posteriori indicator selection by means of analysis of indicator space to avoid redundant
within the paper and its Supporting Information files.
                                                          indicator information as opposed to a priori indicator selection in deconstructive-structural
Funding: This work was supported by the Federal
                                                          approaches. Indicator information is expressed in terms of ecosystem variability by means
Ministry of Research and Education (BMBF; www.
bmbf.de). Project name:‘NOAH – Assessment of              of multivariate analysis procedures. The application to the OSPAR assessment for the
seafloor state in the German North Sea’, Grant            southern North Sea showed, that with the selected 36 indicators 48% of ecosystem variabil-
number FKZ 03F0671A. The work was carried out             ity could be explained. Tools for the ex-ante branch are risk and ecosystem models with the
within NOAH, but authors sere not funded through
                                                          capability to analyze trade-offs, generating model output for each of the pressure chains to
the project. The funder had no role in study design,
data collection and analysis, decision to publish, or     allow for a phasing-out of human pressures. The Bayesian measure of ecosystem health is
preparation of the manuscript.                            sensitive to trends in environmental features, but robust to ecosystem variability in line with
Competing Interests: The authors have declared no         state space models. The combination of the ex-ante and ex-post branch is essential to
competing interests exist.

PLOS ONE | DOI:10.1371/journal.pone.0159481 August 10, 2016                                                                                         1 / 29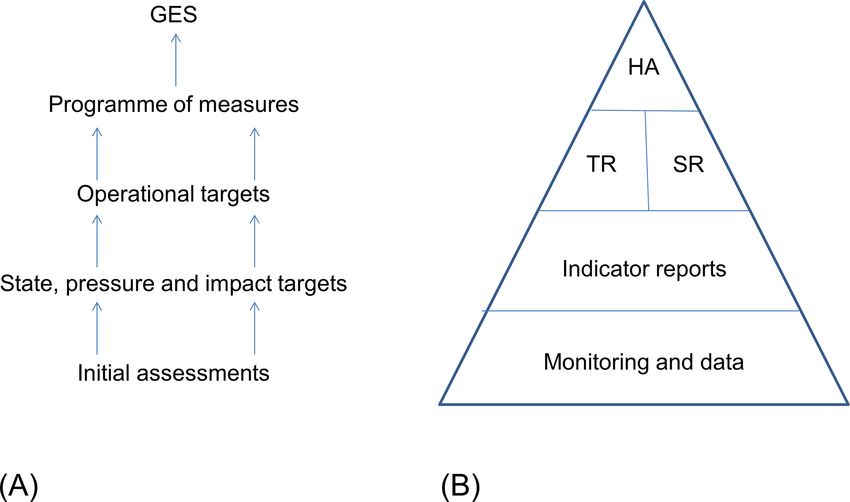
Assessment of Ecosystem Health

                                         evaluate ecosystem resilience and to adopt adaptive management. Based on requirements
                                         of the heuristic approach, three possible developments of this concept can be envisioned,
                                         i.e. a governance driven approach built upon participatory processes, a science driven func-
                                         tional-holistic approach requiring extensive monitoring to analyze complete ecosystem vari-
                                         ability, and an approach with emphasis on ex-ante modeling and ex-post assessment of
                                         well-studied subsystems.

                                         Introduction

                                            “The validity of a conclusion may be regarded as a compound event, depending upon the
                                            premises happening to be true; thus, to obtain the probability of the conclusion, we must
                                            multiply together the fractions expressing the probabilities of the premises.” W. S. Jevons,
                                            The Principles of Science, 1877, p. 209

                                         Lakoff and Johnson [1] argue that human cognitive concepts are all embedded in metaphors
                                         determining thought, language and action. Metaphors are either descriptive (size, orientation)
                                         or map complex structures onto simpler objects, and are therefore easy to communicate and
                                         aspirational, figurative or iconic [1,2]. The understanding of metaphors depends on the cul-
                                         tural context and its societal value framework within a ‘metaphoric web‘, but also on subjective
                                         understanding [3–5].
                                            Environmental policies such as the 1992 Rio Declaration on Environment and Development
                                         (Principle 7), the Millennium Ecosystem Assessment [6] and the Sustainability Development
                                         Goals as follow-up (e.g. [7]), the EU Marine Strategy Framework Directive (MSFD, 2008/56/
                                         EC, Art 3(5)) and the US National Ocean Policy (Executive Order 13547 on July 19th, 2010)
                                         commonly employ a range of ecological metaphors to convey their valued objectives and goals:
                                         inter alia ‘healthy environment’, ‘blue wealth, ‘productive ecosystems’, ‘ecosystem services’.
                                         ‘Ecosystem health’ appears as anoverarching principle indicative of unimpaired ecosystem
                                         functioning and sustainable use of ecosystem services [8–11]. ‘Ecosystem health’ is considered
                                         integrative and trans-disciplinary in that it combines the knowledge of the ecosystem with the
                                         knowledge of what is desirable, which necessitates consideration of all determinants of societal
                                         values, e.g. economic and cultural opportunities and human health [12,13].

                                         Rationale and outline of article
                                         Environmental metaphors express complex concepts (‘principal subject’ [14]) by means of sim-
                                         ple analogous sets of known entities (‘subsidiary subject’ [14]). This replacement is not possible
                                         without change of cognitive contents of the two subjects [14], and thus metaphors represent a
                                         certain cognitive strategy of analogical problem solving [1,15]. As such, Moser [15] interprets
                                         metaphors as tacit and a priori knowledge. Mikkelson [16] sees a danger in applying definitions
                                         that turn an empirical matter regarded as important into a generic a priori exercise. A single
                                         observation of ecosystem disorder would be such an empirical matter, but its generalization
                                         would then place it inside the metaphoric web of ecosystem health and thus establish it as part
                                         of the a priori tacit knowledge around this subject. Black [14] refers to this replacement process
                                         as ‘interaction’ (i.e. interaction metaphors, ‘conceptual metaphors’ [5] or 'structural metaphors'
                                         [1]), and distinguishes between ‘interaction views’ in the application of metaphors as opposed
                                         to ‘substitution’ and ‘comparison views’ with a 1:1 replacement in meaning (‘strong as a lion’).
                                         The transition from ‘comparative’ to ‘interaction view’ is gradual, since each metaphor

PLOS ONE | DOI:10.1371/journal.pone.0159481 August 10, 2016                                                                           2 / 29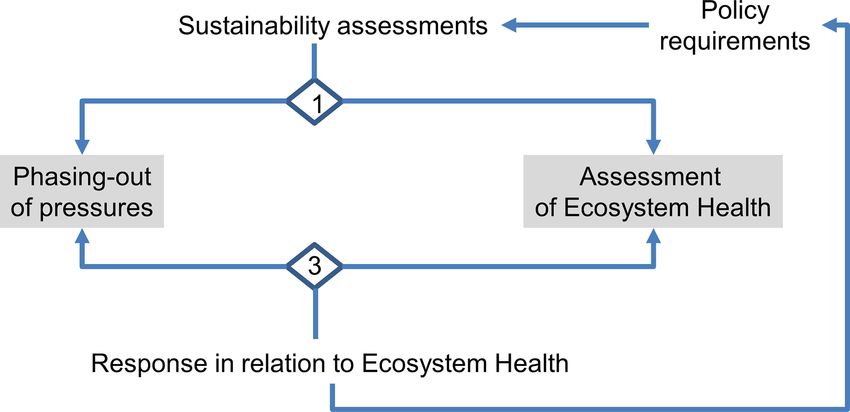
Assessment of Ecosystem Health

                                         comprises both descriptive and evaluative elements ('lion' comprises also a value) [5]. Evaluative
                                         elements inherently contain reflections on goals (‘is/ought problem‘, [5,17]), and metaphors with
                                         predominantly evaluative character are termed ‘generative metaphors’ according to Schön [18].
                                         Schön identified three stages in the replacement process to support policy making: ‘Generative
                                         metaphors’ provide or restructure a decision making framework (stage 2) for problem solving
                                         (stage 3) after problems have been identified in a first stage [18]. Thus, at the second step meta-
                                         phors have a heuristic and stimulating value expressing something that could not be expressed
                                         otherwise but are not yet operational [5,19–21]. From step 2 to step 3, generative metaphors
                                         require additional interpretation and–multiple–transformations within the metaphoric web to
                                         become a policy instrument in an operational context [14]. Examples from the OSPAR conven-
                                         tion area and the Great Lakes show that the term ecosystem health was adopted after negative
                                         observations in certain environmental sectors (e.g. eutrophication, pollution as indicators of eco-
                                         system distress, step 1) had led to the term (and metaphor) of ecosystem approach to manage-
                                         ment, which was transformed into the concept of ecosystem health as policy tool (step 2)
                                         operationalized in the first place by a suite of performance indicators (step 3) [22,23].
                                             Two implications arise from this translation process: Scientific analysis may lose its specific-
                                         ity and rigor, because scientific assertions are made that are not entirely based on data but val-
                                         ues [18,24–27]. This constitutes 'normative science', and in this context Sarewitz speaks of
                                         'scientization' of political disputes ([4], and references in [28]). Secondly, metaphors act as
                                         selection filters for the understanding of systems (for ecosystem services see discussion in Men-
                                         zie et al. [29]), channel the flow of information in scientific analyses [27,30] and influence
                                         methodologies and analytical concepts [2,31].
                                             In line with these arguments, we reverse Rapport's claim of being explicit about the dual
                                         character of metaphors in political debate comprising scientific facts and policy goals ([12],
                                         p. 42), and in turn postulate that metaphors of ecosystem health have a strong influence on the
                                         development of environmental assessments where this explicit differentiation has not been
                                         achieved. We argue that it is possible to develop a formalistic heuristic approach to functional-
                                         holistic assessments of ecosystem health, minimizing metaphorical influence and separating
                                         value system and scientific methods. The method applied is reconstructive metaphor analysis
                                         [32,33], i.e. to determine metaphor use in relation to an external reference system, which here
                                         is the use of metaphors in the context of sustainability assessment methodologies. Lakoff and
                                         Johnson term this ‘grounding a metaphor’ in a framework which can be directly understood
                                         ([1], p. 57), and Black defines this as a process of certification of meaning, which allows one to
                                         check a metaphor against its necessary associated statement ([19], p. 64). The latter may con-
                                         tain axiomatic statements like mathematical expressions and logical statements. Since meta-
                                         phors possess no ‘truth condition’ as opposite to falsifiable scientific theories, the question of
                                         metaphor use is not whether they are wrong but where they are misleading [19–21]. The link-
                                         age between sustainability and ecosystem health [8,34,35] allows us to adopt the methodology
                                         of sustainability assessments to assessments of ecosystem health. After reviewing the metaphor
                                         ‘ecosystem health’, we will provide an overview of sustainability assessment methodologies to
                                         obtain building blocks for the heuristic approach: the model of Binder et al. [36], the ex-post/
                                         ex-ante framework, indicator selection and indicator aggregation methodologies. The heuristic
                                         approach is outlined in the third section, in the first place as tailor-made approach for the
                                         MSFD, given that MSFD to date has no operational assessment protocol. The fourth section
                                         considers comparing the heuristic approach to environmental policies such as HOLAS for the
                                         Baltic Sea [37], OSPAR indicator based ecosystem assessments [38], for which an example is
                                         calculated, and EU Water Framework Directive (2000/60/EC; see [39]). These policy applica-
                                         tions are discussed against the background of existing scientific literature on ecosystem health
                                         assessments.

PLOS ONE | DOI:10.1371/journal.pone.0159481 August 10, 2016                                                                            3 / 29
Assessment of Ecosystem Health

                                         Ecosystem health as metaphor
                                         Ecosystem health is a two-stage metaphor with regards to the terms 'ecosystem' and 'health'. As
                                         a transformation of the concept of human health it has helped to facilitate a better understand-
                                         ing of ecosystem state for management, providing a language to describe dysfunctions and ill-
                                         ness of ecosystems [13,23,24,40,41]. In this negative definition, health thus means being free of
                                         disease and distress (in [42]). This way of understanding is linked to a background where eco-
                                         systems can develop their full potential in the absence of serious anthropogenic perturbations
                                         and cumulative impacts [40,43,44]. Accordingly, Calow [45] distinguishes between weak and
                                         strong analogies of health, with strong analogies making profound assumptions on system
                                         dynamics such as homeostatic processes and equilibrium states, whereas weak analogies simply
                                         state deviations from normality. The provisioning of ecosystem services appears often as an
                                         intrinsic component of the positive understanding of the term 'health' describing "the system's
                                         ability to realize functions desired by society and to maintain structures needed by its functions
                                         and by society over a long time" [42]. However, the application of ecosystem services to assess
                                         ecosystem health is problematic, since it remains unclear how changes in ecosystem services
                                         will affect changes of ecosystem health [9], and how this depends on the selection of ecosystem
                                         services to describe ecosystem health [29].
                                             The system's part of the metaphor either understands health as an emergent property of the
                                         entire system as a unit, with the possibility to assess overall ecosystem health as part of system's
                                         integrity [9,13], or as a characteristic of the parts of the system evidenced through individual
                                         indicators [46,47], of which ecosystem services are regarded as one type of indicator [13].
                                         Emergent properties are linked to the capabilities of a system to self-organize [48,49]. However,
                                         opposite to homeostasis in organisms, ecosystems have completely different control systems
                                         based on non-mutualistic mechanisms such as competition or predation [45]. In fact, the prev-
                                         alence of communality as a principle of ecosystem organization constitutes a significant misun-
                                         derstanding of ecosystem functioning [50].
                                             For assessments of ecosystem health, Borja et al. [51] distinguish between a deconstructive-
                                         structural assessment type based on compartmentalized ecosystem information in terms of
                                         indicators (the whole is the sum of parts as metaphor, see Table 1), and a functional-holistic
                                         approach assessing ecosystem health as a whole (metaphor of ecosystems as meta-organisms
                                         [8,9,23], but see [9,13]). Both approaches imply that recombining a set of characteristic features
                                         provides an accurate representation of ecosystem functioning, but the deconstructive-struc-
                                         tural method is characterized by significant a priori assumptions about the functioning of the
                                         system [51]. As for the selection of ecosystem services, the sum-of-parts metaphor may lead to
                                         considerable confusion in selecting indicators and metrics, in particular in cases where guid-
                                         ance warrants the analysis of “the essential features and characteristics" [52].
                                             Deconstructing-structural assessment types either apply linear or hierarchical schemes. Lin-
                                         ear schemes at indicator level likely indicate how deconstructing-structural approaches have
                                         developed: Jörgensen et al. [53] describe this for ecosystem health assessments, starting with
                                         single observations and the question: "What is wrong?", followed by a subsequent management
                                         measure, so that a reference to the system level is not needed. In practice, most concepts are
                                         deconstructive-structural (see [54]), with a hierarchical aggregation of information (top of pyr-
                                         amid as metaphor) retrieved from key indicators or key functions (key role as functional meta-
                                         phor) (Fig 1). At the regional scale in marine assessments, Helsinki Commission (HELCOM)
                                         assessments for the Baltic Sea region (HOLAS) aggregate information from 3 thematic assess-
                                         ments for contaminants, biodiversity and eutrophication condensed into one measure of eco-
                                         system health accompanied by analyses of human pressures [37]. Oslo-Paris Commission
                                         (OSPAR) assessments for the North-east Atlantic apply 9 thematic assessments that are

PLOS ONE | DOI:10.1371/journal.pone.0159481 August 10, 2016                                                                            4 / 29
Assessment of Ecosystem Health
Table 1. Examples of interaction metaphors with regards to ecosystem health in relation to assess-
ment type. Sources: [2,5,26,48,63–67]
Interaction metaphors associate d with. . .a
. . . deconstructive- structural assessment type Ecosystem as suite of components
Ecosystem services
. . . functional- holistic assessment type Ecosystem as meta-organism
Emergence (self-organization)
Ascendency (self-organization)
Gaia theory b
. . . both Ecosystem health
Ecosystem approach
Resilience
Tipping points (early warning)
Vulnerability
Vitality of socio-ecological systems
. . . assessment methods Hierarchy, hierarchical designs (pyramid, spider webs)
Everything must be in healthy condition (one-out-all-out)
Keystone, flagship species
a
Fischherz [65] lists 494 metaphors for sustainability, of which 36 originated from an ecological and 336 from
a sociological context. 24 metaphors were directly linked to ecosystem health. In turn, Larson [5] lists
ecosystem health under the topic conservation biology, together with 19 other metaphors in this category.
b
Larson [5] links the origin of holistic approaches to the Gaia theory.
doi:10.1371/journal.pone.0159481.t001
qualitatively aggregated into regional summaries [55]. The MSFD applies a hierarchy of attri-
butes, indicators, criteria and descriptors to assess ecosystem health. In the Great Lakes region,
as part of the NOAA goals for healthy oceans and coastal communities (http://www.ppi.noaa.
gov/goals/) aligned to the US National Ocean Policy, ecosystem health is assessed by means of
53 indicator reports aggregated into reports on physical, chemical and biological integrity [56].
All aforementioned deconstructive-structural approaches lack guidance to achieve the overall
assessment (see for Great Lakes [57], HOLAS [37,58], MSFD [59–61], OSPAR [55] despite
some progress during the ‘Utrecht workshop’ [62]).
Functional-holistic assessments focus on the analysis of the entire ecosystem, which is
expressed by means of emergent properties such as energy (e.g. exergy), network complexity
(e.g. entropy, ascendency) [35,44,47], homeostasis, balance between system components, and
the constituting criteria for ecosystem health, i.e. system vigor, resilience and diversity
[26,40,43]. This in part reflects the influence of the metaphoric web, since vigor, resilience and
diversity themselves are metaphors, which in turn are further described along dimensions
termed brittle, eutrophic and crystallized [8].
Sustainability assessment methodology
Dimensions of sustainability assessments: the Binder et al. model
Sustainability assessments provide decision-makers with evaluations of social-ecological sys-
tems within a multi-dimensional context to support decision making [68,69]: ecological, eco-
nomic, social (i.e. triple baseline; further spatial and human health dimensions according to
Rapport [70] can be assigned to the former three). Sustainability assessments comprise four
generic features: consideration of equity (among people, species, generations, geographic
regions), adopting a holistic perspective (view the entire system, integrate across sectors and
PLOS ONE | DOI:10.1371/journal.pone.0159481 August 10, 2016 5 / 29Assessment of Ecosystem Health
Fig 1. Deconstructing-structural hierarchical metaphors of ecosystem health. (A) Scheme applied in the EU Marine Strategy Framework Directive
(after [59]); (B) Scheme applied Holistic Assessment (HOLAS) of the Baltic Sea (after [37]). GES–good environmental status, HA–holistic assessment, SR–
scientific reports, TR–Thematic reports
doi:10.1371/journal.pone.0159481.g001
disciplines), incorporation of the triple base-line into the decision-making process (i.e. norma-
tive settings, participatory processes, methodology and treatment of uncertainties and risks,
adoption of the precautionary approach), and support of decision-making (governance issues,
communicative processes)[69,71]. Two different lines of assessment approaches have evolved
with regards to the treatment of the multi-dimensional context: firstly, integrated social, eco-
nomic and ecological sustainability assessments in terrestrial and marine ecosystems [6,72,73],
and secondly ecosystem-based assessments, mainly applied to marine systems, with subsequent
consideration of the socio-economic context [74,75].
Binder et al. [36,76] described a workflow to coordinate the assessment features into three
interacting assessment dimensions, i.e. normative, systemic and procedural (Fig 2), of which
the procedural dimension can be considered as umbrella for the normative dimension defining
the boundary conditions, and the systemic dimension making the assessment operational. The
normative dimension transfers political preferences and value-based assumptions into an
assessment framework: It defines the sustainability concept and the choice between weak and
strong sustainability [77]. It comprises a formulation of target setting [78], a definition of the
assessment type, assessment method and method of aggregation of assessment information
[79]. The normative dimension further prescribes how those social-ecological components
identified during a scoping phase interact within and between the normative and systemic
dimensions and thus how to integrate multidimensionality [36,75,80](Fig 2).
PLOS ONE | DOI:10.1371/journal.pone.0159481 August 10, 2016 6 / 29Assessment of Ecosystem Health
Fig 2. Dimensions and flow chart of sustainability assessments modified after Binder et al. [36].
doi:10.1371/journal.pone.0159481.g002
The ex-ante/ex-post framework
Assessment method can be described in terms of the ex-ante/ex-post methodologies. Ex-ante
assessments based on modeling allow for a prospective look on the social-ecological system and the
assessment of alternatives. In turn, ex-post assessments are based on existing data and put an
emphasis on retrospective evaluation [54,69,71]. Accordingly, Ness et al. [69] distinguish between
integrated or model based and indicator based assessments for ecosystems, but add product-related
indices with emphasis on the production process as third category. It is widely accepted that neither
applying indicators in an ex-post approach [81,82] nor applying ex-ante modelling [83] let alone
are not sufficient for a holistic assessment, but that a combination of ex-ante and ex-post methods
is essential for adaptive management designs, revealed through explicit modelling and monitoring
steps [75,84].The ex-ante/ex-post distinction is needed for evaluating the resilience in the dynamics
of social-ecological systems as sustainability assessment criterion [85,86].
Indicator selection in the systemic dimension
The systemic dimension describes the system in quantitative terms in a way that allows for
detection of change towards the sustainability goal (see [36]). System description is considered
PLOS ONE | DOI:10.1371/journal.pone.0159481 August 10, 2016 7 / 29Assessment of Ecosystem Health
a priori if the interpretation framework is existing before the analysis takes place and is typical
of deconstructive-structural assessments ('top-down' sensu [79]). This hampers the flow of
information and thus can create bias in the analysis [29,30]. In turn, data driven approaches
based on system variability are unbiased and considered a posteriori (e.g. [87]). A priori
approaches cannot be easily transferred into a posteriori approaches, given that the partitioning
of system variability is not transparent in a priori approaches.
Indicators provide a simplified and inherent measure for a complex system [88,89]. The
generating process is not translation as for metaphors, but adequate representation of system
information in the assessment, and accordingly indicator selection is based on sets of scientific
criteria and standards [82,90–93].
Three schools of indicator selection procedures can be identified: participatory, non-reduc-
tionist and reductionist [94,95]. Participatory indicator selection reflects on democratic pro-
cesses to enable stakeholder involvement and to facilitate user needs (bottom up, see [79,82]).
Reductionist approaches in terms of a priori concepts apply theory-driven indicator develop-
ment [88] or system based approaches [96], consider key areas and keystone species [91,97] or
key functions (ecosystem services, [10]). Except for non-reductionist approaches (see below),
indicator selection follows the principles of parsimony (few as possible) and sufficiency (cover-
ing all aspects) [36,88]. Key to the indicator selection problem in a posteriori structuring of eco-
system information is the non-redundant representation of system information in the
assessment [88,98]. Links between indicators can exist in either way, i.e. several indicators can
be linked to the same cause [39,99], and multiple causes may affect the same ecosystem compo-
nent or indicator [100]. OSPAR ecological quality issues (EcoQI) and NRC ecosystem indica-
tors represent theory driven indicator selection concepts [88] as opposed to multivariate
analyses revealing key variables (redundancy analysis [101], principal components analysis
[102]). Wiek and Binder [76] solved this by analyzing the indicator interaction matrix thus
reweighting contributions from each indicator to the final assessment, and Samhouri et al.
[103] identified links between indicators and model parameters by means of a generality index.
Surrogate variables from multivariate analysis such as principal components are less informa-
tive to exact indicators due to problems with regards to time series interpretation (i.e. time
series are not invariant), unclear pressure-state-response relationships (PSR) and unclear target
setting [104]. One important feature of multivariate techniques is that the selected indicators
can be interpreted in terms of the amount of system variability they explain. In marine assess-
ments, only few studies considered indicator interactions and reduction, mostly addressing
practical problems [102,105,106].
Non-reductionist approaches claim that the multidimensionality of sustainability assess-
ments can hardly be condensed into one single metric and that in particular different concepts
of value in economic and environmental assessments warrant the combined application of eco-
logical and economic indicators and metrics [95]. Bossel [96] presented a theory-based
approach selecting an a priori set of 14 indicators for each of the three sustainability dimen-
sions (ecological, social, economic). The Bossel approach has been highly influential in socio-
economic sustainability assessments in facilitating stakeholder participation and social learning
[71,94].
The non-reductionist view on indicator selection leads to a tendency in sustainability assess-
ments in moving towards an ‘indicator zoo’, where the increasing number in indicators has a
reciprocally decreasing influence on decision-making [82]. The tendency to focus on individual
indicators and their selection criteria generally overlooks the relevance of each indicator in the
overall assessment in terms of system information contained in these indicators [89]. Conse-
quently, the systemic dimension includes the analysis of interactions between indicators to
exclude redundancy [76]. For Great Lakes assessments, the initial set of more than 800
PLOS ONE | DOI:10.1371/journal.pone.0159481 August 10, 2016 8 / 29Assessment of Ecosystem Health
indicators was melted down to 53 indicators [57], and for ecosystem assessments in the Baltic
Sea, a special CORESET program was initiated to straighten the indicator portfolio [107].
The reduction of the number of indicators results in an increased level of abstraction for the
remaining indicators in relation to the system they represent, so that “objectivity may come at
the expense of usability” when specific problems are to be addressed [94].
Indicator aggregation methods in the systemic dimension
In ex-post assessments, constructing a composite index is the most common way to aggregate
information from the suite of selected indicators [54]. A clear policy goal is essential to develop
an index, and components of the index then can be based on theory, empirical evidence or
pragmatism [54,108].
Two ways of aggregating indicator information exist; i.e. additive and exclusive, and the
aggregation method must be coherent with the target setting. In exclusive integration, assess-
ments depend on either indicator A or indicator B (If A or B fail, overall evaluation is also nega-
tive). In an ecological context this either-or evaluation denies knowledge about system
variability. If the sum of indicator information is considered to form an aggregate index, i.e. the
integration method is additive (logical conjunction: A and B). Both methods differ in terms of
their probability characteristics. In case of either conditionally independent conjunctive or dis-
junctive assessment elements, the overall probability of indicating a certain state S, i.e. P(S),
decreases as the number of assessment elements Xi increases (see [109]):
Q
PðSÞ ¼ PðXi jSÞ ð1Þ
This relationship from Eq 1 applies to all indicators in exclusive, but selected independent
indicators in additive assessments, so that exclusive and additive assessment frameworks can-
not be combined into one assessment with consistent statistical properties. Additive aggrega-
tion is the most common integration procedure to calculate indices by means of the additive
utility model [54,86,110]. This has two implications, both of which refer to the indicator selec-
tion problem.
Firstly, conditional independence of variables is a prerequisite (see seminal paper from
[111]), although essential criteria on independence and commensurability of indicators are
often disregarded (see Discussion in [112]). Independence is defined by set theory as such that
entities A and B originate from C (i.e. are indicators of C) but share no common subset:
A; B 2 C and A \ B ¼ ; ð2Þ
The set approach allows establishing regional and sectorial filters while assigning indicators
to logically independent entities. Accordingly, any correlation between them will be spurious.
Otherwise, zero conditional and partial correlations between A and B are used to indicate con-
ditional independence (e.g. [113]).
The second aspect of additive aggregation refers to the ‘apples and oranges’ problem [110].
The optimization of the additive utility model as known from consumer theory can be
described as [110,114]
P
UðX1 ; . . . :; Xn Þ ¼ max i wi ui ðXi Þ ð3Þ
where U is the overall utility score obtained from n indicators, and wi is the weight for the util-
ity function ui of indicator Xi. Every indicator Xi has its own value function ui, which in order
to simplify the assessment procedure can be understood as the transformation of the different
measurement scales for Xi into an identical scale for the function U. This process is called nor-
malization (with respect to ui) and scaling or weighting (with respect to wi). Differential scaling
PLOS ONE | DOI:10.1371/journal.pone.0159481 August 10, 2016 9 / 29Assessment of Ecosystem Health
and normalization procedures account for 68% of variability in the performance of environ-
mental indices [115]. Ebert and Welsch [116] analyzed data requirements of different aggrega-
tion methods. Their assessment criterion was the known ordering of ecosystem states which
should be unambiguous in relation to different aggregation methods. As such, additive treat-
ment can only be applied if indicators are fully comparable, i.e. have the same unit measure
and scale. Incommensurable indicators mainly require multiplicative integration under certain
conditions or cannot be integrated at all [116,117].
Assigning weights through expert judgment introduces a source of (un)wanted subjectivity,
intuition and a priori knowledge to the assessment [88,108,117], and some methodologies
strive at reducing the influence of expert judgment in favor of evidence based assessments [55].
If weighting and scoring is applied, the analyzed alternatives can only be evaluated in relation
to each other but not in relation to a specified absolute goal or in terms of trend analysis due to
the ordinal character of resulting figures ([84], 'disputable baseline problem', see [88]). Apply-
ing weights thus necessarily has the meaning of–presumed—substitution rates (trade-offs) and
reflect a value judgment [77,80].
Normalization has to be considered in relation to the indicator aggregation method and
whether data from the same domain (commensurable data) or different domains (incommen-
surable data) are analyzed. Methods such as ranking, normalizing to a range by reference value
or maximum, standardizing to zero mean and unit variance (z-score) or other convenient mea-
sures [54,80,115] imply a normative value judgment [80,117]. Due to element wise normaliza-
tion and pre-processing data with new properties are created (variances, order of indicators,
distributions, see Fig 3), i.e. normalizing to reference value changes the scaling of data from
interval (cardinal) to ratio-scale (ordinal) warranting the use of the geometric rather than the
arithmetic mean in data aggregation [77,116].
In exclusive aggregation with element wise evaluations of indicators, the procedure of ele-
ment wise normalization is acceptable for both commensurable and incommensurable data. In
additive indicator aggregation in accordance to Eq 3, independent element wise normalization
Fig 3. Effects of normalization procedures on data properties. (A) Two different series (X1, X2) with a 10-fold
difference in value, are standardized to zero mean and unit variance (z-score, bold line), which eliminates the
difference between both. (B) Normalizing to range [0,>1] (so-called Ecological Quality Ratios EQR or Contamination
Ratios, resp., where 1 represents the EQR reference condition (vertical line in B)) practically changes the distribution
of X1, X2 from normal to uniform [37,39]. The normalized value 0.5 for both series indicating a 50% probability of
reaching the target eliminates distributional differences between both series since one indicator (narrow curve) had a
real probability of 100% being below. Red line indicates uniform distribution function.
doi:10.1371/journal.pone.0159481.g003
PLOS ONE | DOI:10.1371/journal.pone.0159481 August 10, 2016 10 / 29Assessment of Ecosystem Health
Fig 4. First tier level in MSFD assessments separates means related to phasing-out of pressures from the assessment of ecosystem state.
Numbers refer to chapter 'European Marine Strategy Framework Directive (MFSD)'. Policy requirements need to be considered to adopt the assessment
procedure, and in turn output determines the future policy needs as outlined in the canonical concept of Levin et al. [75].
doi:10.1371/journal.pone.0159481.g004
is not applicable. For indicators from different domains and to create commensurable data, a
domain-generating function is required to generate values within a common domain and to
normalize against a commensurable reference value (see [118]). This can be achieved by appli-
cation of likelihood functions (domain = probability, see Bayesian analysis, this paper), mone-
tary valuation and accounting techniques (domain = economic value, see [69,73]) or
productivity functions [119,120]. Accordingly, comparisons can be made on cardinal scale.
The heuristic approach for holistic assessments
The heuristic approach (hereafter HA, Fig 4) follows the outline of the canonical framework
from Levin et al. [75] for ecosystem-based management including a distinct link to policy
requirements as defined above, here MSFD (see S1 Text), while nesting Wiek and Binder’s [76]
dimensional approach into an ex-ante/ex-post framework as a unit (hereafter EAEPNS). This
combined approach establishes formal interfaces in the ex-ante/ex-post branches to confine
metaphorical influence at the normative level while applying an a posteriori description at the
systemic level by means of a formalized language, i.e. mathematical models as external refer-
ence system. HA development thus comprises five building blocks, i.e. assessment method with
a corresponding normative dimension to link ex-ante modelling as phasing-out of pressures
and ex-post evaluation of indicators of ecosystem health, and within each branch, choice of
assessment type as systemic component, and the method of aggregation of assessment infor-
mation including normalization and target setting as normative procedural component. Essen-
tially new for HA is the development of building blocks in the ex-post branch. HA delivers two
different measures, i.e. the assessment of ecosystem health in the ex-post branch and the model
based outputs in the ex-ante branch.
PLOS ONE | DOI:10.1371/journal.pone.0159481 August 10, 2016 11 / 29Assessment of Ecosystem Health
Detailing building blocks: The ex-ante systemic dimension
The ex-ante branch allows to analyze trade-offs as part of pressure reduction scenarios and
does not need to be unified (see [121]). The multiple pressures in the phasing-out lead to the
concept of causal networks as systemic dimension in the ex-ante branch ([51] with MSFD
example; [89]), which requires the use of comparative tools such as risk assessments [121,122],
ecosystem models [123], multi-criteria-decision-making tools [84] or economic-ecological pro-
duction models [124]. These models allow for accounting for externalities as unwanted side
effects, a basic element in the development of sustainability indices and sustainability assess-
ments [125]. It implies scaling of effects in relation to reference conditions as normative com-
ponent enabling straightforward target setting (e.g. maximum sustainable yield in fisheries
models or gain as relation between regeneration and loss processes in risk models
[120,122,126]) as opposite to un-scaled impact assessments. Scenario modeling is the means by
which multi-dimensionality is introduced into the assessment.
Hence, the ex-ante branch is also the place to incorporate links to other (environmental)
policies. The corresponding utility function can be rewritten as
UðM1 ; . . . :; Mn Þ ¼ max f ðP1 ; . . . ; Pn jY1 ; . . . ; Ym Þ ð4Þ
maximizing the utility from measures Mn expressed as function of pressures Pn under bound-
ary conditions set by policy requirements Ym [122]. It is evident that the solution for U(M) is
dependent on policies Y, so that reaching an overall solution could compromise one part of Y
while satisfying the other. This means that paradigmatic solutions like one-out-all-out cannot
apply to the ex-ante branch (for one-out-all-out see S1 Text).
Detailing building blocks: The ex-post systemic dimension
The HA ex-post assessment of ecosystem health is absolute with a single solution for ecosystem
health following the concept of strong sustainability [22,79], considers selection of independent
indicators in relation to ecosystem variability (functional-holistic) and utility models with
within-domain normalization to aggregate information.
Indicator state at time t of indicator Xi (e.g. concentrations, age, weight, length) depends on
the state at time t-1 plus new data at time t and thus is a time series for which change can be
measured [106,127,128], i.e.
Xi;t ¼ f ðXi;t1 ; dataÞ ð5Þ
so that Xi,t is the mean of observations with error at time t. Each element Xi is assigned the
probability PXi of passing (good environmental status, GES) and of 1- PXi of non-passing (non-
GES) the target value. This probability is 50% when Xi,t reaches the target value (Fig 5).
In multivariate techniques to select indicators, not all variability in the data set is covered by
the selected surrogate variables and they are they change with new data. Time series of indica-
tors are invariant to new data at time t and thus the condition expressed in Eq 5 with a definite
Xi,t-1 is fulfilled.
As normative setting, we consider GES as function of indicators Xi (additive, exclusive)
while applying the relationship from Eq 5.
UGES ¼ f ðXÞ ¼ f ðX1;t1 ; . . . ; Xi;t1 ; dataÞ þ E ð6Þ
Accordingly, UGES comprises present information (data) and prior information, i.e. Xi,t-1, as
well as one error term E denoting utility that would have been obtained from unexplained eco-
system information. Evidently the associative law applies so that Eq 6 inserted into Eq 3 is a
PLOS ONE | DOI:10.1371/journal.pone.0159481 August 10, 2016 12 / 29Assessment of Ecosystem Health
Fig 5. Time trajectory of indicator Xi representing a state indicator. Xi increases in the recent time period
from time tn-1 to time tn and reaches the target value S. The target value S may be pragmatically derived as
some percentile of the time series [129] or from modeling [130]. Time series data have a confidence interval
around the mean so that a probability distribution at any time t is obtained. The mean for normally distributed
data indicates a 50% probability of reaching the target value S.
doi:10.1371/journal.pone.0159481.g005
generalized description of aggregation of information across the selected set of indicators for
all descriptors considered–there is no need to further elaborate on any aggregation hierarchy in
information. Eq 6 can be written as likelihood function of the data, given that GES is reached,
and thus likelihood serves as domain-generating function allowing us to apply Bayesian ratio-
nale. Bayesian methods reckon on all available information, present and past. The ‘data’-part
of Eq 6 represents their present sampling distributions [131], i.e.
LðXjGES; EÞ ¼ LðX1;data jGESÞ LðX2;data jGESÞ . . . LðXi;data jGESÞ ð7Þ
In censored data (here: GES, non-GES), the likelihood function employs the probability dis-
tribution function instead of the density function [132]. We now ask for the overall probability
of GES given the data and the available prior information Xi,t-1 from Eq 6, and consider Bayes’
theorem, where the probability of A and B is the conditional probability of A given B times the
probability of B, i.e. conditional dependence between indicator and GES,
PðA; BÞ ¼ PðAjBÞ PðBÞ ; and ð8Þ
PðA; BÞ
PðBjAÞ ¼ ð9Þ
PðAÞ
Inserting Eq 8 into Eq 9 yields:
PðAjBÞ PðBÞ PðAjBl Þ PðBl Þ
PðBjAÞ ¼ ¼P ð10Þ
PðAÞ l PðAjBl Þ PðBl Þ
The formulation of the denominator is a reformulation of Eq 8, considering the probability
for A as sum of shared sets of A in conjunction with all hypotheses Bl. This requires hypotheses
PLOS ONE | DOI:10.1371/journal.pone.0159481 August 10, 2016 13 / 29Assessment of Ecosystem Health
Fig 6. The probabilistic approach for assessing ecosystem health exemplified by means of two indicators. A 50% probability of reaching good
environmental status (GES) is indicated by the horizontal lines, x-axis is time, grey area indicates state space with high probability of reaching GES. (A)
Gradual approach towards GES, (B) GES state in variable environment, and (C) early warning as one indicator (X1) consistently scores low (or high).
doi:10.1371/journal.pone.0159481.g006
Bl to be exclusive, which is true for the two possible states of GES and non-GES,
LðXdata jGES; EÞ prior ðGESÞ
PðGESjX; EÞ ¼ ð11Þ
LðXdata jGES; EÞ prior ðGESÞ þ LðXdata jnon GES; EÞ prior ðnon GESÞ
The consideration of prior information renders Eq 11 trend-sensitive in that it 'remembers'
the former state and the denominator is the within-domain normalization of Eq 3. GES is now
described as probability of reaching GES given the data representing a certain amount of eco-
system variability and dynamics. The indication of probability of GES from Eq 11 provides a
flexible alternative to either-or solutions as obtained from exclusive assessment methodologies,
in particular in a stage when the system is improving but has not reached GES (see Fig 6A).
The increase of objectivity by reducing the number of indicators to obtain a probability
measure of GES does not necessarily lead to a reduction of user-friendliness due to an increased
level of abstraction which has been argued in the literature [94,133]. Eq 7 shows that GES can
always be traced back to the individual indicators and their likelihoods and the corresponding
indicator groups and thus the degree of variability explained by these selected indicators in the
indicator space (S1 Appendix).
HA in relation to existing assessment methodologies and policy
frameworks
European Marine Strategy Framework Directive (MSFD)
The goal of MSFD is to attain ecosystem health by means of good environmental status (GES)
in EU marine waters by 2020. At European Commission level, this is understood as a yet unde-
fined combination of indicators into one measure of GES [52,59,104]. Specifications of the
MSFD as detailed in the respective legal documents (S1 Text) indicate that a deconstructing
structural assessments type is pursued based on 11 descriptors of ecosystem integrity (S1
Table), with two specific forms of policy measures, i.e. one related to assessing ecosystem and
the other related to a remediation of human pressures. Nineteen assessment methods have
been proposed to date for MSFD assessments (S2 Table), based on 56 generic indicators which
PLOS ONE | DOI:10.1371/journal.pone.0159481 August 10, 2016 14 / 29Assessment of Ecosystem Health
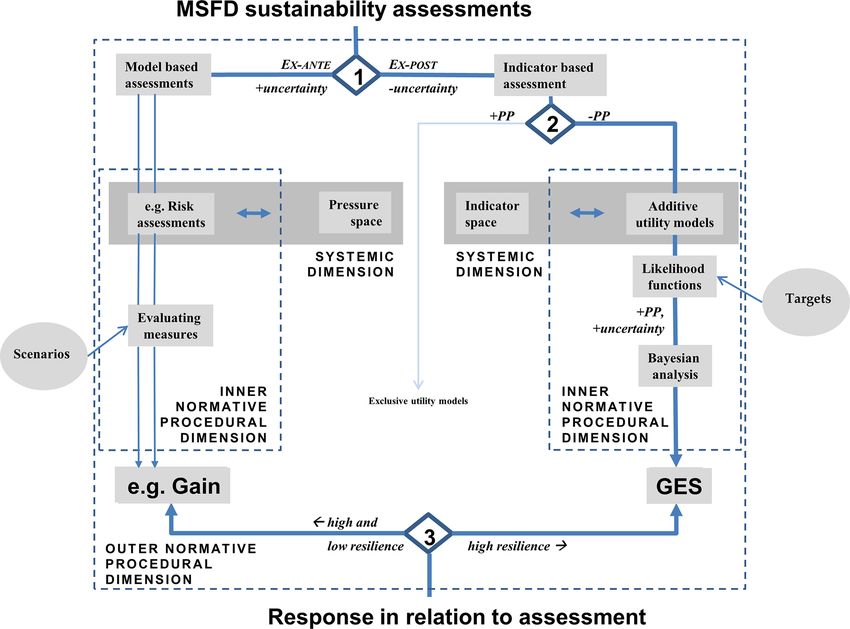
Fig 7. Detailed assessment tree following the EAEPNS structure for HA sustainability assessments to indicate good-environmental-status (GES)
under the Marine Strategy Framework Directive (MSFD). Steps 1–3 explained in text, steps 1 and 3 refer also to Fig 4. Circles indicate external normative
inputs. OOAO–one-out-all-out, + or -PP–preserving or abandoning the precautionary principle.
doi:10.1371/journal.pone.0159481.g007
have been specified to 557 indicators at species and habitat level [134]. Mainly mixed concepts
are advocated, with exclusive aggregation for pressure and additive aggregation for state indica-
tors but without guidance how to achieve the overall assessment. The method for the exclusive
assessment is one-out-all-out (OOAO, see S1 Text).
HA resembles the basic structure of the MSFD, i.e. the assessment of GES in the ex-post
branch and the model based outputs in the ex-ante branch (Fig 7 step 1). The difference
between ex-ante and ex-post assessments indicates system resilience and is the key to adaptive
management. For each ecosystem component, a respective succession-time trajectory has to be
anticipated [122], so that the ex-ante assessment will apply to features with both high (rapid
recovery) and low resilience (slow recovery), whereas the ex-post assessment will best apply to
features that are very responsive to changes of pressures (see [41]). The potential of combining
both approaches for MSFD purposes was recognized, when stating that risk based and indica-
tor based assessments could be applied to pressure and state descriptors differentially [51,104].
PLOS ONE | DOI:10.1371/journal.pone.0159481 August 10, 2016 15 / 29Assessment of Ecosystem Health
The systemic dimension identifies the relevant pressures and indicators for each of the
branches, either in terms of causal networks of pressure relationships (pressure space) or in
terms of the analysis indicator space to select indicators based on the criteria of independence
and ecosystem variability they represent (a posteriori selection). They can be linked to a hierar-
chical concept, but this is not essential for the assessment. The selected indicators receive no
particular weighting.
At step 2 (Fig 7), the treatment of uncertainty determines whether exclusive or additive
assessment methods are chosen. Exclusive assessments (e.g. OOAO) are non-reductionist pre-
cautionary tools and thus try to incorporate indicator information as much as possible with
high costs of implementation [78]. The probability of rejecting a true GES state as incorrect is
high (Eq 1, type II error). This does not apply to additive models with a subset of conditionally
independent indicators. In additive models, the precautionary principle is re-introduced by
means of precautionary target setting in the likelihood function, i.e. targets can be developed to
be either disturbance friendly or environmentally friendly, i.e. precautionary (see [135]).
The Bayesian model (Eq 11) provides a probability value of reaching GES, now integrating
uncertainty and PP. The inclusion of prior information in the Bayesian model enables easy
tracking of incremental changes in selected indicator ensembles ranging from 0% to 100% (Fig
6A). Accounting for subtle changes in ecosystem state and trend information is one of the key
challenges in ecosystem based management [59,136].
The same GES probability (Fig 6B) can be obtained by different combinations of likelihoods
from the individual indicators (S1 Appendix). Thus, indicators are allowed to vary within a
given range to account for stochastic variability and short-term perturbations in ecosystem
properties. This is consistent with methods that account for an allowable range of indicator val-
ues [86,137] and the state space approach to evaluate ecosystem health [41]. In Eq 7, consis-
tently under- or over-scoring in likelihoods over a certain period of specific indicators would
indicate persistent changes in certain ecosystem components while not in others. This would
allow to install an early warning system ([138], see Fig 6C). Both, the capability to deal with
unequal indicator probabilities and the buffer towards ecosystem variability equip the Bayesian
model with two realistic features to assess ecosystem state.
OSPAR, HELCOM and Water Framework Directive (WFD): A worked
example
Assessments undertaken by regional conventions OSPAR and HELCOM and the European
Water Framework Directive screened with regards to HA building blocks of assessment type,
assessment method and indicator aggregation and normalization indicate significant differ-
ences in relation to HA (Fig 8, S3 Table). OSPAR, HELCOM and WFD apply the deconstruc-
tive-structural assessment type with a priori selection of indicators, i.e. the amount of
ecosystem information contained in these assessments is unknown. Only one methodology
comprises an ex-ante/ex-post structure, i.e. the HELCOM ecosystem assessment HOLAS (see
Fig 1). OSPAR and the WFD apply indicator-based assessments, although OSPAR assessments
include trends of ecosystem states and pressures as parameters in the ex-post assessment,
based on expert judgment rather than detailed trend modelling.
With regards to aggregation methods, WFD applies exclusive aggregation (one-out-all-out).
HOLAS applies a combination of additive and exclusive indicator aggregation without consid-
ering the associated statistical problems, and weighting by means of expert judgment. HOLAS
and WFD both undertake between-domain normalization with subsequent changes of the
properties of the input variables (see Fig 3). OSPAR assessments are different in that they apply
qualitative, i.e. narrative aggregation without any normalization of the time series data, so that
PLOS ONE | DOI:10.1371/journal.pone.0159481 August 10, 2016 16 / 29Assessment of Ecosystem Health
Fig 8. Decision tree of existing methodologies for assessing ecosystem health and the heuristic approach (HA). Screening is undertaken with
respect to building blocks of the ex-post heuristic approach. Assessment methodologies are described in S3 Table. HOLAS–Holistic Assessment for the
Baltic Sea, WFD–Water Framework Directive assessments, OSPAR–OSPAR ecosystem assessments
doi:10.1371/journal.pone.0159481.g008
their statistical properties are maintained [55]. A first holistic assessment approach, i.e. the
‘Utrecht Workshop’ methodology, applying exclusive aggregation methods is considered pre-
liminary [55,62].
A worked example for HA based on OSPAR assessments reveals (S1 Appendix) that HA
cannot be applied to existing assessment frameworks without difficulties. OSPAR assessments
are based on Ecological Quality objectives (EcoQO) which provide a link between human activ-
ities and impacts on biodiversity, but also specify the desired state of an ecological component
or mechanism [55,139]. This would allow to consider EcoQOs within a PSR framework, but
since PSR relationships are not always clear [139], also as part of an indicator-based ex-post
assessment (see S3 Table). In line with the latter, the southern North Sea with the adjacent
Wadden Sea area is one of the few regions within the OSPAR area to have sufficient data
PLOS ONE | DOI:10.1371/journal.pone.0159481 August 10, 2016 17 / 29Assessment of Ecosystem Health
Table 2. Worked example for OSPAR EcoQOs for the southern North Sea based on two EcoQO elements, LFI and ppDDE (Trischen). Explained var-
iance in simulations not indicated. Data and calculations in S1 Appendix.
Model specification Likelihood GES Likelihood GES Explained ecosystem
2007 2008 variance
Real values 2007 and 2008; prior 2007 = 0.01Assessment of Ecosystem Health
influences are minimized: an ex-ante/ex-post framework as outer normative-procedural
dimension, and inner normative-procedural and systemic dimensions for each of the branches
(EAEPNS). The systemic dimensions in each of the branches provide a built-in check of system
variability. Thus the basic difference between deconstructive-structural assessments and HA
may be seen in the treatment of explained system information, which in HA is the variance
model embedded in the additive utility function (Eq 6) or uncertainty in risk models.
HA employs two metaphors. The metaphor in the functional-holistic assessment is the eco-
system as entity. This metaphor is inconsequential, since the additive utility model is open and
the only basis to select indicators in the ex-post branch is their non-redundant information con-
tents retrieved out of observable system dynamics: If a system consisted of two or more indepen-
dent subsystems, this would be revealed in the a posteriori analysis and a respective change in the
indicator portfolio (see worked example). In the same way HA is open to extended concepts inte-
grating health and environmental impact assessments (i.e. HIA/EIA, [140,141]), leading to more
indicators in the ex-post branch and respective pressure chains in the ex-ante branch. The second
metaphor in ecosystem health implies that there is a certain properly measurable ecosystem state,
for which a reference level exists for target setting. This is challenged by the view, that ecosystems
are dynamic self-organizing adaptive systems [48,63]. Intrinsic ecosystem dynamics can lead to
self-organized criticality, generating new structures in the ecosystem so that envisaged gradual
changes in ecosystem properties (Fig 6A) are replaced by abrupt changes, i.e. ‘tipping points’
[63]. Management of systems with changing stability conditions needs adaptive target setting
[64], which can be accounted for in the target setting procedure, but not necessarily is a matter of
changing the assessment structure (see Fig 6C).
HA as methodology
The most palpable element of HA is the building block containing the ex-ante/ex-post frame-
work with the associated inner normative procedural and systemic dimensions of each branch
(EAEPNS framework). It provides a means for translation of a policy aim into a scientific tool,
capable of adaptive management and the analysis of policy scenarios. Mee et al. [78] present a
similar two pillar approach for comprehensive management of human activities that reflects
the ex-ante/ex-post part of EAEPNS, addressing in particular the different behavior of slow
and fast variables. However, in most publications on ecosystem health assessments, the distinc-
tion between parallel ex-ante and ex-post assessments is not made in favor of linear schemes of
increasing complexity from indicator based assessment to model based assessments [35,47].
The Ocean Health Index [10] can be seen in an intermediate position, combining modeling
and indicator assessments in one index. It models ecosystem state as mean of present state and
future prospects, including a trend factor and the difference between pressures and resilience
and thus in part resembles the structure in risk models (but difference approach [10] vs ratio
approach [120,122,126]).
The separation into two branches is essential to provide an ex-post ecosystem index under
the concept of strong sustainability, whereas ex-ante assessments in particular tend to provide
indices under weak sustainability (in [77]). As explained earlier, the choice between weak and
strong sustainability determines the choice of assessments in the outer normative-procedural
dimension [69]. The inclusion of resilience for 'slow variables’ is the probable difference to
actively adaptive management schemes as outlined by Linkov et al. [84],where modeling,
implementation of measures and monitoring are treated as subsequent steps which requires an
instant response of the managed system, but would be insufficient to treat 'slow variables'.
In both branches valued metaphoric expressions were transformed and replaced by sys-
temic, algebraic contents. In HA, the normative element in setting up a model is further
PLOS ONE | DOI:10.1371/journal.pone.0159481 August 10, 2016 19 / 29You can also read