Frasers Centrepoint Trust - Business Updates for the Third Quarter ended 30 June 2022 26 July 2022 - Frasers Property
←
→
Page content transcription
If your browser does not render page correctly, please read the page content below

Frasers Centrepoint Trust
Business Updates for the Third Quarter ended 30 June 2022
26 July 2022

                                                            Tampines 1, Singapore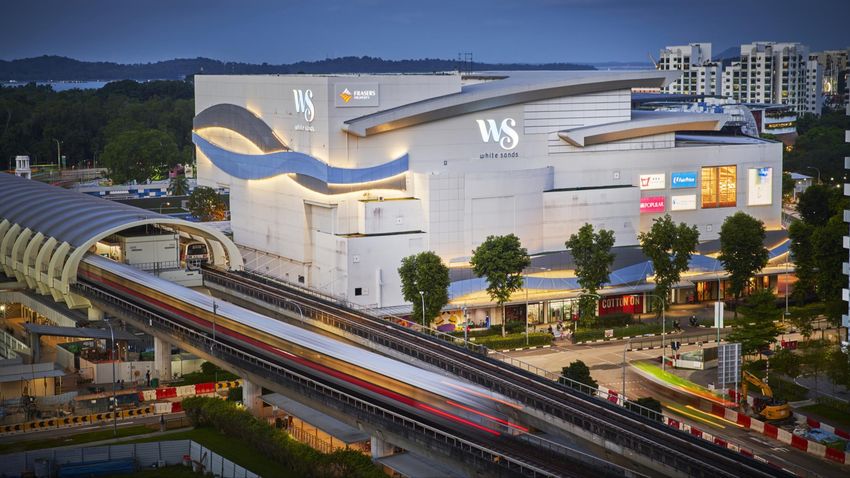
Important Notice
• Certain statements in this Presentation constitute “forward-looking statements”, including forward-looking financial information. Such forward-looking statement and
  financial information involve known and unknown risks, uncertainties and other factors which may cause the actual results, performance or achievements of FCT or the
  Manager, or industry results, to be materially different from any future results, performance or achievements expressed or implied by such forward-looking statements
  and financial information. Such forward-looking statements and financial information are based on numerous assumptions regarding the Manager’s present and future
  business strategies and the environment in which FCT or the Manager will operate in the future. Because these statements and financial information reflect the
  Manager’s current views concerning future events, these statements and financial information necessarily involve risks, uncertainties and assumptions. Actual future
  performance could differ materially from these forward-looking statements and financial information.
• The Manager expressly disclaims any obligation or undertaking to release publicly any updates or revisions to any forward-looking statement or financial information
  contained in this Presentation to reflect any change in the Manager’s expectations with regard thereto or any change in events, conditions or circumstances on which
  any such statement or information is based, subject to compliance with all applicable laws and regulations and/or the rules of the SGX-ST and/or any other regulatory or
  supervisory body or agency. The value of Units in FCT and the income derived from them may fall as well as rise. The Units in FCT are not obligations of, deposits in,
  or guaranteed by, the Manager or any of their affiliates. An investment in the Units in FCT is subject to investment risks, including the possible loss of the principal
  amount invested. Unitholders of FCT should note that they have no right to request the Manager to redeem their Units while the Units are listed. It is intended that
  Unitholders of FCT may only deal in their Units through trading on the SGX-ST. Listing of the Units on the SGX-ST does not guarantee a liquid market for the Units.
• This Presentation contains certain information with respect to the trade sectors of FCT’s tenants. The Manager has determined the trade sectors in which FCT’s tenants
  are primarily involved based on the Manager’s general understanding of the business activities conducted by such tenants. The Manager’s knowledge of the business
  activities of FCT’s tenants is necessarily limited and such tenants may conduct business activities that are in addition to, or different from, those shown herein.
• This Presentation is for information only and does not constitute an invitation or offer to acquire, purchase or subscribe for any securities of FCT. The past performance
  of FCT and the Manager is not necessarily indicative of the future performance of FCT and the Manager.
• This Presentation includes market and industry data and forecast that have been obtained from internal survey, reports and studies, where appropriate, as well as
  market research, publicly available information and industry publications. Industry publications, surveys and forecasts generally state that the information they contain
  has been obtained from sources believed to be reliable, but there can be no assurance as to the accuracy or completeness of such included information. While the
  Manager has taken reasonable steps to ensure that the information is extracted accurately and in its proper context, the Manager has not independently verified any of
  the data from third party sources or ascertained the underlying economic assumptions relied upon therein.
• This advertisement has not been reviewed by the Monetary Authority of Singapore.

We are Frasers Property                                                                                                                                                        2
Contents

 Sections
 1.     3Q22 highlights          page 4
 2.     Financial position       page 6
 3.     Portfolio performance    page 8
 4.     Summary                 page 18
 5.     Appendix                page 20

We are Frasers Property                   3
3Q22 highlights

                Stable occupancy, healthy leasing demand                 Prudent hedging strategies in place
                ▪     Retail portfolio committed occupancy eased         ▪   69% of total borrowings are on fixed
                      slightly from last quarter largely due to pre-         interest rates.
                      termination by an anchor tenant, but maintained    ▪   Increase in portfolio electricity costs
                      at healthy 97.1%.                                      mitigated by in-place hedging which
                ▪     Continued focus on refreshing and                      would only progressively expire over
                      strengthening of retail offering to drive retail       the next three quarters.
                      performance and ensure relevance to shoppers.
                                                                         Improving ESG
                3Q22 shopper traffic and tenants’ sale up y-o-y
                                                                         •   MSCI ESG upgraded FCT’s ESG rating
                ▪     Retail portfolio tenants’ sales up 23% y-o-y,          to “A” from “BBB” on 26 May 2022.
                      average ~10% above pre-COVID levels.
                ▪     Shopper traffic up 32% y-o-y at ~79% of pre-
                      COVID levels.

We are Frasers Property                                                                                                4
Market environment
 Suburban retail rents remained firm during the pandemic and expected to strengthen

 ▪ The Ministry of Trade and Industry (MTI) maintains Singapore’s 2022                                                                                       Prime retail rents by submarkets (CBRE)
   GDP growth at 3% to 5%1. Singapore’s core inflation rose to 4.4% in
   June 2022, highest since November 2008 2.                                                                                                                 S$ psf per month

 ▪ Singapore retail sales index (excluding motor sales) for May 2022                                                                                                                             Orchard Prime
                                                                                                                                                                                                 Suburban Prime
   was ▲ 22.6% y-o-y, sales of F&B services was ▲ 40.1% y-o-y3.                                                                                              40.00

 ▪ CBRE4:                                                                                                                                                                                                                      34.20
                                                                                                                                                             35.00
      › Islandwide retail rents stabilised for the third consecutive                                                                                                                                                           30.20
       quarter: Suburban prime rents ▲0.2% q-o-q and ▲ 1.3% y-o-y,                                                                                           30.00
       while Orchard Road prime rents were flat q-o-q and ▼1.0% y-o-y.
                                                                                                                                                             25.00
      › Manpower shortage and rising costs temper retailers’ optimism.
      › Nonetheless, with below-historical average new retail supply in the                                                                                  20.00
       next few years, CBRE Research expects a more meaningful retail                                                                                                       Q1         Q2         Q3         Q4      Q1   Q2

       rent recovery after 2nd half of 2022.                                                                                                                                              2021                        2022

 1.    “MTI Maintains 2022 GDP Growth Forecast at “3.0 to 5.0 Per Cent”, MTI, 25 May 2022. https://www.mti.gov.sg/Newsroom/Press-Releases/2022/05/MTI-Maintains-2022-GDP-Growth-Forecast-at-3_0-to-5_0-Per-Cent
 2.    “Singapore’s core inflation rises to 4.4% in June, highest since November 2008”, ChannelNewsAsia, 25 July 2022. https://www.channelnewsasia.com/business/singapore-core-inflation-june-2022-44-cent-2833491
 3.    “Monthly Retail Sales Index and Food & Beverage Services Index”, Department of Statistics Singapore, May 2022. https://www.singstat.gov.sg/-/media/files/news/mrsmay2022.ashx
 4.    Singapore Figures Q2 2022, CBRE Research, 13 July 2022. https://www.cbre.com.sg/insights/figures/singapore-figures-q2-2022
We are Frasers Property                                                                                                                                                                                                                5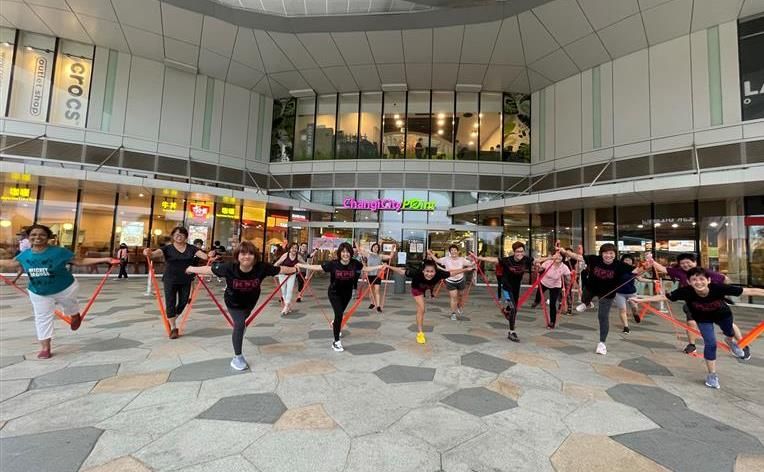
Financial position

                     Waterway Point, Singapore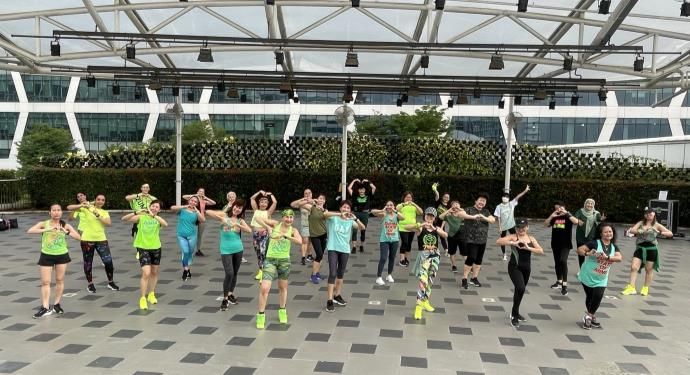
•
 •
 •
                                                                                  30 Jun 22                31 Mar 22                 Debt Maturity Profile as at 30 June 2022
                                                                                                                                     Total borrowing: S$1,858 million
     Average debt maturity (years)                                                    2.31                      2.09                 Figures in parentheses denote the debt amount of that                                   MTN
                                                                                                                                     FY as a percentage of total borrowing
                                                                                                                                                                                                                             Secured bank borrowings
     Aggregate        leverage3                                                      33.9%                    33.3%
                                                                                                                                                                                                                             Unsecured bank borrowings
                                                                                                                                                                  S$479 million            S$519 million
     Adjusted ICR /ICR              (times)4                                          5.17                      5.72                                                                         (27.9%)
                                                                                                                                                                    (25.8%)

     % of debt hedged to fixed rate interest                                          69%                       68%                      S$391 million                                             70
                                                                                                                                           (21.0%)

     Avg cost of debt (all-in)                                                        2.4%                     2.2%                                                                                                                          S$250 million
                                                                                                                                                                         360
                                                                                                                                                                                                                    S$219 million              (13.5%)
                                                                                                                                                 200
                                                                                         S$573.9 million                                                                                                              (11.8%)
     Undrawn RCFs                                                                                                                                                                                 449
                                                                                       as at 30 June 2022
                                                                                                                                                                                                                           219                      250
                                                                                                                                                 191
     Credit rating (S&P)                                                                     BBB/Stable                                                                  119

     Credit rating (Moody’s)                                                                Baa2/Stable                                      FY2023                   FY2024                   FY2025                  FY2026                   FY2027

 1. The green loans and the total borrowings include FCT’s 40% proportionate share of borrowing in SST.
 2. SOR/SORA refers to Swap Offer Rate/Singapore Overnight Rate Average. Based on the portion of borrowings which are unhedged as at 30 June 2022.
 3. In accordance with the Property Funds Appendix, aggregate leverage includes FCT’s 40% proportionate share of deposited property value and borrowing in SST.
 4. Ratio is calculated by dividing the trailing 12 months earnings before interest, tax, depreciation and amortisation (excluding effects of any fair value changes of derivatives and investment properties, and foreign exchange translation), by the
    trailing 12 months interest expense and borrowing-related fees as defined in the Code on Collective Investment Schemes issued by the Monetary Authority of Singapore. As the Group has not issued any hybrid securities, Adjusted ICR is
    identical to the ICR of the Group.
We are Frasers Property                                                                                                                                                                                                                                      7
Portfolio performance

                        White Sands, Singapore
Retail portfolio committed occupancy remains healthy at 97.1%
Retail sentiment has improved with re-opening although retailers remain cautious
  • Marginal drop in portfolio occupancy from last quarter due mainly to pre-termination by an anchor tenant;
    advanced negotiations ongoing with replacement tenants for this space.
  • Post-pandemic re-opening has improved retailer sentiment and supported leasing demand.

Any discrepancies between individual amount and the aggregate is due to rounding.

We are Frasers Property                                                                                         9
3Q22 Tenants’ sales continue to outperform pre-COVID levels
 Strong sales conversion despite lagging recovery in footfall

 • 3Q22 portfolio tenants’ sales up 23% y-o-y, led by Tampines 1 and Waterway Point.
 • 3Q22 retail portfolio shopper traffic was up 32% y-o-y; all malls recorded double-digit y-o-y improvements.
 • Sundry & Service, Supermarket & Grocers, Beauty & Healthcare, Leisure and Entertainment and F&B
   enjoyed stronger sales. F&B sales growth was led by Restaurants and Cafes.

      Note: The Government lifted most of the COVID-related group size limit and safe distancing measures, effective 26 April
      2022. Source: https://www.moh.gov.sg/news-highlights/details/further-easing-of-community-and-border-measures.
We are Frasers Property                                                                                                         10
Bulk of expiring leases have been committed
Only 5.3% expiring leases (by GRI) remain in 4Q22
Lease Expiries1,2 in FY2022 Number of leases Lease area expiring as % of leased area of as % of total GRI of
(As at 30 June 2022) expiring (sq ft) property property
Causeway Point 12 20,041 4.8% 5.1%
Waterway Point 10 14,397 3.9% 3.5%
Tampines 1 9 13,393 5.1% 4.5%
3
Northpoint City North Wing 5 4,951 2.4% 2.9%
Tiong Bahru Plaza 13 19,662 9.3% 9.4%
Century Square 8 3,966 2.4% 3.0%
Changi City Point 7 9,265 5.3% 5.4%
Hougang Mall 7 17,857 12.0% 10.4%
White Sands 12 9,328 7.6% 8.0%
FCT Retail Portfolio 83 112,860 5.4% 5.3%
Central Plaza nil nil 0.0% 0.0%
FCT Portfolio 83 112,860 5.1% 5.2%
1. Calculations exclude vacant floor area.
2. Based on committed leases for expiries.
3. Includes Yishun 10 Retail Podium.
We are Frasers Property 11Well-spread lease maturity profile
No significant concentration risk
Lease expiry profile of FCT retail portfolio as % of Total GRI
WALE @ 30 Jun 2022
• 1.85 years by NLA (2Q22: 1.87 years)
• 1.78 years by GRI (2Q22: 1.78 years) 32.9%
34.4%
30.1%
28.3%
■ Expiries as at 31 Mar 2022
22.5%
■ Expiries as at 30 Jun 2022
16.6%
15.1%
5.3% 4.7% 5.2%
2.5% 2.5%
Lease expiry as at FY2027
FY2022 FY2023 FY2024 FY2025 FY2026 Total
30 June 2022 and beyond
Number of leases expiring 83 484 499 370 31 11 1,478
Leased area expiring (sq ft) 112,860 623,049 688,015 411,805 151,944 95,670 2,083,343
Expiries as % of total leased area 5.4% 29.9% 33.0% 19.8% 7.3% 4.6% 100.0%
Expiries as % of total GRI 5.3% 30.1% 34.4% 22.5% 5.2% 2.5% 100.0%
We are Frasers Property 12Introduced a diverse slate of Supermarket and Grocery stores in FY22
Continuous leasing effort to curate and refresh retail offerings
Fairprice Finest - Extensive range of Halal-certified products, with
authentic fresh spice blends and coconut grating machine on top of
store exclusive snacks and premium meat cuts.
We also welcomed unpackaged organic goods store Scoop
Wholefoods, Japanese discount store Don Don Donki at two of our
malls, and Chinese specialty goods Kun Hai Store @ Taobao.
Fairprice Finest– Causeway Point
Scoop Wholefoods – Waterway Point Don Don Donki – Waterway Point Don Don Donki – Tampines 1 Kun Hai Store @ Taobao – Tampines 1
Images source: From respective Facebook.
We are Frasers Property 13New-to-Frasers F&B offerings
Continuous leasing effort to curate and refresh retail offerings
Rrooll – Causeway Point Isshin Machi – Waterway Point Huggs Coffee – Changi City Point Baker’s Brew Studio – Causeway Point
GOPIZZA – Century Square Yakiniku Ok! – White Sands Nespresso – Waterway Point The Original Vadai – Century Square
Images source: From respective Facebook
We are Frasers Property 14New-to-Frasers Beauty & Fashion offerings
Continuous leasing effort to curate and refresh retail offerings
High quality coloured contact lenses and false lashes at
byCaxs Doll Parlour; skincare product Kiehl’s. Highly
raved about intimate wear I’M IN also opened their 3rd
outlet at Tampines 1. Other new-to-Frasers brands
include sporting goods store Sports Factory and quality
leather products store Sanchō.
byCaxs Doll Parlour – Tampines 1 Kiehl’s – Waterway Point
I’M IN – Tampines 1 Sports Factory – Century Square Sanchō – Changi City Point
Images source: From respective Facebook.
We are Frasers Property 15Revamped wet play area and movie blockbuster screening
Continuous effort to upgrade amenities and curate marketing program
A roarsome time awaits
Causeway Point’s new dino-themed wet play area at
L7 opened to the public in Jun 22, engaging children
with high energy and imaginative play.
It’s glamping – Jurassic Style!
Movie blockbuster tie-up at
Waterway Point; engaging
shoppers via a scavenger hunt
and exclusive glamping
experience with minimum
spending.
We are Frasers Property 16Workout classes and beach day
Continuous effort to curate marketing programs for shoppers
Fitness classes
Heart-pumping fitness classes such
as stretch band and Zumba held at
Changi City Point for shoppers.
Indoor Sandy Beach Day
Sandy beach day at White Sands
during the June holidays, creating
memorable moment with families at
our malls.
We are Frasers Property 17Summary
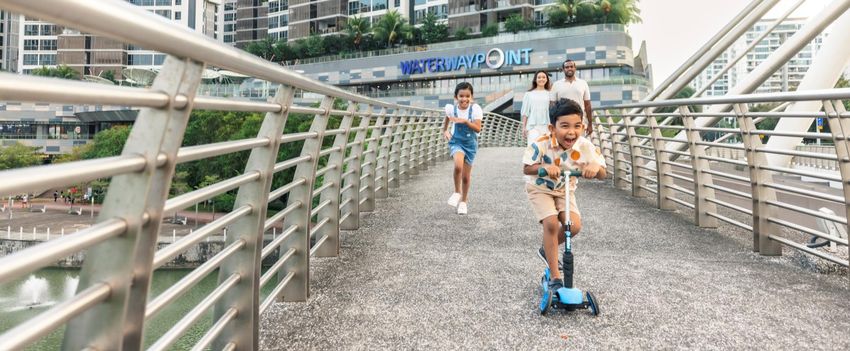
Waterway Point, SingaporeRiding on positive momentum
3Q22 performance Strategy
• Portfolio occupancy stable at 97.1%. • Proactive property and asset management.
• Healthy financial position with ample financial • Drive omnichannel to increase sales productivity.
flexibility and debt headroom. • Focus on sustainability, green building initiatives.
• Well-positioned in an improving leasing environment. • Leverage technology to drive efficiencies.
• Low lease renewal risk with 5.3% expiring leases (by • Explore acquisition and AEI opportunities.
GRI) remaining in 4Q22.
Outlook Market environment
• Rising cost pressures and interest rates pose • Strong recovery in retail sales (excluding motor sales)
challenges; will continue mitigating measures through and sales of F&B services.
hedging strategies and active cost management. • Retail rents stable now, poised to grow with tight future
• Revenue upside from recovery in atrium rental income / retail supply.
car park income / advertisement; better GTO income
arising from improved tenants’ sales; and improvement
in operating factors.
We are Frasers Property 19Appendix
Definition of terms used in this presentation
   •   3Q21: 3rd quarter ended 30 June 2021                              •   MSCI: Morgan Stanley Capital International
   •   3Q22:   3rd   quarter ended 30 June 2022                          •   MTI: Ministry of Trade and Industry, Singapore
   •   Adjusted ICR: Adjusted interest coverage ratio                    •   NAV: Net asset value
   •   AEI: Asset Enhancement Initiative                                 •   NLA: Net Lettable Area
   •   BCA: Building and Construction Authority                          •   NPI: Net Property Income
   •   COVID-19: Coronavirus disease                                     •   NTA: Net Tangible Value
   •   CSFS: Community/Sports Facilities Scheme
                                                                         •   ppt: percentage-point
   •   ESG: Environmental, Social and Governance
                                                                         •   q-o-q: quarter-on-quarter
   •   F&B: Food and Beverage
                                                                         •   RCF: Revolving credit facility
   •   FCT: Frasers Centrepoint Trust
                                                                         •   REIT: Real Estate Investment Trust
   •   FPL: Frasers Property Limited, the sponsor of FCT
                                                                         •   Retail Portfolio: Includes all retail malls in FCT’s investment portfolio, and
   •   FPR: Frasers Property Retail
                                                                             includes Waterway Point (40%-owned by FCT), but excludes Central
   •   GFA: Gross floor area
                                                                             Plaza which is an office property
   •   GRI: Gross Rental Income
                                                                         •   SOR/SORA: Swap Offer Rate/Singapore Overnight Rate Average
   •   Group: Refers to Frasers Centrepoint Trust and its subsidiaries
                                                                         •   Square Feet: sq ft
   •   GTO: Gross Turnover rent
                                                                         •   Square Meter: sqm
   •   ICR: Interest Coverage Ratio
   •   Moody’s: Moody’s Investors Service (credit rating agency)         •   SST: Sapphire Star Trust, which holds Waterway Point; it is a joint venture
                                                                             of FCT
   •   MTN: Medium Term Notes under FCT’s S$1 billion multi-
       currency MTN programme or the S$3 billion multi-currency          •   WALE: Weighted Average Lease Expiry
       EMTN programme, as the case may be                                •   y-o-y: year-on-year, refers to the comparison with the same period in the
                                                                             previous year

We are Frasers Property                                                                                                                                       21
◆ Market capitalisation of approximately S$3.9 billion1, among the top-10 largest SREITs by market capitalisation.
◆ Retail portfolio comprises malls with large catchment and connectivity to public transport.
◆ All malls are well-located on/next to MRT stations; enjoy healthy occupancy and high recurring shopper traffic.
◆ Portfolio properties serve a combined 2.6 million2 catchment population.
Retail NLA by property
S$6.1 Asset Under
billion Management Hougang Mall White Sands
7% 7%
Well-located
9 suburban retail Changi City Point Causeway
Point
malls 9%
19%
2.3m Retail Portfolio Century Square
Sq ft Net Lettable Area 9% Total
2.3m
sq ft
>1,400 Retail leases Tiong Bahu
Plaza
Waterway
Point
10% 17%
Retail portfolio
97.1% committed Northpoint City North Tampines 1
As at 30 Jun 2022 Wing (incl. Yishun 10) 12%
occupancy 10%
1.Based on FCT’s closing price of $2.29 on 30 June 2022.
2.Aggregate catchment population within 3km of each property in the portfolio. Population in overlapping areas are only counted once. Source: Cistri, 2021.
We are Frasers Property 22We are Frasers Property 23
Portfolio Overview
 8 out of 9 retail properties rated Green Mark Gold and above, Office property rated Platinum

Causeway Point                                        Waterway Point1                                      Tampines 1                                Northpoint City North Wing2 Tiong Bahru Plaza
◆    GFA: 629,160 sq ft                               ◆   GFA: 542,493 sq ft                               ◆   GFA: 380,898 sq ft                    ◆   GFA: 374,940 sq ft                  ◆   GFA: 294,381 sq ft
◆    NLA: 419,699 sq ft                               ◆   NLA: 389,452 sq ft                               ◆   NLA: 268,514 sq ft                    ◆   NLA: 240,214 sq ft                  ◆   NLA: 214,707 sq ft
◆    BCA Green Mark Platinum                          ◆   BCA Green Mark GoldPlus                          ◆   BCA Green Mark GoldPlus               ◆   BCA Green Mark Gold                 ◆   BCA Green Mark Platinum
                                                                                                                                                         (Northpoint City North Wing only)

Century Square                                       Changi City Point                                     Hougang Mall                              White Sands                             Central Plaza
◆    GFA: 318,614 sq ft                              ◆    GFA: 306,378 sq ft                               ◆   GFA: 232,662 sq ft                    ◆   GFA: 227,244 sq ft                  ◆   GFA: 202,198 sq ft
◆    NLA: 211,282 sq ft                              ◆    NLA: 208,377 sq ft                               ◆   NLA: 165,676 sq ft                    ◆   NLA: 150,375 sq ft                  ◆   NLA: 172,121 sq ft
◆    BCA Green Mark Platinum                         ◆    BCA Green Mark GoldPlus                                                                    ◆   BCA Green Mark Platinum             ◆   BCA Green Mark Platinum
1.    FCT has 40.0% interest in the ownership and voting rights in a joint venture, Sapphire Star Trust, a private trust that owns Waterway Point.
2.    Includes Yishun 10 retail podium.
Note: NLA figures shown for the properties are as at 30 June 2022 and include areas for CSFS.

We are Frasers Property                                                                                                                                                                                                    24
Essential services 54.4% (by GRI) ◆ FCT’s retail portfolio comprises 54.4% of
Essential services (by GRI).
◆ Essential services comprise necessity
F&B
Non-essential trades like F&B, grocery and services
Services, patronised by shoppers regularly.
45.6% FCT
retail portfolio ◆ Suburban malls generally have higher
trade mix proportion of essential services at about
By GRI 40%2 of NLA, compared to central malls at
20-30%2. FCT’s essential services trade
Services mix by NLA is about 45%.
Supermarket &
Hypermarket
Beauty & Health
1.The groupings of essential and non-essential services are based on Ministry of Trade and Industry’s press release on 21 April 2020. Note that the individual product group
may not align perfectly to the announced Essential Services.
2.Source: Cistri, 2020.
We are Frasers Property 25No. Tenants As % of total NLA As % of total GRI
1 NTUC Fairprice1 5.7% 4.0%
2
2 Kopitiam 3.3% 2.7%
3
3 Breadtalk Group 1.9% 2.3%
4 Dairy Farm Group4 1.4% 1.7%
5 Metro (Private) Limited5 2.8% 1.7%
6
6 Hanbaobao Pte. Ltd. 1.0% 1.6%
7 Courts (Singapore) Pte. Ltd. 1.6% 1.4%
8 Oversea-Chinese Banking Corporation Ltd. 0.7% 1.3%
9 United Overseas Bank Limited 0.7% 1.2%
10 Koufu7 1.1% 1.1%
Total 20.2% 19.0%
Notes:
(1) Includes NTUC FairPrice, FairPrice Finest and Unity Pharmacy.
(2) Operator of Kopitiam food courts, includes Kopitiam, Cantine, Mei Shi Mei Ke and Food Tempo.
(3) Includes Food Republic, Breadtalk, Toast Box, The Foodmarket and Din Tai Fung.
(4) Includes Cold Storage supermarkets, Guardian Pharmacy and 7-Eleven.
(5) Includes Metro Department Store and Clinique Service Centre.
(6) Operator of McDonald’s restaurants.
(7) Includes Cookhouse and R&B 巡茶.
26FCT Retail Portfolio
Trade Classifications
As % of total NLA As % of total GRI
(by order of decreasing % of Total GRI)
Food & Beverage 30.3% 38.1%
Beauty & Healthcare 11.7% 15.0%
Fashion & Accessories 11.8% 11.8%
Sundry & Services 6.0% 8.5%
Supermarket & Grocers 9.9% 6.5%
Information & Technology 2.5% 2.7%
Homeware & Furnishing 3.8% 2.7%
Electrical & Electronics 3.1% 2.5%
Leisure & Entertainment 5.7% 2.4%
Books, Music, Arts & Craft, Hobbies 3.5% 2.3%
Jewellery & Watches 0.8% 2.1%
Sports Apparel & Equipment 2.6% 2.0%
Education 2.6% 1.8%
Department Store 2.8% 1.6%
Vacant 2.9% 0.0%
FCT Retail Portfolio 100.0% 100.0%
Note: Total may not add up to 100% due to rounding differences.
27Inspiring experiences, creating places for good.
You can also read