Flooding Irrigation Weakens the Molecular Ecological Network Complexity of Soil Microbes during the Process of Dryland-to-Paddy Conversion - MDPI
←
→
Page content transcription
If your browser does not render page correctly, please read the page content below

International Journal of
           Environmental Research
           and Public Health

Article
Flooding Irrigation Weakens the Molecular Ecological
Network Complexity of Soil Microbes
during the Process of Dryland-to-Paddy Conversion
Xiaoxiao Li 1 , Qi Zhang 1 , Jing Ma 2 , Yongjun Yang 1 , Yifei Wang 1 and Chen Fu 1,2, *
 1    School of Environment Science and Spatial Informatics, China University of Mining and Technology,
      Xuzhou 221008, Jiangsu, China; lixiaoxiao@cumt.edu.cn (X.L.); zhangqi2019@cumt.edu.cn (Q.Z.);
      y.yang@cumt.edu.cn (Y.Y.); yifeiwang@cumt.com (Y.W.)
 2    Low Carbon Energy Institute, China University of Mining and Technology, Xuzhou 221008, Jiangsu, China;
      jingma2013@cumt.edu.cn
 *    Correspondence: chenfu@cumt.edu.cn; Tel.: +86-516-8388-3501

 Received: 16 December 2019; Accepted: 14 January 2020; Published: 15 January 2020

 Abstract: Irrigation has been applied on a large scale for the improvement of grain yield per hectare and
 production stability. However, the dryland-to-paddy conversion affects the ecological environment
 of areas of long-term dry farming, especially soil microorganisms. Little attention has been paid to
 the changes in microbial communities and the interactions between their populations in this process.
 Therefore, in this paper, the compositions and diversity of soil bacterial and fungal communities were
 explored through a combination of high-throughput sequencing technology and molecular ecological
 network methods using bacterial 16S rRNA and fungal ITS. The results showed that: (1) both the
 abundance and diversity of soil bacteria and fungi decreased in a short time, and the abundance of
 Actinobacteria, Firmicutes and Olpidiomycota varied greatly. (2) Compared to dry land, the modular
 structure of interaction networks and interspecific relationships of bacterial and fungal communities
 in paddy soil were simpler, and the network became more unstable. A cooperative relationship
 dominated in the molecular ecological network of bacteria, while a competitive relationship was
 dominant in the network of fungi. Actinobacteria and Firmicutes were the dominant bacterial species
 in dry land and paddy field, respectively. Ascomycota was dominant in the fungal communities of
 both dry land and paddy field. (3) The change in soil environmental factors, such as pH, electrical
 conductivity (EC), organic matter (OM) and available potassium (AK), directly affected the soil
 microbial community structure, showing a significant correlation (p < 0.05). These environmental
 factors also influenced the dominant microbial species. Microorganisms are the most important link
 in the carbon and nitrogen cycles of soil, and a large-scale dryland-to-paddy conversion may reduce
 the ecological stability of regional soil.

 Keywords: land consolidation; soil microorganism; high-throughput sequencing; molecular ecological
 network; bacterial diversity; land use conversion

1. Introduction
     Land use conversion is an important factor causing global environmental changes [1–4].
Most importantly, the use and management of farmland influences the carbon and nitrogen cycles of
terrestrial ecosystems [5]. The varied utilization mode of farmland has affected the carbon storage
and carbon flux of a regional ecosystem, and the carbon emission caused by this change shows
an important impact on global warming [6–10]. Driven by grain demand and economic benefits, a large
area of rain-fed farmland in semi-humid regions has been converted into irrigated agriculture [11,12].
This conversion not only changes the agricultural farming pattern, but also changes the natural

Int. J. Environ. Res. Public Health 2020, 17, 561; doi:10.3390/ijerph17020561    www.mdpi.com/journal/ijerph
Int. J. Environ. Res. Public Health 2020, 17, 561                                                    2 of 19

cover and properties of underlying surfaces, resulting in changes in soil properties and ecological
processes [8,13]. Furthermore, large-scale living conditions including regional microclimate and
surface runoff will be affected [14]. The large-scale expansion of irrigation agriculture threatens the
security of groundwater resources, intensifies the evaporation from the land surface, aggravates
extreme high-temperature climates in summer, and accelerates changes in global climates [11,15].
For a farmland ecosystem, the conversion from dryland to paddy field destroys the stability of long-term
dry-farming soil, inevitably and subtly affecting the regional ecological environment, especially the
carbon effect [14].
      Microorganisms are the most active component of soil ecosystems [16–19], which participate in
geochemical cycles being the main decomposers and maintainers [20]. Dry land and paddy field are
distinct land use patterns, and paddy field is the main source of agricultural greenhouse gases [21,22],
threatening the global environment. Land use conversion has a significant impact on the soil properties
and environment [7], including the evolution of soil microbial community structure and the carbon and
nitrogen cycles of the ecosystem [23]. Large-scale dryland-to-paddy conversion changes the regional
soil environment [24] and affects the physicochemical characters and biological processes of the soil,
thus leading to great changes in the carbon cycle of farmland. Soil microorganisms are the engines
of the carbon and nitrogen cycles [25–27]. Soil microbial community structure controls the carbon
and nitrogen transformation in an ecosystem through participating in the decomposition of organic
matter and formation of humus [27–30]. Soil microorganisms can rapidly respond to environmental
changes, while microbial structure and abundance can be used as the important indicator to assess the
soil quality [30]. The interactions between soil microorganisms and the collinear relationships between
microorganisms and the environment can be clarified by molecular ecological network analysis [31–34],
which provides a new way to reveal the stability and complexity of ecological processes and ecosystem
functions [35–39]. Zhou et al. reported that in an environment with an elevated CO2 level, the molecular
ecological networks of soil microorganisms changed to a great extent, and the interactions between
different populations were significantly changed [40]. Liu et al. analyzed the molecular ecological
network structure of microbial fungi in potato farmland soil, and found that the network structures,
topological properties and key species of low-yield and high-yield soils were significantly different [41].
However, the changes in soil microbial molecular ecological network during the land use conversion
process from dryland to paddy field, as one of the most important ecological processes, have never
been documented.
      Although soil environment is always a concern in agricultural production, the microscopic
environmental effects of dryland-to-paddy conversion, especially the coupling mechanism between
soil microbial communities and the environment, are still being unraveled. The changes in soil
microbial community structure and the interactions between various species during the process of
drought-to-water conversion urgently need to be studied. In this study, high-throughput sequencing
technology and ecological network analysis methods were used to determine the properties of
bacterial 16S rRNA and fungal ITS, to monitor the changes in farmland soil environment after
dryland-to-paddy conversion for the exploration of evolution of soil microbial community structure.
Furthermore, the changes in interaction networks between soil bacterial and fungal communities
and their mechanism were studied, and the differences and similarities between bacterial and fungal
network structure before and after the process of dryland-to-paddy conversion were investigated.
This work focuses on improving the regional ecological environment and future agriculture, and on
providing new strategies for coping with global climatic changes.

2. Materials and Methods

2.1. Study Area
     The experimental region is located on the Nanhu Campus of China Mining University (117.2N,
34.2E), Xuzhou City, Jiangsu Province. This region exhibit a warm semi-humid monsoon climate,
Int. J. Environ. Res. Public Health 2020, 17, 561                                                         3 of 19

with an annual temperature of 14 ◦ C, annual frost-free period of 209 days, and annual precipitation of
833 mm [42]. It is hot and rainy in the same season, and wheat and corn are grown on alternate years.
This region is located in the Huang-Huai-Hai Plain, and is relatively flat. The groundwater level in this
area was high, and the problem of soil salinization is serious. Because the natural conditions meet
the needs for rice cultivation, in the last decade, large-scale land consolidation is carried out for the
alternate growing of wheat and rice for higher and more stable yields of grains.
     This study was set up in pots in the fields of the Land Science Research Center of Nanhu
Campus of China University of Mining and Technology on June 13, 2018. Wheat and corn had been
planted in the soil for the previous five consecutive years. The soil type was cinnamon soil and light
loam in texture, with soil particle composition of 15.12 (0.01 mm) [43]. When the soil was acquired, the original cultivated layer had
not been destroyed. We set up two groups of potted experiments, and each group had 10 parallel
experiments. In one group, Nonghua-101 maize was cultivated in dry land (DL), and five maize plants,
with row spacing of 300 mm and plant spacing of 200 mm, were planted in each pot. In the other group,
Wuyugeng-31 paddy rice was cultivated in paddy field (PF). Since Xuzhou belongs to the semi-humid
region, the dry farming in this area is mainly rain-fed agriculture, and agricultural production based
solely on natural precipitation as the source of water. In this experiment, the DL was the same as
the local dry farming habit and was not irrigated. The Wuyugeng-31 seeds were previously soaked
in water for 5 days, and four seedlings, with row spacing of 300 mm and plant spacing of 200 mm,
were planted in each pot. Afterwards, the paddy irrigation maintains average water-layer depth of
no less than 40 mm. The irrigation water was tap water, in accordance with Chinese agricultural
irrigation standards. All the containers were polyethylene pots with a height of 60 cm, diameter of
40 cm, and soil-layer thickness of 40 cm.

2.2. Soil Sample Collection and Analysis
     After 146 days of potted cultivation, soil samples in the DL and PF cultivation layers at 0–20 cm
were collected with a five-point sampling method on November 6, 2018. Ten soil samples were
respectively collected from parallel pot experiments in DL and PF. The total weight of each sample
was about 1000 g. The soil samples were immediately packed and sealed in sterile polyethylene bags,
and frozen at −20 ◦ C for further treatment. A half of the fresh soil samples were directly tested for
biodiversity analysis. The other samples were naturally dried. After gravel and animal and plant
residues were removed, these samples were ground and sieved with a 2-mm sieve. The basic physical
and chemical properties of the fine powders were measured.
     The pH, electrical conductivity (EC), organic matter (OM), ammonium nitrogen (AN), nitrate nitrogen
(NN), available potassium (AK), and available phosphorus (AP) of the soil samples were measured. In detail,
pH and EC were measured by potentiometry (water:soil = 1:2.5). OM was measured with a potassium
dichromate oxidation-outer heating method. AN was measured by ultraviolet spectrophotometry after
extraction with potassium chloride. NN was measured by ultraviolet spectrophotometry after extraction
with calcium chloride. AP was measured by molybdenum-antimony-scandium colorimetry after extraction
with ammonium bicarbonate. AK was measured by flame photometry after extraction with ammonium
acetate (FP640, Jingke, Shanghai, China) [24,43].

2.3. DNA Extraction, PCR Amplification, and Illumina Miseq Sequencing
      According to the instruction of FastDNA™ SPIN kit (MP Biomedicals, Solon, OH USA), DNA
of 20 farmland soil samples was extracted. Afterwards, the V4 and V5 regions of bacterial 16S
rDNA were amplified using the primers 515F (50 -GTGCCAGCMGCCGCGGTAA-30 ), and 907R
(50 -CCGTCAATTCMTTTRAGTTT-30 ). PCR amplification from soil samples of dry land and paddy field
was conducted with the standard fungus ITS1 primers ITS5F (50 -GGAAGTAAGTCGTAACAAGG-30 )
and ITS1R (50 -GCTGCGTTCTTCTCGATGC-30 ). PCR amplification was as follows: 1 cycle of pre-
denaturation at 98 ◦ C (2 min), then 25 cycles of; denaturation at 98 ◦ C (15 s), annealing at 55 ◦ C (for 30 s),
Int. J. Environ. Res. Public Health 2020, 17, 561                                                    4 of 19

extension at 72 ◦ C (30 s), then 1 cycle of extension at 72 ◦ C (5 min), and cooling to 10 ◦ C. The products
of PCR amplification were separated by 2% agarose gel electrophoresis. The target sequences were
recovered with a gel extraction kit (Axygen, San Francisco, CA, USA). Following the preliminary
electrophoresis quantitation results, the sequences recovered were quantified using a microplate reader
(FLx800, BioTek, Winooski, VT, USA) apparatus with Quant-iT PicoGreen dsDNA Assay Kit fluorescent
reagent. The samples were then mixed in equal proportion. The sequencing library of soil bacteria and
fungi were prepared with the TruSeq Nano DNA LT Library Prep Kit (Illumina, San Diego, CA, USA).
The constructed library was quantified by Qubit and Q-PCR, and then was sequenced with HiSeq2500
PE2500 (Illumina) [43,44].

2.4. Analysis of Soil Microbial Molecular Ecological Network
     Based on the theory of random matrix, the molecular ecological networks of soil microorganisms
in dry land and paddy field were constructed separately. The construction and parameters setting
were completed on the Mena platform (http://ieg4.rccc.ou.edu/mena). After the data were acquired
through high-throughput sequencing, the logarithms of operational taxanomic unit (OTU) data (log10)
were transformed into a correlation matrix. Based on the Pearson correlation coefficients, the matrix
was transformed into a similarity matrix. Using random matrix theory (RMT), with appropriate
threshold values, an adjacency matrix was generated from the similarity matrix. The connection
strength between each pair of nodes was coded with the adjacency matrix. The ecological community
was predicted by analyzing the nearest distance distribution of the eigenvalues of the correlation
matrix [35]. The network was visualized by Cytoscape. Each ecological network was divided into
several modules, and each module was a functional unit of the microbial system. In the structural
diagram of the network, the nodes represented the populations in the microbial community, and the
connecting lines between nodes represented the interactions between populations. Based on the
modules in the network, the influence of soil environmental factors on the ecological network was
considered. The correlations between microbial interaction networks and environmental factors were
analyzed by Pearson correlation analysis methodology. Finally, Cytoscape 3.7.1 software was used to
visualize the soil microbial molecular ecological networks in dry land and paddy field [24,45].

2.5. Data Statistic and Analysis
      The Alpha diversity index was calculated based on the galaxy platform (http//:mem.rcees.ac.
cn.8080/). The analysis of variance (ANOVA) and Pearson correlation analysis of soil physical and
chemical properties before and after the conversion from dry land to paddy field were carried out with
the SPSS19.0 software (IBM, Armonk, NY, USA). Based on the high-throughput sequencing results of
bacteria and fungi, the molecular ecological network was constructed and characteristic parameters
were calculated on the Mena platform (http://ieg4.rccc.ou.edu/mena). The network was plotted with
the Cytoscape software. The topological structural diagram of the network was plotted with the Origin
9.0 software (OriginLab, Northampton, MA, USA). The correlations between soil physical and chemical
factors and the network were analyzed with the ecodist package in R-Studio v7.2 (R Development
Core Team, Vienna, Austria) in Mantel test software.

3. Results

3.1. Effects of Dryland-to-Paddy Conversion on Soil Microbial Community Structure

3.1.1. Impact on Soil Microbial Community Diversity
     The Alpha diversity results before and after dryland-to-paddy conversion are shown in Figure 1.
In the short term after dryland-to-paddy conversion, the soil microbial diversity was significantly
reduced, and the Simpson, Chao1, ACE and Shannon indexes of paddy field were lower than those of
dry land. Compared to dry land, the bacterial diversity index of paddy soil was much lower, and the
Int. J. Environ. Res. Public Health 2020, 17, 561 5 of 19
Shannon index was decreased by 0.62% to 11.99%. The average decline in the Shannon index for fungi
Int. J. 17.04%.
was Environ. Res.
ThePublic Health 2020, 17, 561 conversion largely affected the Shannon and Simpson indices.
dryland-to-paddy 5 of 19
Int.the
In J. Environ.
shortRes.
termPublic Health
after 2020, 17, 561
dryland-to-paddy conversion, the soil microbial diversity was significantly 5 of 19
Using the OTU classification, non-metric multidimensional scale (NMDS) was performed for β
reduced (p < 0.05).
diversity
Usinganalysis.
the OTUThe stress coefficient
classification, non-metricwasmultidimensional
lower than 0.05,scale
indicating
(NMDS)thatwasthe results were
performed for β
Using the OTU classification, non-metric multidimensional scale (NMDS) was performed for
representative.
diversity analysis. The colored
The stressdotscoefficient
correspondedwas tolower
different
thansamples (or groups).
0.05, indicating The
that thecloser together
results were
β diversity analysis. The stress coefficient was lower than 0.05, indicating that the results were
two dots were, The
representative. the colored
higher thedotssimilarity between
corresponded the microbial
to different samplescommunity
(or groups).structure
The closerof together
the two
representative. The colored dots corresponded to different samples (or groups). The closer together
samples,
two dots and were,the thesmaller differences.
higher the similarity NMDSthe
between analysis results
microbial showedstructure
community that the ofmicrobial
the two
two dots were, the higher the similarity between the microbial community structure of the two samples,
communities of dry land and paddy field were greatly different, and the
samples, and the smaller the differences. NMDS analysis results showed that the microbial composition and structure
and the smaller the differences. NMDS analysis results showed that the microbial communities of dry
of soil bacteriaofwithin
communities dry landthe and
groupspaddyof paddy field greatly
field were were very similarand
different, (Figure 2).
the composition and structure
land and paddy field were greatly different, and the composition and structure of soil bacteria within
of soil bacteria within the groups of paddy field were very similar (Figure 2).
the groups of paddy field were very similar (Figure 2).
Figure 1. Alpha diversity indices of soil (a) bacteria and (b) fungi in different land use types. Note:
Figure 1. Alpha diversity indices of soil (a) bacteria and (b) fungi in different land use types. Note: DL
DL is the
Figure 1. soil
Alphasample of dryindices
diversity land before
of soilcorn harvest,and
(a) bacteria and(b)
PF fungi
is the in
soildifferent
sample land
of paddy field before
use types. Note:
is the soil sample of dry land before corn harvest, and PF is the soil sample of paddy field before rice
rice harvest. The same for below.
DL is the soil sample of dry land before corn harvest, and PF is the soil sample of paddy field before
harvest. The same for below.
rice harvest. The same for below.
Figure
Figure 2. NMDS analysis
2. NMDS analysis results
results of
of soil
soil (a)
(a) bacteria
bacteria and
and (b)
(b) fungi
fungi at
at the
the genus
genus level in different
level in different land
land
use
use types.
types.
Figure 2. NMDS analysis results of soil (a) bacteria and (b) fungi at the genus level in different land
3.1.2.use types.
Impact on the Soil Microbial Community Composition
3.1.2. Impact on the Soil Microbial Community Composition
3.1.2.95% of the
Impact onsequences of testedCommunity
the Soil Microbial soil samplesComposition
can be clearly identified and divided into 38 phyla
95% of the sequences of tested soil samples can be clearly identified and divided into 38 phyla
of bacteria, of which Proteobacteria were the most abundant, accounting for about 31.5% (Figure 3a).
of bacteria,
95% ofofthe
which Proteobacteria
sequences of testedwere the mostcan
soil samples abundant, accounting
be clearly identifiedfor
andabout 31.5%into
divided (Figure 3a).
38 phyla
Compared to dry land with loose soil, the paddy field possessed a significant anaerobic environment,
Compared
of bacteria,to
ofdry landProteobacteria
which with loose soil, the paddy
were the most field possessed
abundant, a significant
accounting anaerobic
for about environment,
31.5% (Figure 3a).
resulting in the decline in abundance of Acidobacteria, Actinobacteria, Gemmatimonadetes, Planctomycetes,
resulting
Comparedin theland
to dry decline in abundance
with loose soil, the paddy of field
Acidobacteria,
possessed a Actinobacteria, Gemmatimonadetes,
significant anaerobic environment,
and other aerobic bacteria after the conversion from dry land to paddy field. Because Actinobacteria
Planctomycetes,
resulting in the and other
declineaerobic
in bacteria
abundance after of
the conversion from
Acidobacteria, dry land to paddy
Actinobacteria, field. Because
Gemmatimonadetes,
usually grows in neutral or alkalescent aerobic soil, out of the above listed bacteria [46], the abundance
Actinobacteria
Planctomycetes, usually grows
and other in neutral
aerobic or alkalescent
bacteria aerobic soil,
after the conversion fromoutdry
of the above
land listedfield.
to paddy bacteria [46],
Because
the abundanceusually
Actinobacteria of Actinobacteria was significantly
grows in neutral or alkalescent decreased fromout
aerobic soil, 17.94%
of the to 2.97%,
above which
listed is a [46],
bacteria 6.04
times difference.
the abundance of Under the flooded
Actinobacteria anaerobic environment
was significantly decreased from after the to
17.94% conversion,
2.97%, whichthe isrelative
a 6.04
abundance Chloroflexi
times difference. and the
Under Firmicutes
floodedin PF increased.
anaerobic Most notably,
environment the the
after abundance of Firmicutes
conversion, was
the relative
increased
abundance greatly, fromand
Chloroflexi 0.23% to 18.85%.
Firmicutes in PF increased. Most notably, the abundance of Firmicutes was
increased greatly, from 0.23% to 18.85%.
Int. J. Environ. Res. Public Health 2020, 17, 561 6 of 19
of Actinobacteria was significantly decreased from 17.94% to 2.97%, which is a 6.04 times difference.
Under the flooded anaerobic environment after the conversion, the relative abundance Chloroflexi and
Firmicutes in PF
Int. J. Environ. Res.increased.
Public HealthMost notably,
2020, 17, 561 the abundance of Firmicutes was increased greatly, from 6 of0.23%
19
to 18.85%.
AtAt thethe phylumlevel,
phylum level,14
14and
and16 16 fungi
fungi were identified
identifiedinindry
dryland
landand
andpaddy
paddy field, respectively.
field, respectively.
Ascomycota
Ascomycota waswasthethe
mostmost abundant
abundant species,
species, accounting
accounting forfor approximately33.01%
approximately 33.01%(Figure
(Figure3b).3b).After
Afterthe
the conversion
conversion from from dry land
dry land to paddy
to paddy field,
field, thethe abundanceof
abundance ofaerobic
aerobic fungi
fungi such
suchasasAscomycota
Ascomycota and and
Chytridiomycota declined. For instance, Chytridiomycota was the dominant
Chytridiomycota declined. For instance, Chytridiomycota was the dominant fungus in dry land, fungus in dry land, with an
abundance
with an abundanceof 13.26%, however
of 13.26%, its abundance
however declined
its abundance to 0.1%toin0.1%
declined paddy field. In
in paddy contrast,
field. the
In contrast,
abundance of Basidiomycota, Mortierellomycota, and Olpidiomycota increased. For example,
the abundance of Basidiomycota, Mortierellomycota, and Olpidiomycota increased. For example, the relative the relative
abundance
abundance ofof Olpidiomycotaincreased
Olpidiomycota increasedfrom from0.04%
0.04% to
to 11.29%.
11.29%.
Figure 3. Abundance of soil (a) bacteria and (b) fungi communities for different land use types at the
Figure 3. Abundance of soil (a) bacteria and (b) fungi communities for different land use types at the
phylum level.
phylum level.
3.2. Effects of Dryland-to-Paddy Conversion on the Structure of Soil Microbial Molecular Ecological Networks
3.2. Effects of Dryland-to-Paddy Conversion on the Structure of Soil Microbial Molecular Ecological
Networks
3.2.1. Changes in OTU Topological Structures of Molecular Ecological Networks Generated During
the Process of Dryland-to-Paddy Conversion
3.2.1. Changes in OTU Topological Structures of Molecular Ecological Networks Generated During
theBased onofRMT,
Process the OTU values
Dryland-to-Paddy ≥ 150 for the ten bacterial samples and OTU values ≥ 44 for the
Conversion
ten fungal samples were selected as the input parameters, and the comparable selection thresholds of
bacteriaBased on RMT,
and fungi weretheset
OTU values
at 0.88 and≥ 0.86,
150 for the ten bacterial
respectively, samplesmolecular
to generate and OTU ecological
values ≥ 44networks.
for the
ten fungal samples were selected as the input parameters, and the comparable selection thresholds
The specific topological parameters are shown in Table 1. The average connectivity, average path
of bacteria and fungi were set at 0.88 and 0.86, respectively, to generate molecular ecological
distance, average aggregation coefficient and modularity of all the constructed networks were greater
networks. The specific topological parameters are shown in Table 1. The average connectivity,
than those of random networks, and the R2 values were > 0.75, indicating that the results were
average path distance, average aggregation coefficient and modularity of all the constructed
reliable [38]. In the bacterial and fungal networks, the numbers of2 nodes and connecting lines for dry
networks were greater than those of random networks, and the R values were > 0.75, indicating that
land were greater than those of paddy field, indicating that the molecular ecological network became
the results were reliable [38]. In the bacterial and fungal networks, the numbers of nodes and
simpler after dryland-to-paddy
connecting lines for dry land wereconversion.
greater than those of paddy field, indicating that the molecular
ecological network became simpler average
Moreover, the average degree, path distance and
after dryland-to-paddy connectivity of dry land were higher
conversion.
than those of paddy
Moreover, the field,
average indicating that thepath
degree, average relative connectivity
distance of dry land
and connectivity molecular
of dry land wereecological
higher
network was more complex than that of paddy field, and the network nodes formed
than those of paddy field, indicating that the relative connectivity of dry land molecular ecological were closer.
However,
network thewasmodule indices than
more complex of bacterial
that of and
paddy fungal
field,networks were greater
and the network nodesthan
formedthose of dry
were land,
closer.
indicating
However, that
theshort-term conversion
module indices from dry
of bacterial andland
fungalto paddy
networksfield improved
were greaterthe resistance
than those of of microbial
dry land,
communities
indicating thatto external
short-termchanges. For the
conversion frombacterial
dry landnetwork,
to paddy thefield
average clustering
improved coefficient
the resistance of of
drymicrobial
land wascommunities
slightly smallerto external
than thatchanges.
of paddyFor theindicating
field, bacterial that
network, the averagebetween
the connectivity clustering
each
coefficient of dry land was slightly smaller than that of paddy field, indicating that the connectivity
between each node of paddy field was enhanced. The average clustering coefficient of the fungal
network was increased and the density was decreased after dryland-to-paddy conversion, which
indicated that the connectivity between each node of paddy field was weakened, and the network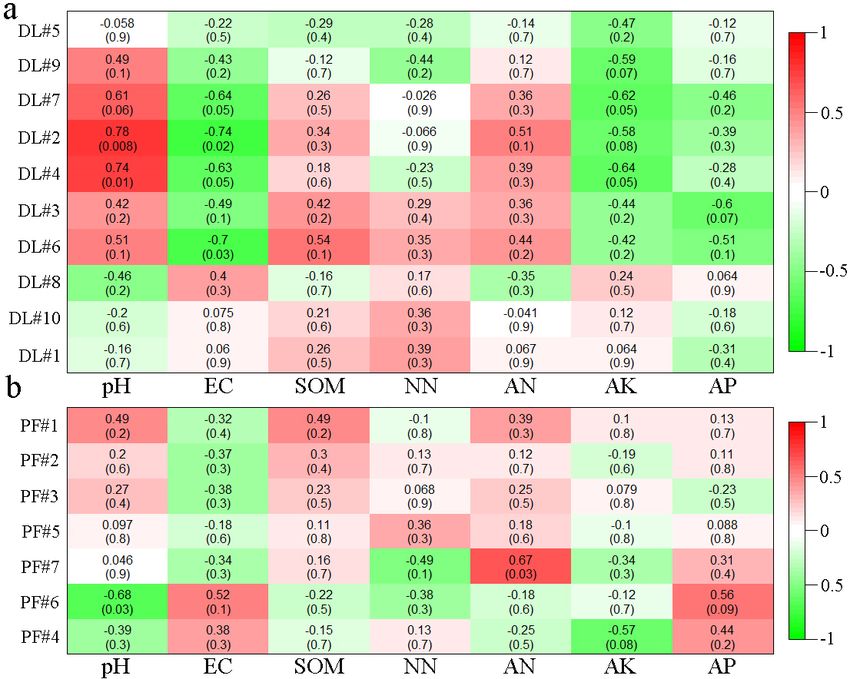
Int. J. Environ. Res. Public Health 2020, 17, 561                                                                          7 of 19

node of paddy field was enhanced. The average clustering coefficient of the fungal network was
increased and the density was decreased after dryland-to-paddy conversion, which indicated that the
connectivity between each node of paddy field was weakened, and the network was simpler than that
of dry land. This may be related to the changes in soil environment or the reconstruction of microbial
functional groups.
      Int. J. Environ. Res. Public Health 2020, 17, 561                                                               7 of 19
      The connectivity within or between modules of molecular ecological networks can reflect the roles
playedwas bysimpler
               different thanOTUs.
                                that of Generally,
                                           dry land. nodes     with
                                                        This may  beZi  values
                                                                      related to ≥the
                                                                                    2.5changes  in soil≥environment
                                                                                        or Pi values     0.62 are considered
                                                                                                                      or the as
critical species. Theofdry
      reconstruction               land bacterial
                              microbial     functional  ecological
                                                          groups. network consisted of four connecting nodes and three
module hubs,         while the paddy
              The connectivity       within field     bacterial
                                               or between       ecological
                                                              modules        networkecological
                                                                        of molecular     consisted   of only can
                                                                                                   networks   tworeflect
                                                                                                                   module thehubs.
The dry
      rolesland     fungal
               played          ecological
                          by different         network
                                            OTUs.           consisted
                                                      Generally,  nodesofwith
                                                                           fourZiconnection    nodes
                                                                                    values ≥ 2.5   or Piand  two≥module
                                                                                                          values    0.62 arehubs,
whileconsidered
       the paddyasfield   critical  species.
                               fungal          The drynetwork
                                          ecological      land bacterial ecological
                                                                  consisted   of onlynetwork  consisted of
                                                                                        one connection      four connecting
                                                                                                          node.  Figure 4 shows
      nodes     and   three   module     hubs,    while  the paddy  field  bacterial ecological  network
that for the critical species in the module hubs and connectors, the nodes with the highest connectivity   consisted of only
      two     module    hubs.    The   dry   land   fungal  ecological network    consisted of four
are located either above and or to the right side of the dashed line. For bacterial network, the     connection   nodes  and
                                                                                                                           critical
      two module hubs, while the paddy field fungal ecological network consisted of only one connection
species with the highest connectivity in dry land (Actinobacteria) and paddy field (Proteobacteria) were
      node. Figure 4 shows that for the critical species in the module hubs and connectors, the nodes with
different.     On the other hand, for the fungal network, the critical species with the highest connectivity
      the highest connectivity are located either above and or to the right side of the dashed line. For
in both    dry land
      bacterial         and paddy
                    network,                     is Ascomycota.
                                          fieldspecies
                                 the critical             with the highest connectivity in dry land (Actinobacteria) and
      paddy field (Proteobacteria) were different. On the other hand, for the fungal network, the critical
       Table 1.
      species   Comparison
              with the highestofconnectivity
                                 the topological properties
                                             in both        of and
                                                     dry land  molecular
                                                                   paddyecological  networks in DL and PF.
                                                                         field is Ascomycota.
                                                                            Bacteria                Fungi
              Table 1. Comparison Parameters
                                  of the topological properties of molecular ecological networks in DL and PF.
                                                                         DL         PF         DL           PF
                                                                                 Bacteria                   Fungi
                                   Parameters
                             Similarity threshold                        0.88 DL 0.88 PF 0.86         DL 0.86      PF
                                     Nodes
                            Similarity threshold                         261 0.88 160 0.88 126       0.86 70      0.86
                                      Links
                                   Nodes                                 637 261 223 160 186          126 83       70
                           Average    degree (AvgK)
                                   Links                                4.881637 2.788 223 2.952      1862.371     83
                   Average   clustering
                          Average  degreecoefficient
                                           (AvgK) (AvgCC)               0.2914.881 0.3092.7880.145   2.9520.135 2.371
                       Average
                   Average       pathcoefficient
                           clustering  distance (AvgPD)
                                                  (AvgCC)                6.360.291 5.6990.3094.362   0.1454.006 0.135
                      Average path Density
                                    distance (AvgPD)                    0.0196.36 0.0185.6990.024    4.3620.034 4.006
                                 Connectivity
                                  Density                               0.6920.019 0.2750.0180.724   0.0240.494 0.034
                              Number    of modules
                                Connectivity                              29 0.692 28 0.275 13       0.724 14     0.494
                            Number   of modules
                                Modular    index                        0.694 29 0.822 28 0.659       13 0.678     14
                                         2
                               ModularRindex                            0.8140.694 0.8480.8220.856   0.6590.859 0.678
                                        R2                                   0.814      0.848        0.856        0.859

                  Figure 4. Z-P plots of molecular ecological networks for different land use types.
                       Figure 4. Z-P plots of molecular ecological networks for different land use types.
Int. J. Environ. Res. Public Health 2020, 17, 561 8 of 19
Int.
Int. J.
J. Environ.
Environ. Res.
Res. Public
Public Health
Health 2020,
2020, 17,
17, 561
561 88 of
of 19
19
3.2.2. Construction and Evaluation of Molecular Ecological Networks Generated during the Process
of Dryland-to-Paddy Conversion
3.2.2. Construction and Evaluation of Molecular Ecological Networks Generated during the Process
3.2.2. Construction and Evaluation of Molecular Ecological Networks Generated during the Process
of Dryland-to-Paddy
Based on the resultsConversion
of soil microbial sequencing, four visualized molecular ecological networks
(Figures 5a andon
Based 6a)the
were constructed
results to illustrate
of soil microbial the relationships
sequencing, between
four visualized bacterial
molecular and fungal
ecological species
networks
in the(Figures
soil after
5a the
andconversion from dry land
6a) were constructed to paddy
to illustrate the field. For the between
relationships molecular ecological
bacterial network of
and fungal
species inthere
soil bacteria, the soil after
were 10the conversion
modules formedfromindry
theland
drytoland
paddy field. For
network, and the molecular
seven ecological
modules formed in
network of soil bacteria, there were 10 modules formed in the dry land network,
paddy field. After the conversion from dry land to paddy field, there were less modules formed and seven modulesin the
paddy formed
field in paddy field.
network thanAfter
werethe conversion
formed in thefrom
drydry
landland to paddy
network field, there
(Figure 5b,d),were
andless
themodules
connectivity
formed in the paddy field network than were formed in the dry land network (Figure 5b,d), and the
between modules was reduced. After the conversion, soil bacteria tended to be more cooperative (blue),
connectivity between modules was reduced. After the conversion, soil bacteria tended to be more
and the relationships between bacteria were looser compared to dry land (Figure 5a,c). Soil bacteria
cooperative (blue), and the relationships between bacteria were looser compared to dry land (Figure
changed
5a,c).to adapt
Soil to the
bacteria changes
changed in soil
to adapt toenvironment
the changes incaused by the conversion.
soil environment caused by the conversion.
5a,c). Soil bacteria changed to adapt to the changes in soil environment caused by the conversion.
Figure
Figure 5. Soil
5. Soil bacterial
bacterial molecular
molecular ecological
ecological networksand
networks andmodular
modular eigengene
eigengene hierarchy
hierarchystructure inin DL
structure
DL (a)
and PF. andSoil
PF.bacterial
(a) Soil bacterial
molecular molecular ecological
ecological network network in the
in the DL; (b)DL;
soil(b) soil bacterial
bacterial modular modular
eigengene
eigengene hierarchy structure in the DL; (c) soil bacterial molecular ecological network in the PF; (d)
hierarchy structure in the DL; (c) soil bacterial molecular ecological network in the PF; (d) soil bacterial
soil bacterial modular eigengene hierarchy structure in the PF. Note: The connection lines represent
modular eigengene hierarchy structure in the PF. Note: The connection lines represent the interactions
the interactions between communities on the phylum level. The blue and red colors indicate positive
between communities on the phylum level. The blue and red colors indicate positive and negative,
and negative, respectively (the use of colors remains the same in the following sections).
respectively (the use of colors remains the same in the following sections).
Figure 6. Soil
Figure fungal
6. Soil molecular
fungal molecular ecological networks
ecological networks andand modular
modular eigengene
eigengene hierarchy
hierarchy structurestructure
in DL in
DL and PF. (a) Soil fungal molecular ecological network in the DL; (b) soil fungal modular
and PF. (a) Soil fungal molecular ecological network in the DL; (b) soil fungal modular eigengene eigengene
hierarchy structure
hierarchy in the
structure DL;
in the (c)(c)soil
DL; soilfungal
fungal molecular ecological
molecular ecological network
network in the
in the PF;soil
PF; (d) (d) fungal
soil fungal
modular eigengene
modular hierarchy
eigengene structure
hierarchy structureininthe
the PF.
PF.
For fungal
For the the fungal molecular
molecular ecologicalnetwork,
ecological network, aa comparison
comparisonofof
Figure 6b,d
Figure shows
6b,d that that
shows the number
the number
of modules in the soil fungal molecular ecological network were reduced and the network
of modules in the soil fungal molecular ecological network were reduced and the network became became
simpler after the conversion from dry land to paddy field. In Figure 6a, the connecting lines between
nodes in the dry land network are significantly higher than those in the paddy field network (Figure 6c),
Int. J. Environ. Res. Public Health 2020, 17, 561                                                                          9 of 19

and the nodes tended to be more competitive between each other (red), but the interactions between
bacterial communities were significantly weakened. After the conversion, the relationships within
and between modules became looser. Ascomycota dominated in the fungal networks of dry land and
paddy field. The fungal network of dry land is more complex than that of paddy field. The disturbance
generated by external environmental factors could not affect the whole fungal network in a short time,
and the community structure was more stable. However, there are fewer nodes and connecting lines
in the paddy field network and the stability was poor, which may be related to the stress on the soil
after flooding.

3.3. Mechanism of Interactions Between Soil Microbial Community and Soil Environmental Factors

3.3.1. Relationships between OTU Levels of Soil Microorganisms and Environmental Factors
     For the screening of the dominant environmental factors affecting soil microbial community
structure, OTU levels were selected for the Mantel test analysis on the soil microorganisms and their
corresponding physical and chemical properties in dry land and paddy field. The results are shown in
Table 2. Microorganisms were closely correlated with pH (p < 0.05). As an important index to the acidity,
alkalinity and salinization degrees of soil, pH had a significant impact on the structural differentiation
of bacteria and fungi. In addition, EC is another important factor affecting the microbial structure,
and the bacteria and fungi had significant relationships with EC. Bacterial OTU had a significant
positive correlation with OM, and paddy field fungus OTU had a significant positive correlation with
AK. These indicated that the soil nutritional indices could affect the microbial community structure.

      Table 2. Mantel Test between soil microbial community at the OTU level and environmental factors in
      DL and PF.

                                                          Bacteria                    Fungi
                              Soil Properties
                                                      DL             PF          DL            PF
                                    pH              0.438 *        0.439       0.262 *       0.189
                               EC (mS·cm−3 )        0.350 *        0.597       0.260 *       0.234
                                OM (g·kg−1 )        0.287 *       0.330 *      −0.168       −0.098
                               NN (mg·kg−1 )         0.254         0.129       −0.059       −0.474
                               AN (mg·kg−1 )         0.308         0.097        0.028        0.156
                               AP (mg·kg−1 )         0.138        −0.054       −0.117        0.045
                               AK (mg·kg−1 )        −0.196         0.157       −0.083       0.397 *
      Note: * represents a t-test of p < 0.05 between different treatments. EC, electrical conductivity; OM, organic matter;
      NN, nitrate nitrogen; AN, ammonical nitrogen; AP, available phosphorus; AK, available potassium. The same
      abbreviations are used below.

     At the OTU level, the relationships between the modules with more than 5 nodes and the
environmental factors in the bacterial molecular ecological network were analyzed by Heatmap.
The as-derived Heatmap is shown in Figure 7. The results showed that the clustering OTU values of
modules 2, 4 and 7 of dry land bacteria were positively correlated with pH, while they were negatively
correlated with soil EC and AK (Figure 7a). On the other hand, among the seven modules formed
by paddy field bacteria, module 6 was significantly negatively correlated with pH, module 7 was
significantly positively correlated with AN, module 4 was significantly negatively correlated with
AK, and module 6 was significantly positively correlated with AP (Figure 7b). The results showed
that after the conversion from dry land to paddy field, the relationships between relevant modules
with conductivity changed from positive to negative correlation. The relationships between relevant
modules with soil EC and AK changed from significantly negative correlation to no correlation. The OM
showed insignificantly positive correlations with relevant modules.
Int. J. Environ. Res. Public Health 2020, 17, 561                                                      10 of 19
Int. J. Environ. Res. Public Health 2020, 17, 561                                                     10 of 19

      Figure 7. Heatmap analysis of bacteria module correlations with environmental factors in DL (a) and
      Figure 7. Heatmap analysis of bacteria module correlations with environmental factors in DL (a) and
      PF (b).
      PF (b).
     Similarly, the relationships between the modules with more than 5 nodes and the environmental
factors in the fungal molecular ecological network were analyzed by heatmap. The as-derived heatmap
structure is shown in Figure 8. For the dry land fungal network modules, module 3 had significantly
positive correlations with OM, NN and ammonia nitrogen, and module 6 had a significantly negative
correlation with ammonia nitrogen (Figure 8a). No significant correlations have been found between
other environmental factors and modules. On the other hand, for the paddy field, module 2 had
a significantly negative correlation with soil AK, and module 1 had a significantly positive correlation
with AP (Figure 8b). No significant correlations have been found between other environmental factors
and modules. The significance levels between the modules of paddy field and environmental factors
were lower than those between modules of dry land and environmental factors, which may be due to
the great changes in each environmental factor and unstable initial relationships between microbial
modules and environmental factors in the short time after conversion. The driving relationships
between microbial species corresponding to OTU in these potential characteristic modules and
environmental factors provide a powerful tool for clarifying the response of microbial community
structure to environment changes, and are beneficial for the development of new strains to adapt to
the new environment.

      Figure 8. Heatmap analysis of fungal module correlation with environmental factors in DL (a) and PF
      (b).

     Similarly, the relationships between the modules with more than 5 nodes and the environmental
factors in the fungal molecular ecological network were analyzed by heatmap. The as-derived
heatmap structure is shown in Figure 8. For the dry land fungal network modules, module 3 had
significantly positive correlations with OM, NN and ammonia nitrogen, and module 6 had a
Figure 7.Res.
Int. J. Environ. Heatmap analysis
Public Health 2020,of
17,bacteria
561 module correlations with environmental factors in DL (a) and
11 of 19
PF (b).
Heatmap analysis
Figure 8. Heatmap analysisof
offungal
fungalmodule
modulecorrelation
correlationwith
withenvironmental factors
environmental in DL
factors (a) and
in DL PF (b).
(a) and PF
(b).
3.3.2. Interactions between Soil Microbial Species and Environmental Factor Network
Similarly,
Furthermore,the the
relationships between thebetween
network interactions modulessoil
with more than
microbial 5 nodes
species andand the environmental
environmental factors,
factors
with in the fungal
environmental molecular
factors ecological
as the nodes, werenetwork were
analyzed. Theanalyzed by heatmap.
top 50 genera The as-derived
of soil microorganisms in
heatmap structure
dry land and paddy is field
shown in Figure
were selected8.for
Forthe
theconstruction
dry land fungal
of an network
RMT-basedmodules,
networkmodule 3 had
to compare
significantly positive
the relationships betweencorrelations with OM,
environmental NN and
factors andmicroorganisms.
ammonia nitrogen, Theand module
results 6 had in
are shown a
Figure 9. Proteobacteria was the primary species in the constructed networks of dry land and paddy
field. Actinobacteria was the dominant species in the constructed network of dry land, but it was not
involved in the network of paddy field (Figure 9a). Among the interactions between the dominant
bacterial species and environmental factors, the numbers and strengths of nodes connected to soil OM,
pH, and EC were the highest. The interactions between AK and AP in paddy field and bacteria were
close, showing that soil nutrients such as AK and AP are the main factors promoting the development
of bacteria in paddy field (Figure 9b). In contrast, no connections were found between dominant
species and environmental factors in the bacterial interaction network of dry land. The connections
between soil physical and chemical properties and bacterial species showed that the interactions in
this network were dominated by negative correlations. In the interaction network, the environmental
factors were located on the perimeter, were closely connected with the dominant species, and affected
the critical species located amid the network. In conclusion, OM, pH and EC were more frequently
connected in the network of dry land, indicating that OM, pH and EC are the determining factors for
the changes of bacterial community structures during the process of dryland-to-paddy conversion.interactions in this network were dominated by negative correlations. In the interaction network, the
environmental factors were located on the perimeter, were closely connected with the dominant
species, and affected the critical species located amid the network. In conclusion, OM, pH and EC
were more frequently connected in the network of dry land, indicating that OM, pH and EC are the
determining
Int. factors
J. Environ. Res. Public for the
Health changes
2020, 17, 561 of bacterial community structures during the process of dryland-
12 of 19
to-paddy conversion.
Figure 9. Molecular ecological networks of dominant bacterial species and environmental factors in
Int. J. Environ.
FigureRes. Public Healthecological
9. Molecular 2020, 17, 561
networks of dominant bacterial species and environmental factors12inof 19
DL (a) and PF (b).
DL (a) and PF (b).
In relation to the interactions between species and environment, Ascomycota was the primary
In relation to the interactions between species and environment, Ascomycota was the primary
species in the ecological networks of dry land and paddy field (Figure 10). Basidiomycota was the
species in the ecological networks of dry land and paddy field (Figure 10). Basidiomycota was the
dominant species in the interaction fungal network of paddy field, but Basidiomycota was not involved
dominant species in the interaction fungal network of paddy field, but Basidiomycota was not involved
in the interaction network of dry land, where the numbers and strengths of nodes connected to NN,
in the interaction network of dry land, where the numbers and strengths of nodes connected to NN,
OM, and EC were the highest, followed by pH and AK, ammonia nitrogen, and AP, successively
OM, and EC were the highest, followed by pH and AK, ammonia nitrogen, and AP, successively
(Figure 10a). In the fungal network of paddy field, fungi had a significant correlation with AK, and
(Figure 10a). In the fungal network of paddy field, fungi had a significant correlation with AK,
had positive correlations with OM, pH, ammonia nitrogen and AP, but these positive correlations
and had positive correlations with OM, pH, ammonia nitrogen and AP, but these positive correlations
were relatively loose (Figure 10b). In addition, the remaining physical and chemical properties were
were relatively loose (Figure 10b). In addition, the remaining physical and chemical properties were
indirectly related to the dominant species. According to the connections between soil
indirectly related to the dominant species. According to the connections between soil physicochemical
physicochemical properties and soil microbial species, the interactions in dry land fungal networks
properties and soil microbial species, the interactions in dry land fungal networks were dominated
were dominated by negative correlations, while the interactions in paddy field fungal networks were
by negative correlations, while the interactions in paddy field fungal networks were dominated by
dominated by positive correlations, demonstrating that the soil bacteria cooperated with each other
positive correlations, demonstrating that the soil bacteria cooperated with each other in order to adapt
in order to adapt to the unfavorable stress caused by flooding.
to the unfavorable stress caused by flooding.
Figure 10.
Figure Molecular ecological
10. Molecular ecologicalnetworks
networksof
of dominant
dominant fungal
fungal species
species and
and environmental
environmental factors
factors in
in
DL (a)
DL (a) and
and PF
PF (b).
(b).
4. Discussion
4.1. Changes in Microbial Community Structure After Dryland-to-Paddy Conversion
A small change in the soil environment may cause major changes in the global environment [47].Int. J. Environ. Res. Public Health 2020, 17, 561 13 of 19
4. Discussion
4.1. Changes in Microbial Community Structure After Dryland-to-Paddy Conversion
A small change in the soil environment may cause major changes in the global environment [47].
Land use conversion changes soil water, heat, other ecological conditions, and the living environment
for the reproduction of microorganisms [2,23], greatly influencing the carbon and nitrogen cycles in soil.
Soil microorganisms are sensitive to changes in land use patterns and soil environment [16,17]. In this
study, the conversion from dry land to paddy field showed a great impact on soil microbial diversity
and community structure. After the conversion, in a short time, the diversity of soil microorganism
was decreased, and the Shannon and Simpson indices in paddy field were significantly lower than
those in dry land. Previous studies also reported that soil environment was unstable in a short
time after land consolidation [48–51]. Generally, with the extension of land consolidation period,
the microbial diversity increases gradually, but the diversity decreases in the short term after the
consolidation [52–55]. Meanwhile, soil microorganisms have a certain selective adaptability to soil
environment. Zhang et al. reported that the moisture content in soil had a significant influence on the
quantity, structure and diversity of soil microbial communities [56]. NMDS analysis indicated that the
microbial communities in farmland soil were largely changed after the conversion from dry land to
paddy field, which might be related to the changes of soil environmental conditions after flooding [57].
More studies have suggested that water stress could lead to changes in the abundance and community
structure of soil microorganisms, and the variance in moisture content in soil could lead to changes in
pH, EC, OM and other factors in farmland [58–60]. These soil properties have been confirmed to be
important reasons for changes in soil microbial abundance and community structure [59–62], as also
evidenced by the results of the present study.
The diversity of the soil microbial community was reduced iIn a short time by the conversion,
and the relative abundance of bacterial and fungal microbial communities was affected to varying
degrees. Forthe bacteria, the dominant bacterial community was Proteobacteria [63], with an abundance
of greater than 30%, with similar levels being found in most farmland soils. For instance, Jangid
reported that Proteobacteria was found, with a prevalence of 30.6–43.2% [64], irrespective of farming
patterns. In the present study, the abundance of aerobic microorganisms such as Actinobacteria
decreased significantly, while that of anaerobic microorganisms such as Chloroflexi and Firmicutes
increased significantly. For instance, Firmicutes is mainly distributed in anaerobic environments such
as biogas fermentation and high-temperature composting, with high environmental adaptability [65],
and the abundance of Firmicutes increased from 0.23% to 18.85% after the conversion from dry land
to paddy field. The conversion led to significant changes in the phylum level of the soil microbial
community. Many studies show that soil bacteria are closely associated with their environmental
factors [59–62]. For example, Shen et al. reported that soil pH was the dominant factors affecting
microbial community structure and diversity [59]. In the present study, the Mantel test results showed
that soil pH, EC and OM were important driving factors determining the changes in characteristics of
the bacterial community. The changes in soil environmental conditions caused by the consolidation of
farmland led to the changes in composition and diversity of microbial community.
For the fungi, Ascomycota was the most dominant fungal species in dry land, accounting for about
45.74%. Ascomycota is mostly a saprophytic fungus in Nature. The main function of saprophytic
microorganisms is to decompose refractory organic matter and to improve the contents of organic
matter and nutrients in the soil. Saprophytic microorganisms play an important role in carbon
and nitrogen cycles [66]. Basidiomycota mostly grows in rotten wood, compost and other humid
environments [66–68], and the abundance of Basidiomycota was increased from 7.93% in dry land to
22.91% (dominant) in paddy field. Most studies found that fungal community structures were usually
closely related to soil nutrient contents [67–69]. In the present study, compared to dry land, paddy
field was flooded for a long period, and most of the voids in soil were occupied by water, resulting
in a low oxygen content and weak redox property of the soil [25,70]. Therefore, the activity of soilInt. J. Environ. Res. Public Health 2020, 17, 561 14 of 19
was weakened, and with it the ability of microorganisms to capture soil nutrients such as carbon
and nitrogen was hindered, affecting the growth and metabolism of microorganisms and causing
changes in the structure and function of fungi. Microorganisms are very sensitive to environmental
variations [17,64], and the great environmental difference between dry land soil and paddy field would
affect the carbon and nitrogen cycle process involving microorganisms.
4.2. Changes in the Structure of Microbial Molecular Ecological Networks After Dryland-to-Paddy Conversion
In Nature, species play an important role in mass circulation and energy flow by forming complex
networks [37,38]. In this study, molecular ecological networks were innovatively applied to the study
of soil microbial community structure and function before and after the conversion from dry land to
paddy field. It was found that the conversion changed the interactions between microorganisms in
the molecular ecological networks. Generally speaking, the more stable an ecosystem is, the more
complex the ecosystem structure will be [36]. The results of the present work agreed with this principle.
The dry land had been cultivated for many years continuously, and a stable ecological structure had
been formed. Compared to the dry land, in a short time after the conversion, the bacterial and fungal
networks in the paddy field had decreased in size, and the relationships between species were simpler,
which may be related to the stress after flooding. The topological characteristics of network nodes
showed that the interactions between microorganisms in dry land and paddy field were different,
and the abundance and diversity of species corresponding to the critical OTU and OTU values in the
entire networks were different.
Soil microorganisms are sensitive to land use patterns and environmental changes [20,24]. In this
study, we found the conversion of dryland-to-paddy greatly impacted the structure of the bacterial and
fungal molecular ecological network. It was found that the soil bacterial molecular ecological network
connection in the dry land was more complex, with more nodes and connection lines. Moerover,
the connections within and between modules were closer. The Actinobacteria played a dominant role
in bacterial networks of both dry land and paddy field. Zhou et al. found that, the soil bacterial
network structure changed, and Actinobacteria played a key role, as the atmospheric CO2 concentration
increased [40]. In the bacterial network of paddy field, anaerobes such as Firmicutes also played
an important role. In the process of land consolidation, land use conversion causes differences in
management measures and farmland environmental factors [23,71], and thus affects the uniqueness
and diversity of bacterial community structure in soil. The interaction between dominant species
and the environment demonstrated that, soil OM, pH and EC were dominant, affecting the microbial
community. The results implied that waterlogging stress in paddy fields changed the soil pH, water and
nutrients in different level, as well as affecting the development of soil bacterial communities. Previous
studies proved that the evolution of microbial community structure and function was closely related to
the levels of carbon and nitrogen in the soil, and the level of one element might limit the uptake and
utilization of other elements by microorganisms [28,63,72]. The dryland-to-paddy conversion could
improve the availability of soil nutrients through changing the physical and chemical properties of the
soil, and thus changed the network structure of the microorganisms.
In the fungal molecular ecological network, Ascomycota play a lead role in the fungal networks of
both dry land and paddy field, and the fungal communities presented mainly negatively correlation
among themselves (Figure 6), which indicated the underlying competition in resources. The fungal
network modular structure of dry land, with a greater number of nodes and connecting lines, was more
complex than that of paddy field. The changes in the fungal network module structure may be attributed
to the changed soil physical structure due to dryland-to-paddy conversion. Because the porosity of soil
would be changed by flooding, redox reactions would be thus affected [24], leading to the changes in
microbial community structure. According to the work of Hannula et al., changes in soil environment
is an important factor affecting the structure and function of a fungal community [73]. Module 3 in
the network of dry land (Figure 8) had significant correlations with OM, AN and NN. The interaction
networks of soil fungi and environmental factors in dry land and paddy field were totally distinct,You can also read