Fleet Electrifi cation Roadmap - REVOLUTIONIZING TRANSPORTATION AND ACHIEVING ENERGY SECURITY

Page created by Paul French
 
CONTINUE READING
Fleet Electrifi cation Roadmap - REVOLUTIONIZING TRANSPORTATION AND ACHIEVING ENERGY SECURITY
Fleet Electrification Roadmap
REVOLUTIONIZING TRANSPORTATION AND ACHIEVING ENERGY SECURITY

November 2010
Fleet Electrifi cation Roadmap - REVOLUTIONIZING TRANSPORTATION AND ACHIEVING ENERGY SECURITY
Fleet Electrification Roadmap
REVOLUTIONIZING TRANSPORTATION AND ACHIEVING ENERGY SECURITY

November 2010

© Copyright Electrification Coalition. The statements and data expressed in this report reflect the consensus of the Electrification Coalition but do not necessarily
represent the business models or individual data of any one company. Although the authors and endorsers of this report have used their best efforts in its preparation,
they assume no responsibility for any errors or omissions, nor any liability for damages resulting from the use of or reliance on information contained herein.
The authors have sought to obtain permission from all image, data, and chart owners and apologize to any who could not be properly traced for permission and
acknowledgement.
Fleet Electrifi cation Roadmap - REVOLUTIONIZING TRANSPORTATION AND ACHIEVING ENERGY SECURITY
fleet electrification roadmap     3

Table of Contents

Letter from the Electrification Coalition       5    PART three
Executive Summary                               8    Identifying Fleet Opportunities                    94
                                                     3.1 Overview                                       97
                                                     3.2 Modeling Assumptions                           99

PRIMER		                                             3.3 Key Findings                                  106
Electrification of the Transportation Sector   17    3.4 Case Studies                                    111
Overview		                                     19    Sales, Service, Utility Cars                        112
The Case for Electrification                    31   Light Sales, Service, Utility, Short Haul           115
A Growth Sector for Jobs                       40    Light Government                                    118
Market Outlook                                 42    Medium Short Haul, Sales & Service                  121
Expanding the Demand Side                      44    3.5 Fleet Adoption of GEVs in 2015                124

PART ONE                                             PART four
The Case For Fleets                            46    Policy Recommendations                            126
1.1 Overview                                   49    4.1 Fleet Microsystems                            129
1.2 Fleet Demographics                         50    4.2 Other Policies                                134
1.3 Advantages of Fleet Operators              54
Total Cost of Ownership Approach to Acquisition 56
Route Predictability                           58    Conclusion                                        140

High Vehicle Utilization Rates                 60    Appendix A: Top 50 Commercial Fleets               142

Use of Central Parking Facilities              62    Appendix B: Available Vehicle Matrix               144

Importance of Maintenance and Service Costs    65    Key to Terms                                       148

Lower Electricity Rates                        66    Acknowledgements                                   150

Alternative Business Models                    67
Corporate Sustainability Initiatives           70

PART two
Fleet Challenges                               72
2.1 Overview                                   75
2.2 Fleet Challenges                           76
Technology Costs                               78
Capital Expenditures vs. Operating Expense     83
Battery Residual Value                         84
Fleet Infrastructure Issues                    87
Utility Impact of Dense Charge Networks        88
Market Perception                              92
Fleet Electrifi cation Roadmap - REVOLUTIONIZING TRANSPORTATION AND ACHIEVING ENERGY SECURITY
4    preface                                                                                                                                                        fleet electrification roadmap   5

    OUR MISSION                                                                                           LETTER FROM THE ELECTRIFICATION COALITION

    The Electrification Coalition is dedicated to reducing America’s                                                         In November 2009, the Electrification Coalition released
    dependence on oil through the electrification of transportation. Our                                                     the Electrification Roadmap, a comprehensive policy
    primary mission is to promote government action to facilitate deployment                                                 framework analyzing the state of the electric drive vehicle
    of electric vehicles on a mass scale. The Coalition serves as a dedicated                                                industry and the barriers to achieving higher rates of
    rallying point for an array of electrification allies and works to disseminate                                           penetration in America’s light-duty vehicle fleet. The goal
    informed, detailed policy research and analysis.                                                                         of the Roadmap was ambitious: to transform the U.S. light-
                                                                                                          duty ground transportation system from one that is oil-dependent to one
                                                                                                          powered almost entirely by electricity, enhancing U.S. economic prosperity
    ELECTRIFICATION COALITION MEMBERS                                                                     and safeguarding national security. The report proposed an ambitious
    John T. Chambers                                 Ray Lane                                             federal initiative to establish ‘electrification ecosystems’ in a number of
    Chairman & CEO, Cisco Systems, Inc.              Managing Partner, Kleiner Perkins Caufield & Byers   American cities. Electrification ecosystems—also known as deployment
    Timothy E. Conver                                Richard Lowenthal                                    communities—were designed to move grid-enabled electric vehicles (GEVs)
    Chairman, President & CEO, Aerovironment, Inc.   Founder & CEO, Coulomb Technologies, Inc.
                                                                                                          past early adopters and into mainstream consumer markets.
    Peter L. Corsell                                 Alex A. Molinaroli
    Non-Executive Chairman, GridPoint, Inc.          Chairman, Johnson Controls-Saft and
                                                     President, Johnson Controls Power Solutions
                                                                                                          The Electrification Roadmap envisioned a competitive selection process
    David W. Crane
    President & CEO, NRG Energy, INC.                Reuben Munger                                        managed by the Department of Energy (DOE). To compete, applicant
                                                     Chairman & CEO, Bright Automotive, Inc.
                                                                                                          cities and communities would need to demonstrate that they had made
    Alexander M. Cutler
    Chairman & CEO, Eaton Corporation                Jim Piro                                             significant progress toward establishing the regulatory environment
                                                     President & CEO, Portland General Electric

    Steven "Mac" Heller                                                                                   in which GEVs would thrive. The most competitive applications would
                                                     Mike Segal
    Co-Chairman & Interim CEO, CODA Automotive
                                                     Chairman & CEO, LS Power Group                       demonstrate the support of a broad range of public and private stakeholders,
    Peter A. Darbee
                                                     Frederick W. Smith
                                                                                                          including utilities, utility regulators, large local employers, vehicle and
    Chairman, CEO, & President, PG&E Corporation
                                                     Chairman, President & CEO, FedEx Corporation         charger OEMs, and state and local governments. The winning communities
    Charles Gassenheimer
    Chairman & CEO, Ener1, Inc.                      Eric Spiegel                                         would be eligible for targeted, amplified, temporary subsidies for consumers,
                                                     President & CEO, Siemens Corporation
                                                                                                          infrastructure providers, and utilities. The program was proposed to advance
    Seifi Ghasemi
    Chairman & CEO, Rockwood Holdings, Inc.          Andrew C. Taylor                                     in two phases and expire in 2018.
                                                     Chairman & CEO, Enterprise Holdings

    Carlos Ghosn
    President & CEO, Nissan Motor Company, Ltd       David P. Vieau
                                                     President & CEO, A123 Systems, Inc.

    Jeffrey R. Immelt
    Chairman & CEO, General Electric Company
Fleet Electrifi cation Roadmap - REVOLUTIONIZING TRANSPORTATION AND ACHIEVING ENERGY SECURITY
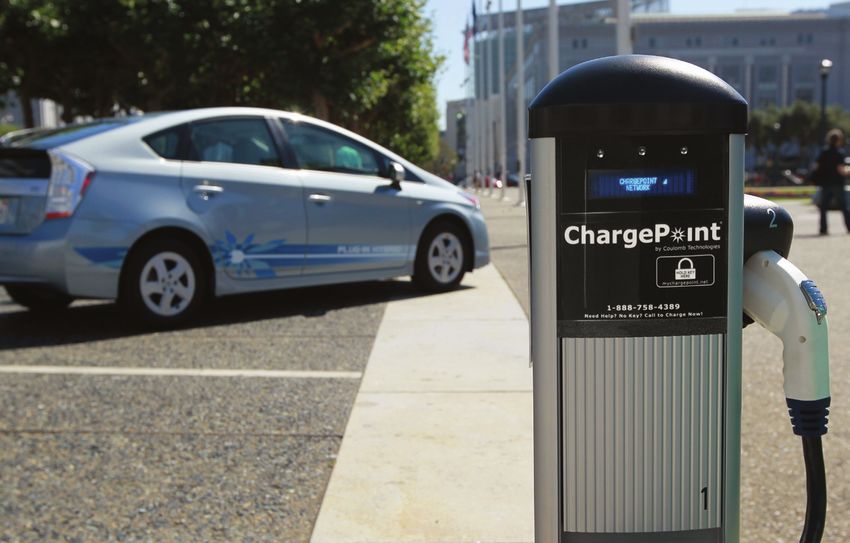
6    preface                                                                                                                                                                                                           fleet electrification roadmap        7

    Deployment communities were designed to build criti-        both at home and in public. The Electrification Roadmap        more than 16.3 million vehicles in operation in 2009, the     development of innovative business models that bundle
    cal momentum in the cost and learning curves that oth-      also outlined potentially zero-cost programs to support        nation’s fleets likely possess enough capacity to drive       capital expenses with fuel and operating savings in order
    erwise are likely to slow the early advancement of the      development of a secondary battery market, allowing the        initial ramp-up scale in the battery industry and OEM         to make the decisions to electrify more transparent and
    GEV market. Without such an approach, electric vehicles     first GEV consumers to feel confident that used large-         supply chains. More important, the operational norms          accessible for fleet operators.
    and plug-in hybrid electric vehicles are likely to be rel-  format lithium-ion batteries would have resale value.          of certain fleet segments may allow them to rapidly sur-           Of course, there are significant challenges that could
    egated to niche status for many years, purchased only            Finally, the Electrification Roadmap identified the       mount the most difficult challenges facing electrification    make fleet operators hesitant to adopt electric drive
    by environmentalists and technological enthusiasts, in      areas in which utilities would need support and flex-          in the passenger market. Perhaps most significantly, fleet    vehicles. Fears about the reliability of the technology and
    numbers far too small to meaningfully enhance national      ibility to manage the integration of GEVs into the elec-       owners may be more willing than individual consumers          the ability of electric drive vehicles to meet fleet mission
    or economic security. In                                                                  tric power grid. Deployment      to focus on total cost of vehicle ownership as opposed to     requirements are perhaps the most important issues.
    April 2010, DOE updated its                                                               communities were designed        upfront costs. This approach advantages the economic          Fleet operators are extremely unlikely to sacrifice over-
    energy-related scenarios to            The Electrification Roadmap to target those regions in                              dynamics of electric drive vehicles in cases where the        all mission for reduced transportation costs. Electric
    reflect the expected impact                                                               which time-of-use pricing        higher upfront costs vis-à-vis an internal combustion         drive technologies must, therefore, meet two discrete
    of the American Recovery               targeted       a  substantial     shift   in       and other regulatory support     engine vehicle can be demonstrably offset through lower       criteria in order to be attractive to fleet operators: they
    and Reinvestment Act on             transportation energy use, such was available to incentivize                           operating and maintenance costs over time.                    must save money and allow fleet vehicle drivers to do
    the entire energy economy.                                                                consumers to charge batter-           Fleet owners may also benefit from operational           their job effectively.
    Despite specific GEV-related             that 75 percent of light-duty ies during off-peak hours. Tax                      norms such as centralized refueling, high vehicle utili-           Fleet electrification should not be an end in itself.
    subsidies included in the leg-
                                         vehicle miles traveled would be credits for utility upgrades                          zation rates, and predictable routing. In fact, coupled       By driving volume in battery and OEM supply chains,
    islation, DOE estimated that                                                              were proposed, and utility       together, centralized refueling and highly predictable        providing practical business experience with both
    by 2035, there will be only 5.1                   electric miles by 2040. regulators were encouraged                       routing could allow fleet operators to right-size battery     private and public charging infrastructure, and dem-
    million EVs and PHEVs on the                                                              to allow utilities to include    requirements, avoiding the expenditure that many pri-         onstrating the reliability of electric drive vehicles to
    road out of nearly 300 million light-duty vehicles in the   certain physical and IT upgrades to the distribution net-      vate consumers in the passenger vehicle market will be        consumers throughout the United States, electrified
    United States, representing less than 1.7 percent of the    work in their rate base.                                       making on extra battery capacity that will rarely be fully    fleet vehicles would provide substantial spillover ben-
    total vehicle parc.                                              This network of mutually reinforcing policies was         utilized. Fleet operators also tend to take advantage of      efits to the broader consumer market. In that sense,
         These numbers are far lower than what is possible      designed to expand the customer base for grid-enabled          commercial and industrial electricity rates, which are        fleet electrification represents an additional, practical,
    within the appropriate policy framework. They are also      vehicles in an accelerated, but carefully planned, man-        significantly lower than those paid by residential con-       near-term strategy for facilitating the transforma-
    far less than what is urgently necessary to radically       ner. The increased economies of scale, learning by doing,      sumers. The prominence of vehicle leasing and manage-         tion of the U.S. transportation system and improving
    transform the transportation sector of the economy to       and demonstration value of the deployment community            ment entities in the fleet industry may also facilitate the   American energy security.
    enhance national and economic security. Therefore, the      approach would benefit pragmatic consumers, industry
    Electrification Roadmap established as a goal the deploy-   participants, and the nation as whole.
    ment of 14 million grid-enabled light-duty vehicles in
    the United States by 2020 and more than 120 million         Expanding the Market for GEVs: Fleet Vehicles
    by 2030, a far more ambitious and transformative tar-       The Electrification Roadmap focused on the light-duty
    get. Ultimately, the Electrification Roadmap targeted a     vehicle parc because it is the single largest homogenous
    substantial shift in transportation energy use, such that   component of the transportation sector, with 230 mil-
    75 percent of light-duty vehicle miles traveled would be    lion vehicles alone that account for 40 percent of U.S.
    electric miles by 2040 (today, 94 percent of the delivered  daily oil demand. Addressing the energy mix in this seg-
    energy that powers the U.S. transportation system is        ment will ultimately be critical for improving national
    petroleum-based).                                           and economic security. Yet, the highway transportation
         The strong, targeted consumer incentives envi-         system and the transportation economy are multifac-
    sioned by the Electrification Roadmap were designed         eted and diverse, and it is possible that other segments
    to drive economies of scale in the electric drive battery   besides light-duty passenger vehicles in the consumer
    industry, thereby reducing costs. But subsidies could       market could be strong candidates for electrification and
    not represent a credible stand-alone policy. Strong         electric drive technology. Those segments may relate to
    support for infrastructure providers was also included      the operational and economic challenges and benefits of
    to reduce the marginal cost of installing early charging    electrification differently, and solutions to the technical
    units at home and in public, allowing entrepreneurs to      and cost barriers to adoption might be more forthcoming.
    experiment with business models and providing poten-             In particular, the nation’s fleet vehicles stand out as
    tial GEV customers with confidence that they would be       possessing unique characteristics that could make them
    able to reliably and conveniently refuel their vehicles,    clear beneficiaries of electric drive technology. With
Fleet Electrifi cation Roadmap - REVOLUTIONIZING TRANSPORTATION AND ACHIEVING ENERGY SECURITY
8    executive summary                                                                                                                                                                       fleet electrification roadmap                    9

    EXECUTIVE SUMMARY                                                 FIGURE E1

                                                                      Net U.S. Government Debt as a Percentage of GDP

    Between 2003 and 2009, the global oil market witnessed its        100% Debt Percent of GDP                                                                                                                      WTI, $/BBL (real $) 100

                                                                                                                                                                        Spot WTI
    most significant period of volatility in nearly a generation.     80                                                                                                                                                                80

                                                                                                    Net Government Debt
    After relentlessly increasing for five years, oil prices spiked   60                                                                                                                                                                60

    to historical highs of more than $147 per barrel in July 2008.1   40                                                                                                                                                                40

    Not by coincidence, the home mortgage and global financial            20                                                                                                                                                            20

    crises erupted just a few months later, plunging the U.S.             0                                                                                                                                                             0
                                                                                1990                         1995                         2000                      2005                          2010                           2015
    economy into its most severe recession since World War            Source: DOE; IMF

    Two. After retreating to less than $40 per barrel in early        Highly volatile oil prices have been the most persistent                            than any other national economy in the world.7 Highway
    2009, oil prices have now averaged more than $70 per              structural risk to the U.S. economy for decades. The
                                                                      boom and bust cycle of oil prices that has been in place
                                                                                                                                                          transportation—passenger vehicles, freight trucks, and
                                                                                                                                                          buses—accounts for the largest share, more than 11 mil-
    barrel throughout 2010.2                                          since 2003—and a number of other times since 1970—                                  lion barrels per day.8 With no substitutes available at
                                                                      contributes to a high degree of uncertainty throughout                              scale, petroleum provides 94 percent of the energy used
                                                                      the economy, resulting in reduced economic activ-                                   in transportation.9 In short, oil powers the mobility that
                                                                      ity, higher unemployment, and expansion of public                                   is central to American prosperity and the American way
                                                                      debt. When global oil market dynamics generate price                                of life.
                                                                      shocks, the result has often been a recession followed                                    This excessive reliance on a single fuel to power a
                                                                      by heavy government spending.                                                       key component of our economy has left the United States
                                                                           The macroeconomic significance of oil price shocks                             hostage to a global oil market that is likely to become
                                                                      is a function of the prominent role of oil in the U.S.                              increasingly volatile. Rising demand for mobility in
                                                                      economy. Petroleum accounts for nearly 40 percent of                                emerging market economies is driving a steady increase
                                                                      U.S. primary energy needs, more than any other fuel. 3                         12   in global oil consumption, despite efficiency improve-
                                                                      In 2008, as oil prices reached inflation-adjusted all-time                          ments in advanced economies. Between 2008 and 2030,
                                                                      highs, American consumers and businesses spent more                                 increased oil consumption in the transportation sectors
                                                                      than $900 billion on retail petroleum-based fuels—6.4                               of China, India, and the Middle East region is expected
                                                                      percent of GDP.4 While 2008 represents an exceptional                               to account for 70 percent of the total 15 million barrel
                                                                      year, economy-wide spending on petroleum fuels has                                  per day increase in global oil consumption.10 Burgeoning
                                                                      averaged more than 5 percent of GDP since 2005, and                                 middle classes and higher standards of living in these
                                                                      household spending on gasoline has exceeded 10 percent                              regions will place consistent pressure on global oil sup-
                                                                      of median income in some regions of the United States.5                             pliers to expand capacity. In the meantime, resource
                                                                           More than 70 percent of the oil we use is for trans-                           nationalism, political instability, and insufficient
                                                                      portation fuels.6 At approximately 14 million barrels per                           upstream investment in many oil producing regions are
                                                                      day, the U.S. transport sector alone consumes more oil                              continuing to constrain growth in oil supplies. While oil
                                                                                                                                                          markets are certainly well supplied today, perhaps the
                                                                      1        U.S. Department of Energy (DOE), Energy Information Administration
                                                                               (EIA), Petroleum Navigator, Monthly Crude Oil Spot Prices, available at
                                                                               http://www.eia.gov/dnav/pet/pet_pri_spt_s1_m.htm.                          7    DOE, AER 2009, Tables 5.13a through 5.13d; BP, plc, Statistical Review of
                                                                      2        Id.                                                                             World Energy 2010, at 11, 12.
                                                                      3        BP, plc, Statistical Review of World Energy 2010, at 41.                   8    DOE, Office of Energy Efficiency and Renewable Energy (EERE) ,
                                                                      4        EC analysis based on DOE, Annual Energy Review 2009 (AER 2009),                 Transportation Energy Data Book 2010, Table 1.14.
                                                                               Table 3.5.                                                                 9    DOE, AER 2009, Table 2.1e.
                                                                      5        Id.                                                                        10   International Energy Agency, World Energy Outlook 2010, Annex A, New
                                                                      6        DOE, AER 2009, Tables 5.13a through 5.13d.                                      Policies Scenario.
Fleet Electrifi cation Roadmap - REVOLUTIONIZING TRANSPORTATION AND ACHIEVING ENERGY SECURITY
10     executive summary                                                                                                                                                                                                                                                                     fleet electrification roadmap   11

      FIGURE E2                                                                                                                                                                     FIGURE E3                                                        FIGURE E4

      Change in Primary Oil Demand by Region and Sector (2007-2030)                                                                                                                 Annual Fleet GEV Sales Scenarios                                 Fleet GEV Parc Scenarios

                                                     China                                                                                                                          140 Annual Sales (000 Vehicles)                                  250 GEV Parc (000 Vehicles)

                                                      India                                                                                                                         120
                                               Middle East                                                                                                                                                                                           200
                                                                                                                                                 Other
                                                                                                                                                                                    100
                                            Other Asia                                                                                      Industrial
                                                                                                                                                                                                                             EC Policy Case          150
                                         Latin America                                                                                Non-Energy Use                                 80
                                                                                                                                                                                                                                                                                                      EC Policy Case
                                                   Africa                                                                       Transport                                            60                                                              100
                                    E. Europe/Eurasia
                                                                                                                                                                                     40                       Baseline
                                                                  OECD Europe                                                                                                                                                                                                      Baseline
                   Power                                                                                                                                                                                                                              50
                                                                  OECD Pacific                                                                                                       20

                                                                  OECD North America                                                                                                  0                                                                0
      -200                        -100                        0                        100           200                  300                     400 Million Tons Oil Equivalent           2012                      2013     2014           2015            2012                     2013             2014           2015

      Source: International Energy Agency, World Energy Outlook 2009                                                                                                                Source: PRTM Analysis

      most significant risk to a full global economic recovery                               flexibility to our foreign policy. Simultaneously, such a                                   To date, policymakers and industry participants                  Based on total cost of ownership modeling con-
      is that expanded economic activity will lead to higher                                 system would clear a path to dramatically reduced econ-                                have focused their efforts on expanding the market for           ducted for this report, commercial and government fleets
      oil demand and reduced capacity margins, propelling oil                                omy-wide emissions of greenhouse gases.                                                GEVs among personal-use passenger vehicles. This                 could contribute substantial volume commitments in the
      prices back toward 2008 levels.                                                             In the process, electrified transportation would                                  approach is clearly justified by the role that passenger         early development phases of the GEV market. The eco-
           The United States has the technological and eco-                                  stem the flow of U.S. wealth abroad to pay for imported                                vehicles play in U.S. oil consumption. Personal use cars         nomic attractiveness of electric drive vehicles in certain
      nomic power to disentangle itself from this situation.                                 oil, which currently accounts for more than 50 percent                                 and light-duty trucks alone account for 40 percent of            applications—coupled with operational enhancements
      While improvements in efficiency and the targeted                                      of America’s trade deficit.11 Dollars sent abroad to pay for                           total U.S. oil demand.                                           and targeted use of public policy levers—could drive
      deployment of alternative fuels can—and should—play a                                  oil represent a significant wealth transfer; in contrast,                                   However, in order to support development of the             grid-enabled vehicle penetration in U.S. commercial
      role in reducing the role of oil in the U.S. economy, a more                           dollars spent at home to invest in power generation,                                   electric drive vehicle industry and to help drive down           and government fleets to as much as 7 percent of new
      transformational possibility is within reach. Specifically,                            transmission, and distribution will help to generate                                   industry costs for consumers, alternative vehicle mar-           acquisitions by 2015. In aggregate, the market for EVs
      U.S. and global automakers have invested heavily in                                    economic activity and employment in the United States.                                 kets could be important in the near term. The early              and PHEVs in fleet applications could lead to cumulative
      producing vehicles powered by electricity from the                                     And because the battery industry tends to locate near                                  development of the electric drive vehicle and battery            unit commitments of more than 200,000 EVs and PHEVs
      grid. These vehicles have the ability to fundamentally                                 demand centers, a large market for GEVs in the United                                  industries would benefit from a diverse customer base            between 2011 and 2015.
                                                                                             States should drive increased hiring in the manufacture                                that can help drive critical volumes, particularly in the

70%
                                                                                             of advanced batteries and their components.                                            period between 2010 and 2015, when charging infra-
                       Between 2008 and 2030, increased oil consumption in the                    The first wave of new GEVs is expected in U.S. mar-                               structure and consumer acceptance issues will constrain
                       transportation sectors of China, India, and the Middle East
                       region is expected to account for 70 percent of the increase          kets in December 2010 and early 2011. General Motors,                                  development of the passenger market. Specifically, com-
                       in global oil consumption.                                            Nissan Motor Company, and Ford Motor Company will                                      mercial and government fleet applications stand out as
                                                                                             be among the first automakers to introduce fully elec-                                 highly viable market segments based on the operational
      transform our transportation sector, moving from cars                                  tric vehicles (EVs) and plug-in hybrid electric vehicles                               needs of the vehicles and the economic factors that drive
      and trucks that depend on costly oil-based fuels to an                                 (PHEVs) to American consumers. Total North American                                    vehicle acquisition processes.
      integrated system that powers our mobility with domes-                                 production capacity is expected to surpass 350,000 units
      tically-generated electricity.                                                         by 2015.12 However, the long-term market outlook for
           Electrified transportation has clear advantages over                              these vehicles is somewhat uncertain. To be sure, early
      the current petroleum-based system. Electricity repre-                                 adopters and technological enthusiasts will prove to be a
      sents a diverse, domestic, stable, fundamentally scalable                              reliable customer base for the first several hundred thou-
      energy supply whose fuel inputs are almost completely                                  sand GEVs marketed in the United States. But in order to
      free of oil. High penetration rates of grid-enabled                                    fully capitalize on the potential of electrification to fun-
      vehicles (GEVs)—vehicles propelled in whole or in part                                 damentally improve U.S. energy and economic security,
      by electricity drawn from the grid and stored onboard                                  broader market penetration is required.
      in a battery—could radically minimize the importance
                                                                                             11   U.S. Department of Commerce, Census Bureau, Foreign Trade Statistics,
      of oil to the United States, strengthening our economy,
                                                                                                  available at http://www.census.gov/indicator/www/ustrade.html.
      improving national security, and providing much-needed                                 12   PRTM analysis.
12        executive summary                                                                                                                                                                                                       fleet electrification roadmap        13

          PART ONE                                                                                                                                   PART TWO

      The Case for Fleets                                                                                                                            Fleet Challenges

     There were more than 16 million public and private fleet                                                                                       While fleet operators do possess a number of important
     vehicles on the road in the United States in 2009.13 While                                  High Vehicle Utilization Rates: Fleet              qualities that could facilitate their adoption of electric      Fleet Infrastructure Issues: Even for fleets
     the size of individual fleets varies significantly, the top                                 vehicles typically have higher utilization         vehicles, they will also face challenges. Some of the basic     that centrally park, the cost of installing
                                                                                     0%   100%

     50 fleet operators together manage more than half a mil-                                    rates than consumer vehicles. The result may       cost and technology hurdles for individual consumers will       charging infrastructure may be significant.
     lion cars and trucks.14 These vehicles perform a variety of                                 be that fleet operators can quickly recoup the     also be problematic for fleets, though fleets may be better     With Level II charger costs averaging $2,000
     missions for federal, state, and local government, and for                                  higher upfront costs of electric drive vehicles.   equipped to deal with them. In addition, fleet electrifica-     per unit, the cost of installing enough char-
     companies that are familiar to nearly all Americans. They                                                                                      tion may come with its own set of unique challenges that        gers to support a fleet of several dozen EVs or
     are postal delivery vehicles, utility and telecommunica-                                    Use of Central Parking Facilities: Fleets          can be addressed through a combination of careful plan-         PHEVs could be challenging. Level III charg-
     tions service trucks, pharmaceutical sales vehicles, urban                                  that make use of central parking depots may        ning and public policy support.                                 ing may offer faster charge times and reduced
     delivery vans, and others.                                                                  be able to avoid dependence on public charg-                                                                       unit requirements, but costs are still too high.
          The concentration of buying power associated with                                      ing infrastructure and benefit from econo-
     fleet operators and fleet management companies repre-                                       mies of scale in single-point installation of                  Technology Costs: Battery costs associated          Utility Impact of Dense Charge Networks:
     sents a significant opportunity to assist the early devel-                                  multiple chargers in individual facilities.                    with the first commercially available electric      Bringing a fleet of EVs or PHEVs into a
     opment of the electric drive vehicle industry. Moreover,                                                                                                   drive vehicles will result in a substantial over-   small charging space will bring an unusu-
     fleets tend to possess a handful of important charac-                                       Importance of Maintenance and Service                          all cost premium. Current battery technol-          ally high burden to those areas and may
     teristics that may make them more likely than typical                                       Costs: Particularly in fleet applications that                 ogy is descending the cost curve as volumes         require upgrades to local utility distribution
     consumers to take on the potential risks of electric drive                                  operate vehicles for longer periods of time                    increase, but under some fleet applications, it     networks. In particular, transformers serv-
     ownership in anticipation of reaping financial benefits                                     or into high mileage ranges, the low main-                     may be difficult to realize a return on invest-     ing charging facilities may be insufficiently
     down the road.                                                                              tenance costs of electric drive vehicles will                  ment in a reasonable time period. Ultimately,       robust to support the simultaneous charging
                                                                                                 represent a substantial cost savings.                          fleet operators may be more willing than            of multiple vehicles. Utilities will need access
                                                                                                                                                                personal-use consumers to consider multi-           to information and regulatory support to deal
                      Total Cost of Ownership Approach to                                        Lower Electricity Rates: The electricity                       year paybacks, but they will still want to see      with these and other issues.
                      Acquisition: When asked, fleet managers                                    rates paid by commercial and industrial con-                   returns relatively quickly.
                      rank total cost of vehicle ownership as the                                sumers—those most likely to make use of fleet                                                                      Market Perceptions: Perhaps the most
                      most significant factor driving acquisition                                vehicles and central refueling—are often sig-            0     Capital Expenditures vs. Operating                  critical challenge affecting fleet adoption of
                      decisions.15 Consumers, on the other hand,                                 nificantly less than those paid by residential                 Expense: There is typically intense com-            electric drive technology will be fleet adopt-
                      may purchase for a variety of reasons, includ-                             consumers. The fuel cost per mile traveled is                  petition for capital within a given company         ers’ impressions about the technology and its
                      ing aesthetics and style, in addition to cost.                             one of the key economic factors differentiat-                  or institution. The high capital cost require-      ability to meet their operational needs. Even
                                                                                                 ing plug-in electric drive vehicles from other                 ments of today’s electric drive vehicles, par-      when a compelling economic case exists, fleet
                      Route Predictability: The most cost-                                       technologies.                                                  ticularly in applications heavier than a pas-       operators will need to be confident that the
                      intensive component in current-generation                                                                                                 senger automobile, will prove challenging for       vehicle can accomplish the mission.
                      electric drive vehicles is the battery. In cases                           Alternative Business Models: Based on                          many fleet operators. Even extremely large
                      where fleet vehicles have highly predictable                               their access to capital and larger purchasing                  businesses may be unwilling to tie up capital
                      routes with little variation from day to day,                              power, fleet managers may benefit from alter-                  to support substantial volumes of electric
                      batteries can be right-sized to minimize                                   native business models that can help facilitate                drive vehicles.
                      excess capacity, reducing added upfront                                    adoption of electric drive technology.
                      investment in excess energy storage.                                                                                                      Battery Residual Value: Today, estimat-
                                                                                                 Corporate Sustainability: Commercial and                       ing the residual value of used large-format
                                                                                                 government enterprises may also consider                       automotive batteries is an educated guess at
                                                                                                 electric drive vehicles in the context of corpo-               best. Early test data suggests that lithium-ion
                                                                                                 rate sustainability initiatives. GEVs can help                 batteries may still possess 70 to 80 percent of
     13    PRTM analysis; This figure is derived from a composite of data sources,               meet reduced emissions and petroleum con-                      their ability to store energy when they are no
           including R.L. Polk & Co., Automotive Fleet, U.S. General Services                    sumption goals.                                                longer fit for automotive use. But this needs
           Administration, GE Capital, Utilimarc, and others.
     14    Bobit Publishing Company, 2010 Automotive Fleet Factbook (AFB),
                                                                                                                                                                to be borne out by practical experience.
           available online at http://www.automotive-fleet.com/Statistics/.
     15     EC, PRTM interviews with fleet managers.
14    executive summary                                                                                                                                                                                                                                 fleet electrification roadmap       15

                                                                                                                                 FIGURE e5
      PART THREE
                                                                                                                                 Lowest TCO Drivetrain Technology by Year and Segment – Base
      Identifying Fleet Opportunities
                                                                                                                                 CLASS       SEG. NAME                                   MI/YR   2010    2011   2012       2013    2014   2015   2016   2017   2018   2019   2020   2020+

     In order to better understand the business, economic,               The cost effectiveness timeline for each of the elec-   Passenger 1       Sales, Service, Utility                22K
     and cost-saving opportunities presented by electrifica-        tric drive vehicle technologies is improved by optimizing              2       Government                             9K
                                                                                                                                           9       Taxi                                   36K
     tion of vehicle fleets, an economic model was devel-           operations and vehicle characteristics for a number of                 10      Rental / Car Sharing                   31K
     oped for the Fleet Electrification Roadmap. The model          fleet applications. In particular, two options stand out:    Class 1-2   3A    Sales, Service, Utility, Short Haul    19K
     compares the total cost of ownership (TCO) of sample           optimizing the GEV ownership duration to coincide                        4A    Light Government                       6K

     vehicles by vehicle weight class and industry segment          with the battery life; and right-sizing the EV batter-       Class 3     3B    Sales, Service, Utility, Short Haul    23K
                                                                                                                                             4B    Light Government                       6K
     for a given acquisition year. Technologies considered          ies to meet the needs of low mileage fleet applica-
                                                                                                                                 Class 4-5   5     Medium Short Haul                      31K
     were ICE, HEV, PHEV-40, and EV-100. The analysis               tions. These two actions taken by fleet operators would                  6     Medium Utility, Government             8K
     considers vehicle TCO in three cases: a base case, an          advance the time required for PHEVs and EVs to become        Class 6-7   7     Heavy Short Haul                       26K
     optimization case, and a combined optimization plus            the most cost effective solutions by approximately one                   8     Heavy Utility, Government              18K

     policy incentives case.                                        year in a number of segments. Figure E6 presents the                                                                           ICE   HEV    PHEV 40 / EV 100

                                                                    competitiveness timelines for the optimized case.
                                                                         Finally, when current and potential future govern-      FIGURE e6

     Base Case: The base case assumes operators purchase            ment incentives are considered, the cross-over point for     Lowest TCO Drivetrain Technology by Year and Segment – Operations Optimized
     vehicles being offered in the market today at current speci-   GEV cost parity is reached within the next two to three
     fications. Operators make no behavioral changes to reduce      years in all of the commercial segments. The incentives      CLASS       SEG. NAME                                   MI/YR   2010    2011   2012       2013    2014   2015   2016   2017   2018   2019   2020   2020+

     cost. Public policy is not considered in the base case.        assumed for this analysis include $7,500 federal tax cred-   Passenger 1       Sales, Service, Utility                22K
     Operators do not benefit from existing or future subsidies.    its applied for GEV passenger car and class 1-2 trucks;                2       Government                             9K
                                                                                                                                           9       Taxi                                   36K
                                                                    $15,000 tax credits applied to class 3 medium-duty                     10      Rental / Car Sharing                   31K
     Optimized Case: The optimized case assumes fleet oper-         trucks; $20,000 tax credits applies to class 4-5 medium-     Class 1-2   3A    Sales, Service, Utility, Short Haul    19K
     ators can purchase vehicles that fit their needs and that      duty trucks; and $25,000 tax credits applied to class 6-7                4A    Light Government                       6K

     they will use them in the manner that most efficiently         heavy-duty trucks. (The full credits were assumed to be      Class 3     3B    Sales, Service, Utility, Short Haul    23K
                                                                                                                                             4B    Light Government                       6K
     lowers cost. Battery right-sizing and extended ownership       available through 2015, after which they were ramped
                                                                                                                                 Class 4-5   5     Medium Short Haul                      31K
     periods are examples of optimized use. Operators do not        down annually, reaching zero in 2020.)                                   6     Medium Utility, Government             8K
     benefit from existing or future subsidies.                          In all cases, this analysis implies a progression in    Class 6-7   7     Heavy Short Haul                       26K
                                                                    cost competitiveness from ICE, though HEV, to PHEV-                      8     Heavy Utility, Government              18K

     Policy Case: The policy case builds on the optimization        40 and EV-100. Fleet owner behavior and public policy                                                                          ICE   HEV    PHEV 40 / EV 100

     case, adding existing federal government incentives for        can have a dramatic impact on the rate of that progres-
     light-duty vehicles and assuming additional subsidies not      sion, but rising fuel costs coupled with falling electric    FIGURE e7

     currently in law for medium- and heavy-duty trucks.            drive component costs suggest that PHEVs and EVs             Lowest TCO Drivetrain Technology by Year and Segment — Operations Optimized + Government Incentives
                                                                    will increase in competitiveness over time in nearly all
          The model analysis suggests that electric drive vehi-     fleet segments.                                              CLASS       SEG. NAME                                   MI/YR   2010    2011   2012       2013    2014   2015   2016   2017   2018   2019   2020   2020+

     cles are cost competitive in a number of fleet applications                                                                 Passenger 1       Sales, Service, Utility                22K
                                                                                                                                           2       Government                             9K
     today—even when assuming no access to government                                                                                      9       Taxi                                   36K
     subsidies and no change in purchasing or usage patterns.                                                                              10      Rental / Car Sharing                   31K
     In fact, traditional hybrids are a cost-effective replace-                                                                  Class 1-2   3A    Sales, Service, Utility, Short Haul    19K
                                                                                                                                             4A    Light Government                       6K
     ment for internal combustion engine vehicles by 2012
     in most of the segments where driving distance exceeds                                                                      Class 3     3B    Sales, Service, Utility, Short Haul    23K
                                                                                                                                             4B    Light Government                       6K
     20,000 miles per year. This is a result of the relatively
                                                                                                                                 Class 4-5   5     Medium Short Haul                      31K
     small incremental investment for an HEV compared to                                                                                     6     Medium Utility, Government             8K
     an ICE vehicle. In the base case, GEVs begin to emerge as                                                                   Class 6-7   7     Heavy Short Haul                       26K
     the most cost effective solution between 2015 and 2018 as                                                                               8     Heavy Utility, Government              18K

     battery costs begin to fall below $400/kWh.                                                                                                                                                   ICE   HEV    PHEV 40 / EV 100

                                                                                                                                 Source: PRTM analysis
16     executive summary

      PART FOUR
                                                                                                                                       PRIMER
      Policy Recommendations

     The Electrification Coalition has identified a suite of          Fleet Policy Recommendations
     policies to facilitate the adoption of grid-enabled vehi-        Expand the tax credits for light-duty grid-enabled

                                                                                                                                       Electrification of the
     cles by fleet operators. These policies are intended to          vehicles purchased in deployment communities to
     narrowly address the specific obstacles to electric drive        include private sector fleets.
     vehicle adoption that the Coalition identified in the

                                                                                                                                       Transportation Sector
     Electrification Roadmap, adjusted to account for the spe-        Create tax credits for medium- and heavy-duty grid-
     cific challenges faced by fleets. These policies, therefore,     enabled vehicles deployed in fleets with greater than
     are intended to be consistent with the policies outlined         10 vehicles in operation.
     in the Electrification Roadmap, and to support the adop-
     tion of electric drive vehicles in managed fleets. They are      Create clean renewable energy bonds for fleet vehicle
     not intended as a substitute for policies promoted by the        charging infrastructure, and make municipal and
     original Electrification Roadmap.                                regional transit authorities eligible for the bonds.

     Fleet Microsystems                                               Extend the existing tax credit for electric vehicle
     In many cases, fleets function as a microcosm of a trans-        charging infrastructure through 2018 and expand the
     portation ecosystem that could manage many—if not                range of eligible costs.
     all—of the key elements of an electrification ecosystem/
     deployment community. For example, a fleet might                 Allow immediate expensing of GEV purchases and
     consist of numerous vehicles that operate together in a          supporting infrastructure for operators of certain fleets.
     confined geographical space. This is certainly true for
     mid-sized fleets that operate as part of geographically          Make tax credits for the purchase of qualifying grid-enabled
     constrained organizations such as a utility or city govern-      vehicles and related charging infrastructure transferable.
     ment. For national fleets, such as parcel delivery and tele-
     com fleets, at least a subset of their vehicles frequently       Incentivize the establishment of special purpose
     serve individual regions or urban areas. In addition, cen-       entities to facilitate bulk purchasing of electric drive
     trally refueled fleets provide refueling systems for their       vehicles by fleet operators.
     vehicles at a home base or bases, allowing them to closely
     manage the cost and reliability of energy infrastructure         Other Policy Recommendations
     access. Finally, in the case of a fleet attached to large com-   Reinstate and extend the credit for medium- and heavy-
     mercial, industrial, or government entity, the fleet opera-      duty hybrid electric vehicles that utilize advanced batteries.
     tor (or its parent) will likely have a direct relationship
     with the local utility.                                          Establish a program to guarantee the residual value of the
          The various types of financial support that would           first generation of large-format automotive batteries put
     be available to consumers and infrastructure providers           into service between 2010 and 2013.
     in deployment communities should be available to fleet
     operators, who may serve as a kind of electrification            Increase federal investment in advanced battery
     micro-ecosystem—or fleet microsystem. Like electri-              research and development.
     fication ecosystems, GEV fleet microsystems offer the
     opportunity to accelerate the adoption of grid-enabled           Ensure that federal motor vehicle regulations do not
     vehicles by promoting scale and cost reductions in bat-          unnecessarily prohibit the development and deployment
     tery and vehicle production. While fleets ultimately rep-        of cost-effective PHEVs in large trucks.
     resent a smaller market than general personal use autos,
     the obstacles to their adoption of electric drive technol-       Clarify the tax code to ensure that Section 30D GEV tax
     ogy are also smaller in some cases, and can be addressed         credits are available to consumers who purchase a GEV
     by targeted public policies.                                     (without a battery) and lease the battery from the dealer or
                                                                      a third party at the time the vehicle is purchased.
18   primer: electrification of the transportation sector         special section   special section                                                                                             fleet electrification roadmap                19

     ABSTRACT
                                                                                    Overview
     The electric vehicle industry has gained significant                           Two years after Congress passed and the president signed
     momentum over the past several years. Strong                                   the American Recovery Reinvestment Act (ARRA), the
                                                                                    legislation’s impact on transportation electrification is

     investment from the private and public sectors                                 becoming apparent. At the beginning of 2009, the United
                                                                                    States was on a path to develop little if any domestic capac-

     has placed the United States on a path to global                               ity in large-format lithium-ion battery manufacturing.
                                                                                    Strong policy support and a well-entrenched consumer

     competitiveness in advanced battery manufacturing,                             electronics battery industry in Asia along with engrained
                                                                                    high fuel prices in Europe had given other countries a

     and there appears to be strong demand for the first                            significant head start, and the United States was poised to
                                                                                    miss out on a multi-billion dollar global industry.

     wave of grid-powered vehicles. Electric vehicles offer                              Instead, by the end of 2009, $1.98 billion in grants
                                                                                    had been provided to more than 30 awardees for the                         A worker checks production of lithium-ion automotive batteries in a

     the possibility of a transportation sector delinked
                                                                                    manufacture of advanced batteries, battery and drive-                      Johnson Controls Advanced Power Solutions plant.

                                                                                    train components, and other activities, including battery
                                                                                    recycling.1 Nearly 20 other awardees received a total of                   Indiana. By 2012, 30 factories with the capacity to produce
     from oil, which would dramatically improve                                     $356 million in transportation electrification funds.2                     an estimated 20 percent of the world’s advanced vehicle
                                                                                         ARRA also revised electric vehicle tax credits for                    batteries will exist in the United States.4 By 2015, these
     economic and national security while reducing                                  U.S. consumers. Under the new law, U.S. residents who                      facilities could produce enough batteries and compo-
                                                                                    purchase electric drive vehicles that draw power from the                  nents to support 500,000 plug-in hybrid electric vehicles
     emissions. While personal-use passenger vehicles                               grid will be able to claim a base tax credit of $2,500 for a               (PHEVs) and hybrid electric vehicles (HEVs).5
                                                                                    vehicle with a battery of at least five kilowatt hours (kWh)                    At the same time, the first commercial deliveries of
     will continue to be the key market, other targets—                             and $417 dollars per kWh from five upward, capping at an                   a wave of new grid-enabled vehicles (GEVs) are drawing
                                                                                    additional $5,000. The maximum tax credit, therefore, is                   closer. By the end of 2010, Nissan will begin selling its
     such as commercial and government fleets—could                                 $7,500. The credit applies to the first 200,000 vehicles per               all-electric Leaf into select markets, and General Motors
                                                                                    manufacturer, and there is no specific limit on the num-                   will begin selling the Chevy Volt.6 Nissan has announced
     help drive early demand.                                                       ber of qualifying manufacturers.3                                          plans for a wider market launch beginning in 2011.7 Ford
                                                                                         In addition, the Department of Energy (DOE) distrib-                  Motor Company will introduce at least three grid-enabled
                                                                                    uted $300 million in stimulus funds to 25 recipients in the                vehicles by 2012, including the fully electric Transit
                                                                                    Clean Cities Program. The majority of the funds were tar-                  Connect, the Focus EV, and a plug-in hybrid Escape.8
                                                                                    geted toward deploying alternative fuel infrastructure in                  A number of other significant plug-in offerings from
                                                                                    U.S. cities participating in the program. Funds will support               start-up vehicle manufacturers such as Coda, Bright, and
                                                                                    the construction of electric vehicle charging infrastructure
                                                                                    as well as refueling stations for compressed natural gas                   4   The White House, The Recovery Act: Transforming the American
                                                                                    (CNG), liquefied natural gas (LNG), biofuels and other                         Economy through Innovation (August 2010), available at http://www.
                                                                                                                                                                   whitehouse.gov/sites/default/files/uploads/Recovery_Act_Innovation.
                                                                                    alternative-fueled vehicles.                                                   pdf, last accessed October 27, 2010.
                                                                                         Beginning in 3Q 2010, the first stimulus-supported                    5   Id.

                          Want To Learn More?                                       batteries began rolling off assembly lines in Michigan and                 6   Edmunds Daily, “Nissan Leaf Begins Production In Japan, U.S.
                                                                                                                                                                   Deliveries in December,” available at http://blogs.edmunds.com/

                          Visit ElectrificationCoalition.org to                     1   U.S. Department of Energy (DOE), Office of Energy Efficiency and
                                                                                                                                                                   strategies/2010/10/nissan-leaf-begins-production-in-japan-us-
                                                                                                                                                                   deliveries-in-december.html, (October 22, 2010); and ABC News, “New

                          download the Electrification Roadmap                          Renewable Energy (EERE), Recovery Act Awards for Electric Drive
                                                                                        Vehicle Battery and Component Manufacturing Initiative, available at
                                                                                                                                                                   Chevy Ad Campaign to Draw on History, Future,” available at http://
                                                                                                                                                                   abcnews.go.com/Business/wireStory?id=11985920, (October 27, 2010).
                          or request a printed copy.                                    http://www1.eere.energy.gov/recovery/pdfs/battery_awardee_list.pdf,
                                                                                        last accessed October 27, 2010.
                                                                                                                                                               7   Autoblog, “Nissan announces Leaf rollout plans, 8-year battery
                                                                                                                                                                   warranty,” available at http://www.autoblog.com/2010/07/27/nissan-
                                                                                    2   DOE, EERE, Recovery Act Awards for Transportation Electrification,         announces-leaf-rollout-plans-8-year-battery-warranty/, (July 27, 2010).
                                                                                        available at http://www1.eere.energy.gov/recovery/pdfs/battery_        8   Clean Fleet Report, “Ford Plans both Electric Vehicles and Hybrids,”
                                                                                        awardee_list.pdf, last accessed on October 27, 2010.                       available at http://www.cleanfleetreport.com/hybrid-cars/ford-electric-
                                                                                    3   American Recovery and Reinvestment Act (ARRA), Section 1141.               vehicles-plug-in-hybrids/, (October 15, 2009).
20        primer: electrification of the transportation sector                                                                                                                                                        special section   special section                                                                           fleet electrification roadmap            21

     FIGURE P1                                                                                                                                                                                                                          FIGURE p2

     Electrification Industry Recipients of ARRA Awards                                                                                                                                                                                 Currently Announced North American EV and PHEV Production Capacity

     Cell, Battery, and Materials                11     $35 Million                  Electric Drive Component           Advanced Vehicle                                                             Advanced Electric                  400 Thousand
     Manufacturing Facilities                   Toda America, Inc.                  Manufacturing Facilities           Electrification                                                              Drive Vehicle Education            350                                                                                                         Fiat 500EV*
                                                                                                                                                                                                     Program                                                                                                                                        Fisker Nina
      1    $299 Million                          12     $28 Million                   1   $105 Million                   1        $100 Million                                                                                          300
     Johnson Controls, Inc                                                           General Motors Corporation         Electric Transportation                                                       9        $7 Million                                                                                                                           Fisker Karma
                                                Chemetall Foote Corp.
                                                                                                                        Engineering Corp. (ETEC)                                                     West Virginia University           250                                                                                                         Tesla Model S
      2    $249 Million                          13     $27 Million                   2   $89 Million                                                                                                                                                                                                                                               Ford Focus PHEV
                                                                                                                                                                                                     (NAFTC)
     A123 Systems, Inc.                        Honeywell International Inc.       Delphi Automotive                   2        $70 Million                                                                                           200                                                                                                         Ford Focus EV
                                                                                     Systems, LLC                       Chrysler LLC                                                                 10        $6 Million                                                                                                                           Ford Transit Connect
      3    $161 Million                          14     $25 Million                                                                                                                                                                     150
                                                                                                                                                                                                     Purdue University                                                                                                                              Nissan Leaf
     KD ABG MI, LLC (Dow Kokam)               BASF Catalysts, LLC                  3   $63 Million                    3        $45 Million
                                                                                     Allison Transmission, Inc.         South Coast Air Quality                                                       11       $5 Million               100
      4    $151 Million                          15     $21 Million                                                     Management District                                                          Colorado State University
     Compact Power, Inc. (on                   EnerG2, Inc.                        4   $63 Million                                                                                                                                    50
                                                                                                                        (SCAQMD)                                                                                                                                                                                                                    Chevy Volt
     behalf of LG Chem, Ltd.)                                                        Ford Motor Company                                                                                              12        $5 Million                   0
                                                 16     $21 Million                                                      4        $39 Million                                                        Missouri University of
      5    $118 Million                         Novolyte Technologies, Inc.         5   $60 Million                                                                                                                                                   2010        2011              2012             2013             2014              2015
                                                                                                                        Navistar, Inc. (Truck)                                                       Science and Technology
     EnerDel, Inc.                                                                   Remy, Inc.
                                                 17     $13 Million                                                                                                                                  13        $5 Million
      6    $106 Million                                                               6   $45 Million                   Transportation Sector                                                                                           Source: PRTM Estimates
                                                FutureFuel Chemical Company                                                                                                                        Wayne State University
     General Motors Corporation                                                     UQM Technologies, Inc.             Electrification
                                                 18     $11 Million                                                                                                                                  14        $4 Million
      7    $96 Million                          Pyrotek, Inc.                        7   $40 Million                    5        $22 Million                                                                                           Fisker Automotive will bring currently announced North          this market will be challenging. Today, more than 10 years
                                                                                                                                                                                                     National Fire Protection
     Saft America, Inc.                                                              Magna E-Car Systems                Cascade Sierra Solutions                                                                                        American GEV capacity to 150,000 units by 2012 and              after their introduction to U.S. markets, there are just 1.6
                                                 19     $5 Million                                                                                                                                   Association
                                                                                     of America, Inc.
      8    $34 Million                          H&T Waterbury DBA Bouffard                                                                                                                                                             nearly 350,000 units by 2015.9                                  million gasoline electric hybrid cars and light-duty trucks
                                                                                                                        Advanced Vehicle                                                             15        $3 Million
     Exide Technologies with Axion             Metal Goods 
     Power International
                                                                                     Electric Drive                     Electrification +                                                            Michigan Technological                   This investment in advanced battery and electric-         on the road in the United States. Hybrids represent less
                                                                                     Subcomponent                       Transportation Sector                                                        University                         drive vehicle technology by both the public and private         than 1 percent of the light-duty vehicle parc.
      9    $33 Million                          Advanced Lithium-Ion                 Manufacturing Facilities           Electrification                                                                        $3 Million
     East Penn Manufacturing Co.               Battery Recycling                                                                                                                                    16                                 sectors represents a commitment to dealing with a cross-             In some ways, the challenges facing consumer accep-
                                                Facilities                            8   $15 Million                    6        $31 Million                                                        University of Michigan
                                                                                                                                                                                                                                        section of key challenges confronting the United States         tance of grid-enabled vehicles will be greater than those
     Advanced Battery Supplier                                                       KEMET Corporation                  General Motors
                                                20      $10 Million                                                                                                                                  17        $0.72 Million            today. Electric drive technologies—from HEV to PHEV             that faced hybrids—though their potential benefits to the
     Manufacturing Facilities                   TOXCO Incorporated                    9   $9 Million                     7        $30 Million                                                        J. Sargeant Reynolds
                                                                                     SBE, Inc.                                                                                                       Community College                  and EV—are the most technologically mature and cost-            nation are also substantially greater than those of tradi-
      10   $49 Million                                                                                                  Ford Motor Company
                                                                                                                                                                                                     18        $0.5 Million             effective means for confronting many of our nation's            tional hybrids. In addition to vehicle range and associ-
     Celgard, LLC, a subsidiary of                                                  10   $8 Million                     8        $10 Million
     Polypore                                                                      Powerex, Inc.                      Smith Electric Vehicles                                                      City College of San Francisco      most substantial economic, national security, and envi-         ated infrastructure issues, perhaps the most important
                                                                                                                                                                                                                                        ronmental issues. Moreover, infant industry support for         challenge facing widespread adoption of grid-enabled
                                                                                                                                                                                                                                        the domestic battery industry is a first step—albeit a mod-     vehicles will be cost, a factor largely determined by the
                                                                                                                                                                                                                                        est one—toward supporting a renewed manufacturing               battery. Most industry participants and analysts argue
                                                                                                                                                                                                                                        base in the United States. Large-format batteries make          that battery manufacturing costs will fall as the industry
                                                                                                                             15                                                                                                         up one of the more promising components in the emerg-           reaches higher production volumes than currently exist,
                                  1                                                                    5                                   16              13
                                                                                                                                                                                                                  9
                                                                                                                                                                                                                                        ing industries that will employ American workers in the         but the timeframes for such reductions are somewhat
                             15       5                                                                                               6         2
                                                                                                                                                           4         7
                                                                                                                                                                                           18                            14             coming years.                                                   uncertain and depend heavily on early market develop-
                                                                                                                                  7        1
                                                                                                                                                       3        4                  13                             19                          To fully capitalize on this investment, however,          ment. Therefore, particularly in the early stages of indus-
                                                                                                                                  4         1                   2        6
                                                                                                                                               4
                                                                                                                                                       2
                                                                                                                                                                                       10                  9                            electric drive vehicles must ultimately succeed in the          try growth, it will be important to expand the demand-
                                                                                                                                   4                                14
                                                                                                                                                                         20            9
                                                                                                                                                                                                                                        marketplace. The supply-side of the grid-enabled vehicle        side of the industry by targeting a diverse customer base.
                        18                                                                                                             3           2                                                       1
                                           12
                                                                                 6
                                                                                                                                            5          7
                                                                                                                                                                                                17                                      industry has developed rapidly over the past several
                                                                        11
                                                                                                  12
                                                                                                        8   7                      10
                                                                                                                                                                                                                                        years, and the United States has begun to establish a
                                                                                                                              13                                         8                                                              global leadership position, particularly in the design and
                                                                                                                                                                                                12
                                      3                                                                           17                                                     8             10
                                                                                                                                                                                                                                        manufacture of large-format lithium-ion batteries. From
                                                            1                                                                                                   11
                                                                                                                                                                              10           11        9                                  a national perspective, however, the real challenge will be
                                                                                                                                                                                                                                        to accelerate the pace at which new technology can alter
                                                                                                                                                                8
                                                                                                                                                                                                                                        the energy profile of the U.S. transportation sector.
                                                                                                                                                                                   7
                                                                                                                   16                                                                                                                         Technological enthusiasts and other early adopters
           $50-$300                                                                                                                                                                                                                     will likely provide strong demand for the first several hun-
                                  $5-$50
                                                $1-$5                                                                                                                                                                                   dred thousand grid-enabled vehicles. But moving beyond

                      (USD in Millions)
                                                                                                                                                                                                                                        9       PRTM Analysis.
     Source: DOE; EC Analysis
22        primer: electrification of the transportation sector                                                                                   special section       special section                                                                                                                     fleet electrification roadmap              23

                                                                                                                                                                        FIGURE p3

      Oil and the U.S. Economy                                                                                                                                          Liquid Fuel Consumption, Historical and Forecast

      The energy impact of reduced economic and industrial                                      Simply put, oil consumption and the mobility pro-                       25 Million Barrels per Day
                                                                                                                                                                                                                                                                                                                                      Electric Power
      activity—as well as high unemployment—associated with                                vided by petroleum fuels represent core components                                                                                                                                                                                         Res and Comm.
                                                                                                                                                                                                                                                                                                                                      Industrial
      the 2007-2009 recession has been significant. Total U.S.                             of the national economy and American way of life.                            20
                                                                                                                                                                                                                                                                                                                                      Other
      oil consumption averaged 20.6 million barrels per day                                Petroleum meets nearly 40 percent of total U.S. primary                                                                                                                                                                                    Military
                                                                                                                                                                         15                                                                                                                                                           Rail
      (mbd) from 2003 to 2007, equal to approximately 25 per-                              energy needs, more than any other energy source.19                                                                                                                                                                                         Maritime
      cent of the global total.10 High fuel prices and the reces-                          Aggregate consumer expenditures on petroleum prod-                                                                                                                                                                                         Aviation
                                                                                                                                                                         10                                                                                                                                                           Buses
      sionary conditions that began in 2007 drove oil demand                               ucts were as high as 6.4 percent of GDP in 2008 and are on                                                                                                                                                                                 Heavy-Duty
      down by nearly 10 percent—from 20.7 mbd in 2007 to                                   track to be as much as 5 percent of GDP in 2010.20                                                                                                                                                                                         Medium-Duty
                                                                                                                                                                         5                                                                                                                                                            Light-Truck
      18.7 mbd in 2009, its lowest level since 1997.11 In 2008 and                              Most conventional forecasts envision steady                                                                                                                                                                                           Auto
      2009, oil consumption in the United States experienced                               increases in total U.S. petroleum consumption between                         0
      two consecutive years of decline for the first time in 19                            2010 and 2035. Recent Department of Energy (DOE) sce-                                  2007                  2010                2015                  2020                  2025                 2030                    2035
      years.12 Total petroleum supplied is slightly up in 2010 at                          narios project a modest decline in gasoline consumption
      19.3 mbd, but is still well below recent averages.13 As the                          by 2035 relative to pre-recession levels, but most other
      U.S. economy continues to shift away from heavy indus-                               petroleum products are projected to experience signifi-                      FIGURE p4

      try, and as strengthened fuel-economy standards begin                                cant growth. Overall, liquid fuels consumption increases                     Change in U.S. Petroleum Consumption
      to impact the efficiency of new American cars and trucks,                            by 6.8 percent by 2035 in DOE’s outlook.21 Diesel and jet
      many analysts are predicting the advent of ‘peak demand’                             fuel consumption also increase by wide margins. The U.S.                      1.4

      for fuels such as gasoline in the United States.14                                   driving population is expected to increase from approxi-
                                                                                                                                                                         1.3                                                                                                                                                                Diesel
            And yet, the United States is still heavily reliant on                         mately 237 million people in 2007 to 311 million by 2035,
      petroleum. In large part, this is because the United States                          leading to a 13.4 percent increase in light-duty vehicle                      1.2

      still possesses the world’s largest, most dynamic trans-                             miles traveled.22 Freight miles traveled are expected to                                                                                                                                                                                         Jet Fuel
                                                                                                                                                                         1.1
      portation system. At more than 14 million barrels per                                increase by a staggering 51 percent by 2035.23                                                                                                                                                                                                   Total
                                                                                                                                                                               Index: 2007=1
      day, this sector alone consumes more oil than any other                                   Light-, medium-, and heavy-duty trucks repre-                            1.0
                                                                                                                                                                                                                                                                                                                                            Gasoline
      individual national economy in the world. There are                                  sent one of the most significant growth segments for
      more than 230 million light-duty vehicles on U.S. roads                              U.S. oil demand, just as they have for several decades.                      0.9

      today, accounting for approximately 40 percent of total                              Since 1973, 100 percent of the growth in on-road U.S. oil
                                                                                                                                                                        0.8
                                                oil consumption.15                         consumption has been due to rising truck demand—an                                  2007                  2011               2015                  2019                 2023               2027                    2031             2035

94%
                                                Freight      trucks                        increase of 3.9 million barrels per day.24 Though lower
               of energy delivered to the       add   another    8.7                       in absolute numbers, these vehicles tend to be ineffi-
               U.S. transportation system       million    vehicles,                       cient relative to passenger cars and also typically log                      FIGURE p5

               is petroleum-based today.        equaling roughly                           much higher levels of annual vehicle miles traveled.                         Change in U.S. Petroleum Demand, 1973–2008
                                                12 percent of oil                               Continued U.S. oil dependence is neither desirable
                                                                                                                                                                        12 Million Barrels per Day
      demand.16 All told, the transportation sector accounts for                           nor sustainable. Over the past several years, Americans
      71 percent of aggregate U.S. oil consumption.17 Despite                              have been reminded of the serious economic, national                         10                                                                                                                          Medium- and Heavy-Duty Trucks
      significant efforts to drive alternative fuels into the mar-                         security, and environmental costs of consuming and pro-                                                                                                                                                  Buses
                                                                                                                                                                         8
      ketplace, 94 percent of delivered energy in the transport                            ducing petroleum at current levels. Whether or not these
      sector is still petroleum-based today.18                                             costs are reflected in the retail price of gasoline, they are                 6                                                                                                                          Light-Duty Trucks

                                                                                           both real and significant.
      10    BP, plc, Statistical Review of World Energy 2010, at 11, available online at                                                                                 4
            www.bp.com; SAFE Analysis.
                                                                                                                                                                                                                                                                                                    Cars
      11    Id.                                                                                                                                                          2
      12    Id.
      13    DOE, Energy Information Administration (EIA), Weekly Petroleum                 19 BP, plc, Statistical Review of World Energy 2010, at 41.                  0
            Status Report, October 6, 2010, Table 1.                                       20 SAFE analysis based on data from DOE, AEO 2010, Table 3.5; BP, plc.,                                             1973                                                            2008
      14    Securing America’s Future Energy, “SAFE Intelligence Report: Has the              Statistical Review of World Energy 2010; DOE, EIA, October Short Term
            U.S. Reached Peak Demand,” (October 5, 2010), volume 3, issue 12.                 Energy Outlook; and U.S. Bureau of Economic Analysis.                     Source: Figure P3 — DOE, ORNL, TEDB Ed. 29; Figure P4 — DOE, AEO 2010; Figure P5 — DOE, ORNL, TEDB Ed. 29
      15    DOE, EIA, Annual Energy Outlook 2010 (AEO 2010), Table A-7 and                 21 DOE, AEO 2010, Table A-11; SAFE analysis.
            online supplemental table 58, available at http://www.eia.doe.gov/oiaf/        22 Id., online supplemental table 60.
            aeo/aeoref_tab.html, last accessed October 27, 2010.                           23 Id., online supplemental table 67.
      16    DOE, EIA, AEO 2010, online supplemental Table 67.                              24 DOE, Transportation Energy Data Book 2009 (TEDB 2009), Table 1.14,
      17    DOE, Annual Energy Review 2009 (AER 2009), Figure 5.0.                            available at http://www-cta.ornl.gov/data/index.shtml, last accessed on
      18    Id., Table 2.1e.                                                                  October 27, 2010.
You can also read