FISHERIES REPORT: Region IV Coldwater Streams 2020 - Tennessee Wildlife Resources Agency - TN.gov
←
→
Page content transcription
If your browser does not render page correctly, please read the page content below
FISHERIES REPORT:
           Region IV Coldwater Streams
                      2020

Tennessee Wildlife Resources Agency
       Fisheries Report 21-05
Above photo: Rainbow Trout were removed by electrofishing down to this fish passage barrier on
             lower Little Jacob Creek in 2020, extending native Brook Trout distribution by 1.2 km.
             Photo by Jim Habera (TWRA).

Cover photo:   The upper Wilbur tailwater, Carter Co., Tennessee. An abundant wild Brown Trout
               population has developed there much like the one in the nearby South Holston tailwater.
               Photo by Jim Habera (TWRA).

               Visit TWRA’s website at www.tnwidlife.org, where you can learn more about Tennessee’s
               trout fisheries across the state.
FISHERIES REPORT:
                            REGION 4 COLDWATER STREAMS
                                                   2020
                                               ____________

                                               Prepared by:

                                             James W. Habera
                                               Sally J. Petre
                                               Bart D. Carter
                                                    and
                                              Carl E. Williams

                        TENNESSEE WILDLIFE RESOURCES AGENCY
                               FISHERIES REPORT 21-xx
                                               ____________

                                                 June 2021

            This report contains progress and accomplishments for the following TWRA Projects:
                                             "Stream Survey".

Development of this report was financed in part by funds from Federal Aid in Fish and Wildlife Restoration
(Public Law 91-503) as documented in Federal Aid Project FW-6 (4350)

This program receives Federal Aid in Fish and Wildlife Restoration. Under Title VI of the Civil Rights Act of
1964 and Section 504 of the Rehabilitation Act of 1973, the U.S. Department of the Interior prohibits
discrimination on the basis of race, color, national origin, or handicap. If you believe you have been
discriminated against in any program, activity, or facility as described above, or if you desire further
information, please write to: Office of Equal Opportunity, U.S. Department of the Interior, Washington, D.C.
20240.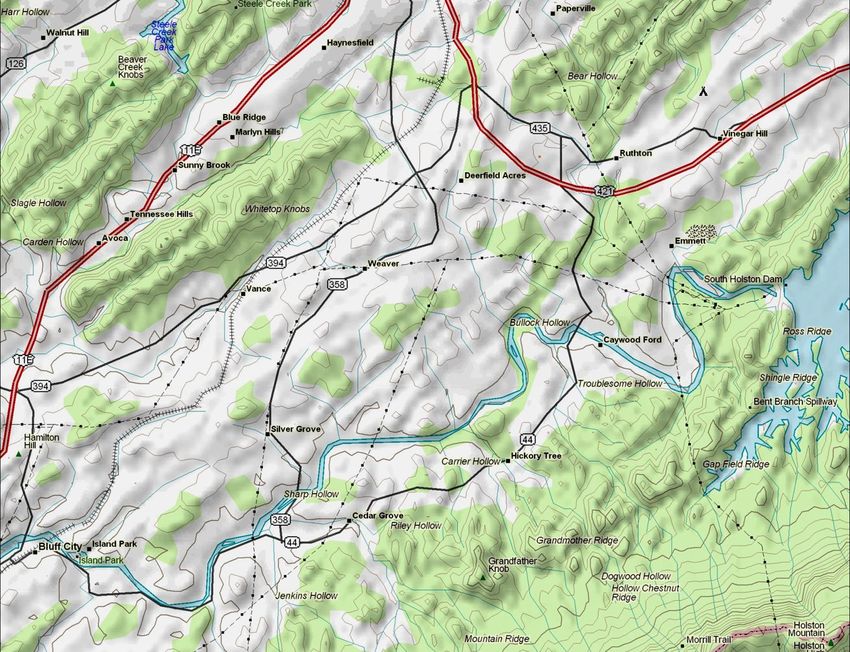
Executive Summary
Wild Trout Monitoring: Two wild trout streams (Left Prong Hampton Creek and Doe Creek) were
quantitatively sampled during 2020 at established monitoring stations. Trout biomass estimates declined in
both streams relative to 2019 and were at the lowest levels observed since monitoring began at Left Prong
Hampton Creek site 3 and Doe Creek. Wild trout abundances have typically remained below long-term
averages since the region-wide drought in 2016.
Sympatric Brook/Rainbow Trout streams: Relative Brook Trout biomass in Birch Branch (80%) increased
to the highest level since monitoring began in 1995. Brook Trout relative abundance (density and biomass)
often increase during and after droughts (Rainbow Trout appear to be more negatively impacted) and the
Birch Branch population has continued to exist in sympatry with Rainbow Trout for over 25 years.
Native Brook Trout Restoration and Enhancement: The restoration project in Little Stony Creek
(Watauga Lake tributary) was evaluated in 2020 and considered successful and complete. Rainbow Trout
removals were completed in Shell Creek, Green Mountain Branch, Trail Fork of Big Creek, and nearly
completed for the Little Jacob Creek enhancement. Native Brook Trout produced by Tennessee Aquarium
Conservation Institute were released in Shell Creek and native fish from three Beaverdam Creek tributaries
were translocated to Green Mountain Branch. No reproduction by the native Brook Trout translocated to
Phillips Hollow in 2019 was observed in 2020, but several adult fish were present. An assessment of the
potential culvert barrier on Right Prong Rock Creek was also initiated by marking Rainbow Trout captured
upstream of the culvert and releasing them in the pool just downstream.
Norris tailwater: Mean CPUE for trout within the PLR (356-508 mm) exceeded 100 fish/h for the first time in
2020 and RSD-14 for Rainbow Trout (80) and Brown Trout (100) in 2020 were the highest observed to date.
Corresponding objectives for the new Norris tailwater management plan (2020-2025) are a mean PLR CPUE
of ≥56 fish/h and RSD-14s of ≥45. Preliminary results for the ongoing research project through the
Tennessee Cooperative Fisheries Research Unit (TN CFRU) at Tennessee Tech University suggest that
natural reproduction by Rainbow Trout contributes substantially to this fishery.
Cherokee tailwater: The Cherokee tailwater was sampled in June and October 2020. The 2020 overall
mean CPUE (12.5 fish/h) was the highest obtained since 2015 and mean CPUE for Rainbow Trout (10.5
fish/h) was higher than for any previous sample. Mean catch rates for larger trout in October 2020 (10.5
fish/h 356 mm and 2.5 fish/h 457) mm were also higher than for any previous sample year. Mean CPUE
for Rainbow Trout 178 mm in June 2020 (18 fish/h) was comparable to the June 2019 sample (15 fish/h)
and while June CPUEs have been somewhat higher than subsequent fall catch rates, they also exhibit
higher variability among sites. There was no coldwater habitat (minimum daily water temperature exceeded
21° C) for 41 days near the dam and 45 days at Blue Spring. Water temperatures in the Cherokee tailwater
typically exceed 21° C in September and return to trout-tolerant levels by mid- to late October.
Wilbur tailwater: Mean CPUE for Brown Trout 178 mm in the upper portion of the tailwater (Stations 1-6)
remained above 300 fish/h in 2020. Mean Rainbow Trout CPUE (all sites) declined to 28 fish/h—the lowest
level observed since the fish kill in 2000. The mean catch rate for larger trout (356 mm) exceeded 20 fish/h
again in 2020 and has been in the 20-27 fish/h range since 2010 (most of the fish in this size range are
Brown Trout). A new angler survey in 2020 indicated that 70% of the 383 anglers interviewed indicated that
they did not fish in the QZ during the past year and only a slight majority (54%) of those who did believed
they caught more trout ≥14 in. there. Regarding the trout fishery in the lower Wilbur tailwater (below Blevins
Bend), 83% rated it as good or excellent and no one assigned a rating fair or poor.
iv
Ft. Patrick Henry tailwater: Mean electrofishing catch rates for trout 178 mm and 356 mm declined
slightly relatively to 2019, although catch rates for the largest trout (457 mm) increased in 2020, with the
Brown Trout CPUE (5 fish/h) exceeding that for any previous sample. RSD-18 for Rainbow Trout increased
to 74 in 2020—the highest level observed to date and well above the objective (20) established in the Boone
and Ft. Patrick Henry Tailwater Trout Fisheries Management Plan. Preliminary results of TN CFRU’s
research indicate that adult-stocked (~254 mm or 10 in.) Rainbow Trout primarily support that fishery and
that these fish can grow to exceed 21 in. within 16 months (an average growth rate of 19.4 mm or 0.76 in.
per month).
Boone tailwater: Mean electrofishing catch rates for Rainbow Trout and Brown Trout ≥178 mm and ≥356
mm were comparable to corresponding 2019 CPUEs. The catch rate for Brown Trout ≥457 mm increased to
the highest level observed to date (9 fish/h)—as was also observed for the Ft. Patrick Henry tailwater. RSD-
18 for Boone tailwater Rainbow Trout decreased to 14 in 2020, although it was unchanged (27) for all trout.
The 2020 values exceed the objectives (10 for Rainbow Trout and 20 for all trout) established in the Boone
and Ft. Patrick Henry Tailwater Trout Fisheries Management Plan. The extended drawdown of Boone
Reservoir (3.1 m below winter pool) continued in 2020 and TVA’s water quality monitoring data from the
tailwater indicated no particular issues with elevated water temperature (>21°C). Dissolved oxygen
depressions into the 3.0 mg/l range were recorded on 13 days during the first three weeks of September.
South Holston tailwater: The mean electrofishing catch rate (CPUE) for all trout 178 mm increased to 420
fish/h in 2020 and mean CPUE for Brown Trout 178 mm (377 fish/h) was the highest observed to date.
Rainbow Trout CPUE has been relatively stable during the past five years at 30-40 fish/h. The overall PLR
catch rate decreased to 10.5 fish/h in 2020 and has typically ranged from 9-15 fish/h since 2010. Brown
Trout RSD declined to 5 in 2020 and has remained in the 3-8 range since 2010, indicating that Brown Trout
population size structures have not maintained the shift toward larger fish that occurred during 2005-2007.
Mean Wr for Brown Trout in the PLR size classes (81.2) was the lowest observed to date. Results for the
2019 South Holston tailwater creel survey indicated that angling pressure (hours) was 35% higher than in
2017 (estimated 86,080 hours) and trips increased by only 16%. Harvest also increased substantially for
both Rainbow Trout and Brown Trout, with the Brown Trout harvest rate increasing to 11% in 2019.
However, Brown Trout harvest likely remains too low to affect abundance based on an average catch of
100,000 fish/year as estimated by the 2014-2019 creel surveys.
v
Table of Contents

                                                                Page
Executive Summary                                                iv
1.   Introduction                                                1
2.   Wild Trout Monitoring                                       4
           Sampling Methods                                      4
                 Doe Creek                                       4
                 Left Prong Hampton Creek                        8
3.   Sympatric Brook Trout / Rainbow Trout Monitoring           12
4.   Native Brook Trout Restoration and Enhancement Projects    13
                Green Mountain Branch                           14
                Little Jacob Creek                              14
                Little Stony Creek                              16
                Shell Creek                                     17
                Phillips Hollow                                 17
                Trail Fork of Big Creek                         17
                Right Prong of Rock Creek                       17
                Stream Temperature Monitoring                   18
5.   Tailwater Monitoring                                       19
           Sampling Methods and Conditions                      19
                Norris (Clinch River)                           20
                Cherokee (Holston River)                        28
                Wilbur (Watauga River)                          39
                Ft. Patrick Henry (S. Fork Holston River)       47
                Boone (S. Fork Holston River)                   54
                South Holston (S. Fork Holston River)           61
References                                                      69

                                                    vi
1. Introduction

     The Tennessee Wildlife Resources Agency (TWRA) manages trout fisheries in a variety of waters in
Tennessee including streams, tailwater rivers, and reservoirs, providing a popular and important set of
angling opportunities. The Agency’s current statewide trout management plan (TWRA 2017) features
management goals and strategies designed to manage stocked trout and conserve wild trout and their
habitat while providing a variety of angling experiences. The most recent U.S. Fish and Wildlife Service
(USFWS) survey providing demographic and economic data for trout angling for Tennessee (2011),
estimated that 105,000 resident and non-resident anglers (age 16 or older) fished for trout in Tennessee
(Maillett and Aiken 2015). They made an estimated 1.4 million trips spending an estimated total of $53
million and represented 15% of Tennessee anglers (Maillett and Aiken 2015). A statewide survey by the
University of Tennessee in 2012 also indicated that 15% of Tennessee’s anglers fished for trout, making
an average of 15 trips (averaging 4 hours) that year (Schexnayder et al. 2014). Most of those anglers
targeted trout in hatchery-supported fisheries.

    Accordingly, while TWRA management emphasizes habitat preservation and maintenance of wild
stocks where they occur, artificially propagated trout are essential for managing substantial portions of the
coldwater resource. Nearly 2 million trout are produced or grown annually at five state (TWRA), one
municipal (Gatlinburg), and two federal (USFWS) facilities to be stocked in Tennessee’s hatchery-
supported fisheries (Roddy 2020). Nearly half of those trout are stocked in Region IV waters, with 52% of
those fish used to support tailwater fisheries, 27% used to provide reservoir fisheries, and 21% used for
smaller streams, winter trout program fisheries, etc.

    The Blue Ridge physiographic province of eastern Tennessee contains about 1,000 km (621 mi) of
coldwater streams inhabited by wild (self-sustaining) populations of Rainbow Trout Oncorhynchus mykiss,
Brook Trout Salvelinus fontinalis, and Brown Trout Salmo trutta. Wild trout occur in 9 of Region IV’s 21
counties (primarily those that border North Carolina; Figure 1-1). Most of Region IV’s wild trout resource
is within the U.S. Forest Service's (USFS) 253,000-hectare (625,000-acre) Cherokee National Forest
(CNF) with about 30% on privately owned lands and includes some of the State's best wild trout streams.
Many streams with unregulated flows can support trout fisheries but are limited by marginal summer
habitat or levels of natural production insufficient to meet existing fishing pressure. TWRA provides or
supplements trout fisheries in 34 such streams in Region IV by annually stocking hatchery-produced
(adult) Rainbow Trout. Some stocked steams (e.g., Beaverdam Creek, Doe Creek, Laurel Fork, and Doe
River) do support excellent wild trout populations as well, but the moderate stocking rates employed are
considered to pose no population-level problems for the resident fish (Meyer et al. 2012).

    Brook Trout are Tennessee's only native salmonid and once occurred at elevations as low as 490 m
(1,600 ft.) in some streams (King 1937). They currently occupy about 225 km (140 mi) in 110 streams, or
about 24% of the stream length supporting wild trout outside Great Smoky Mountain National Park.
Brook Trout occur allopatrically (no other trout species are present) in 42 streams totaling 71 km (44 mi.),
representing 31% of the Brook Trout resource. Another 14 streams have waterfalls or man-made barriers
that maintain Brook Trout allopatry in most of the 38 km (23 mi.) of habitat they provide.

     Cold, hypolimnetic releases from five Tennessee Valley Authority (TVA) dams in Region IV (Norris,
Ft. Patrick Henry, South Holston, Wilbur, and Boone) also support year-round trout fisheries in the
tailwaters downstream (Figure 1-1). The habitat and food resources that characterize these tailwaters
provide for higher carrying capacities and allow trout to grow larger than they normally do in other
streams. Tailwaters are typically stocked with fingerlings (100-150 mm) in the early spring and adult fish
(229-305 mm) throughout the summer. Stocked adult trout supplement the catch during peak angling
                                                      1
season and by fall, fingerlings have begun to enter these fisheries, meaning they are a catchable size.
Natural reproduction entirely supports the Brown Trout fisheries in the South Holston and Wilbur
(Watauga River) tailwaters. Recent surveys have also shown natural reproduction by Rainbow Trout may
be significant in those tailwaters, as well as in Norris tailwater. The Holston River below Cherokee
Reservoir (Figure 1-1) also supports a tailwater trout fishery, although high water temperatures (>21° C)
during late summer and early fall limits survival and carryover. No fingerlings are stocked there, as few
would survive the thermal bottleneck to recruit to the fishery. More research is needed to determine what
fish are currently contributing to the trout fisheries in our tailwaters.

    One of TWRA’s core functions identified in its Strategic Plan (TWRA 2014) is outdoor recreation, and
a primary objective is to maintain or improve programs that promote high user satisfaction for hunters,
anglers, and boaters. Tennessee’s trout anglers recently expressed a high level of satisfaction (89%)
with the Agency’s management of the State’s trout fisheries (Schexnayder et al. 2014). Maintaining this
level of satisfaction will require effective management of existing resources and opportunities—as well as
development of new ones. TWRA’s statewide trout management plan for 2017-2027 (TWRA 2017)
addresses how these goals can be accomplished. This plan includes management guidelines for
Tennessee’s native Brook Trout, particularly considering new genetics data being acquired for all Brook
Trout populations. Acquisition of trout population status and dynamics data from streams and tailwaters
through standardized stream survey techniques (e.g., abundance trends and size structures, etc.) will
also continue to be an important strategy for managing these fisheries.

                                                    2
Region IV Trout Streams, Tailwaters, and Reservoirs

Figure 1-1. Locations of selected Region IV trout fisheries managed by TW

                                                                      3
2. Wild Trout Monitoring

          Region IV personnel sample wild trout streams annually to obtain abundance and population trend
data. This annual monitoring began in 1991 and has provided valuable information for management of
Tennessee’s wild trout resources, (e.g., regulation changes). Two wild trout streams were quantitatively
sampled during the 2020 field season (June-October). Stream sampling was reduced from previous years
because of Coronavirus restrictions on crew size (from TWRA and partner agencies) and reallocation of
priorities within the work unit. Previous reports contained large amounts of survey data and stream history.
Stream survey data are still being collected as usual; however, details can be found either in previous reports
or in the TWRA TADS database. Archived reports can be found on the ‘Fishing’ tab of the TWRA website at:
https://www.tn.gov/content/tn/twra/fishing/trout-information-stockings.html#FisheriesReport.

                                             Sampling Methods

         Wild trout stream sampling was conducted with battery-powered backpack electrofishing units
employing inverters to produce AC outputs to complete TWRA’s standard protocol for three-pass depletion.
Output voltages were 125-600 VAC, depending upon water conductivity. Stocked Rainbow Trout,
distinguishable by dull coloration, eroded fins, atypical body proportions, and large size (usually >229 mm),
compared to wild Rainbow Trout were noted on data sheets but were not included in any analyses. Stream
sample sites are part of TWRA Region 4 annual monitoring.

       Removal-depletion data were analyzed with MicroFish 4.0 for Windows (http://microfish.org/). Trout
≤90 mm in length were analyzed separately from those >90 mm due to their lower catchabilities (Lohr and
West 1992; Thompson and Rahel 1996; Peterson et al. 2004; Habera et al. 2010), making separate analysis
necessary to avoid bias. These two groups also roughly correspond to young-of-the-year (YOY or age-0)
and adults.

Doe Creek

          Site location and sampling details are provided in Tables 2-1 and 2-2. Doe Creek remains one of
Tennessee’s most productive wild trout streams. The seasonal hatchery-supported trout fishery in Doe Creek
is popular (Habera et al. 2004), but management of this stream features the outstanding wild trout
population. Citizens inquired during the 2020 sample if a fish kill related to the “white sludge” that came
down the creek the previous weekend was being investigated (although they did not report seeing any dead
fish). Trout abundance was lower in 2020 than in any previous sample (Figures 2-1 and 2-2), but other
species did not appear to be notably affected (Figure 2-3), thus it seems unlikely there was a significant fish
kill at the monitoring site.

                                                      4
Doe Creek
Table 2-1. Site and sampling information for Doe Creek in 2020.
Location Site 1
Site code 420202001
Sample date 10 September
Watershed Watauga River
County Johnson
Lat-Long 36.42709 N, -81.93725 W
Elevation (ft) 2,210
Land ownership Private
Fishing access Good
Description Site ends at small dam just below Lowe spring.
Effort
Station length (m) 134 m 978 m2
Electrofishing units 3 125 V AC
Habitat
Mean width (m) 7.3
Canopy cover (%) 45
Est. % site pool/riffle 37 63
Habitat assessment score 155 (suboptimal)
Water Quality
Flow (cfs; visual) 19.03 normal
Temperature (C) 17.1
pH 7.9
Dissolved oxygen (mg/L) NM
Alkalinity (mg/L CaCO3) 75
Table 2-2. Fish population abundance estimates (with 95% confidence limits) for the monitoring station
on Doe Creek sampled in 2020.
Total Pop. Size Biomass (kg/ha) Density (fish/ha)
Species Catch Est. C.I. Est. C.I. Est. C.I.
RBT ≤90 mm 0 0 (0-0) 0.00 (0.00-0.00) 0 (0-0)
RBT >90 mm 50 51 (47-55) 30.38 (28.02-32.79) 521 (481-562)
Creek Chub 3 3 (3-3) 0.02 (0.02-0.02) 31 (31-31)
Blacknose Dace 163 172 (162-182) 5.92 (5.63-6.33) 1759 (1656-1861)
Fantail Darter 35 38 (30-46) 0.66 (0.52-0.80) 389 (307-470)
Mottled Sculpin 402 550 (468-632) 17.43 (14.83-20.03) 5624 (4785-6462)
C. Stoneroller 101 104 (98-110) 42.75 (40.28-45.21) 1063 (1002-1125)
N. Hogsucker 4 4 (0-9) 5.21 (0.00-11.73) 41 (0-92)
5Doe Creek
6000
RBT ≤90 mm Mean = 2,367 fish/ha
5000 RBT >90 mm
Density (fish/ha)
4000
3000
2000
1000
0
'93 '94 '95 '96 '97 '98 '99 '00 '01 '02 '03 '04 '05 '06 '07 '08 '09 '10 '11 '12 '13 '14 '15 '16 '17 '18 '19 '20
Year
150
RBT ≤90 mm Mean = 63.87 kg/ha
125 RBT >90 mm
Biomass (kg/ha)
100
75
50
25
0
'93 '94 '95 '96 '97 '98 '99 '00 '01 '02 '03 '04 '05 '06 '07 '08 '09 '10 '11 '12 '13 '14 '15 '16 '17 '18 '19 '20
Year
Figure 2-1. Annual abundance estimates at the Doe Creek monitoring station.
6Number of Fish 20
15
10
5
0
25 51 76 102 127 152 178 203 229 254 279 305 330
Length Class (mm)
Figure 2-2. Length-frequency histogram for the 2020 Doe Creek sample.
60
2016
50 2017
2018
Biomass (kg/ha)
40 2019
2020
30
20
10
0
Rainbow Creek Chub Blacknose Fantail Mottle Central Northern White Snubnose
Trout Dace Darter Sculpin Stoneroller Hogsucker Sucker Darter
Figure 2-3. Biomass (kg/ha) of fishes in Doe Creek samples from 2016-2020.
7Left Prong Hampton Creek
Site location and sampling details are provided in Tables 2-3 and 2-4. Upper Left Prong Hampton
Creek’s Brook Trout population has made it one of Tennessee’s premier Brook Trout fisheries. Since fully
established in 2003, mean Brook Trout biomass for the upper station (71 kg/ha) has historically exceeded
the statewide average for other streams (about 21 kg/ha), and was comparable to the mean biomass for the
previous Rainbow Trout population (81 kg/ha). However, mean abundance has declined over the last ten
years, particularly in sites 1 (Rainbow Trout) and 3 (Figure 2-4) and few fish ≥203 mm size were present in
2020 (Figure 2-5). Brook Trout biomass at site 3 in 2020 was the lowest observed since this population was
established in 2002 (Figure 2-4). Decreasing abundance trends may be related to decreasing quantity and
quality pools, thus a more detailed habitat analysis may be useful. Deployment of instream water
temperature loggers show a maximum water temperature in 2019 and 2020 to be no more than 17.7 C, well
below the thermal maximum for Brook Trout, thus temperature is not a contributing factor to decreasing
abundance of Brook Trout. Management of Left Prong Hampton Creek should continue to feature its native
Brook Trout fishery and development of this important database should continue through annual monitoring
at all three sites.
Table 2-3. Site and sampling information for Left Prong Hampton Creek in 2020.
Location Site 1 Site 2 Site 3
Site code 420201601 420201602 420201603
Sample date 6-Aug 6-Aug 5-Aug
Watershed Watauga River Watauga River Watauga River
County Carter Carter Carter
Lat-Long 36.15132 N, -82.05324 W 36.14673 N, -82.04917 W 36.13811 N, -82.04473 W
Elevation (ft) 3,080 3,240 3,560
Stream order 2 2 2
Land ownership State (Hampton Cove) State (Hampton Cove) State (Hampton Cove)
Fishing access Good Good Good
Begins ~10 m upstream of Begins 50 m upstream of Begins 880 m upstream of
Description
the first foot bridge. the fish barrier. the upper end of Site 2.
Effort
Station length (m) 106 m 477 m² 94 489 m² 100 480 m²
Electrofishing units 1 350 V AC 1 400 V AC 1 400 V AC
Habitat
Mean width (m) 4.5 5.2 4.8
Canopy cover (%) 70 90 95
Aquatic vegetation scarce scarce scarce
Estimated % site riffle NM NM NM NM NM NM
Habitat assessment score 158 (suboptimal) 157 (suboptimal) 159 (suboptimal)
Water Quality
Flow (cfs; visual) NM normal NM normal NM normal
Temperature (C) 17.5 17 14.8
pH 6.5 6.5 6.5
Conductivity (μS/cm) 22 18.4 12.7
Alkalinity (mg/L CaCO3) NM NM NM
8Table 2-4. Fish population abundance estimates (with 95% confidence limits) for the monitoring stations on
Left Prong Hampton Creek sampled 5 and 6 August 2020.
Site 1
Total Pop. Size Biomass (kg/ha) Density (fish/ha)
Species Catch Est. C.I. Est. C.I Est. C.I.
RBT ≤90 mm 39 42 (34-50) 4.34 (3.49-5.14) 881 (713-1048)
(16.33-
RBT >90 mm 14 14 (10-18) 17.15 294 (210-377)
22.04)
BKT ≤90 mm 1 1 (1-1) 0.13 (0.13-0.13) 21 (21-21)
BKT >90 mm 0
Blacknose dace 57 69 (50-88) 6.00 (4.30-7.56) 1,447 (1048-1845)
Fantail darter 7 8 (0-19) 0.57 (0.00-1.35) 168 (0-398)
Site 2
BKT ≤90 mm 24 24 (21-27) 2.21 (1.93-2.48) 491 (429-552)
(12.71-
BKT >90 mm 30 32 (26-39) 15.62 654 (532-798)
19.06)
Site 3
BKT ≤90 mm 30 37 (21-53) 3.13 (1.79-4.53) 771 (438-1104)
(26.07-
BKT >90 mm 46 46 (43-49) 27.88 958 (896-1021)
29.71)
9Left Prong Hampton Creek
Density Site 1 Biomass
10,000 160
Mean = 4130 Mean = 55.0 BKT ≤90 mm
140 BKT >90 mm
8,000 RBT ≤90 mm
120
RBT >90 mm
100
6,000
80
4,000 60
40
2,000
20
0 0
'94 '96 '98 '00 '02 '04 '06 '08 '10 '12 '14 '16 '18 '20 '94 '96 '98 '00 '02 '04 '06 '08 '10 '12 '14 '16 '18 '20
Site 2
10,000 160
Mean = 2,145 Mean = 26.1
140
8,000
120
Fish/ha
kg/ha
6,000 100
80
4,000
60
40
2,000
20
0 0
'96 '98 '00 '02 '04 '06 '08 '10 '12 '14 '16 '18 '20 '96 '98 '00 '02 '04 '06 '08 '10 '12 '14 '16 '18 '20
Site 3
10,000 160
Mean = 4,076 Mean = 70.7
140
8,000
120
6,000 100
80
4,000 60
40
2,000
20
0 0
'96 '98 '00 '02 '04 '06 '08 '10 '12 '14 '16 '18 '20 '96 '98 '00 '02 '04 '06 '08 '10 '12 '14 '16 '18 '20
Year
Figure 2-4. Abundance estimates for Left Prong Hampton Creek sites 1-3 in 2020.
10Left Prong Hampton Creek
Site 1
40 Rainbow--2020
n = 52
30
63 -274 mm
20
10
0
25 51 76 102 127 152 178 203 229 254
Site 2
40
Number of Fish
2020 Brook Trout
30
n = 54
63 -186 mm
20
10
0
25 51 76 102 127 152 178 203 229 254
Site 3
40
2020 Brook Trout
30 n = 76
60 -223 mm
20
10
0
25 51 76 102 127 152 178 203 229 254
Length Class (mm)
Figure 2-5. Length-frequency histogram for trout from the 2020 Left Prong Hampton Creek sample.
113. Sympatric Brook Trout / Rainbow Trout Monitoring
Brook Trout historically occurred in most coldwater streams in eastern Tennessee and were the
dominant salmonids before the 1900s. Logging and the resulting habitat loss between 1903 and 1937 and
the introduction of nonnative Rainbow Trout (beginning in 1910) and Brown Trout (after 1950) negatively
affected wild Brook Trout populations (Kelly et al. 1980; Larson and Moore 1985; Larson et al. 1995).
Monitoring between 1900 and 1977 caused managers to be concerned that Rainbow Trout might displace
native Brook Trout (Kelly et al. 1980).
Moore et al. (1983) and Larson and Moore (1985) showed that Rainbow Trout suppress Brook Trout
abundance and reproduction, and Whitworth and Strange (1983) showed that Rainbow Trout dominate
where they coexist with Brook Trout. Allopatric Brook Trout range decreased by 60% between 1935 and
1977 in the Great Smoky Mountains National Park, apparently because of nonnative salmonid (primarily
Rainbow Trout) encroachment (Larson and Moore 1985).
Managers have long been concerned about range expansion by Rainbow Trout and associated loss
of Brook Trout distribution, although Larson et al. (1995) found that Brook Trout density and distribution ebbs
and flows despite the presence of Rainbow Trout. Additionally, Strange and Habera (1998) found that
Rainbow Trout were not generally affecting downstream limits of Brook Trout distribution in Tennessee
streams. Our long-term monitoring supports these previous study results and suggests that Brook Trout
distribution and relative abundance in Tennessee streams may respond more directly to environmental
factors such as droughts and floods. Consequently, Rainbow Trout may have no particular competitive
advantage and Brook Trout can coexist for many years at some general equilibrium.
Relative Brook Trout abundance (% density and % biomass) has been monitored in four streams
(elevations range from 640-984 m) with sympatric Rainbow trout populations since 1995. The objective is to
determine if, over time, Rainbow Trout can displace Brook Trout in these populations, or if variations in
relative abundance are attributable to stochastic events. Previous coldwater reports, detailing site location
and other data can be found at https://www.tn.gov/content/tn/twra/fishing/trout-information-
stockings.html#FisheriesReport.
Results for Birch Branch (one of the four monitoring streams) indicate that while total biomass has
decreased over the past five years, relative Brook Trout biomass exceeded 80% in 2020—the highest level
observed since monitoring began in 1995 (Figure 3-1). Brook Trout density and biomass often increase
during droughts, as Rainbow Trout appear to be more negatively impacted. Extended drought, however, may
eliminate Brook Trout populations in marginal habitats regardless of the presence of any sympatric
salmonids (Habera et al. 2014).
100 100
Brook Trout relative abundance
Total trout biomass (kg/ha)
90 Total biomass % BKT (density) % BKT (biomass) 90
80 80
70 70
60 60
50 50
40 40
Drought
30 Drought 30
20 Drought 20
10 10
0 0
'95 '96 '97 '98 '99 '00 '01 '02 '03 '04 '05 '06 '07 '08 '09 '10 '11 '12 '13 '14 '15 '16 '17 '18 '19 '20
Year
Figure 3-1. Brook Trout and Rainbow Trout relative abundance and abundance estimates over time in Birch Branch.
124. Native Brook Trout Restoration and Enhancement Projects
TWRA’s Native Brook Trout Management Plan (TWRA 2017) includes a list of potential restoration,
enhancement, and reintroduction projects for 2017-2027 developed cooperatively with the USFS. These
projects involve re-establishing native Brook Trout in suitable streams by completely removing any existing
nonnative trout (Tier 1—highest priority) or only initially thinning existing nonnative trout (Tier 2). Tier 2
projects are generally lower priority but provide opportunities to return native Brook Trout to streams or
watershed where they have long been absent. These would be managed as sympatric populations unless
enhancement become feasible. Tier 1 projects involve re-establishing an allopatric native Brook Trout
population and maintaining it as such. Enhancement projects remove Rainbow Trout from an existing
sympatric native Brook Trout population and extend Brook Trout distribution downstream to a natural barrier.
Native Brook Trout restoration projects are listed in Tables 4-1 and 4-2 and work completed in 2020 is
summarized in the following stream accounts. These projects involve the efforts of several partners
including TWRA Region 3, the USFS, USFWS, Trout Unlimited, the Tennessee Division of Forestry,
Tennessee Aquarium Conservation Institute (TNACI), and private landowners.
Table 4-1. Potential Tier 1 Brook Trout restoration and enhancement projects in Region 4. BKT = Brook Trout, RBT = Rainbow Trout
and BNT = Brown Trout.
Species Start Length
Stream Watershed present Barrier elevation (ft) (miles) Comments Status
Green South Fork BKT Yes 3,130 1.0 Barrier may be Translocation
Mountain Holston compromised at complete.
Branch high flow Monitoring in 2021
Little Jacob South Fork RBT/BKT Yes 2,270 1.0 Extending down Translocation and
Creek Holston (2) to USFS Job monitoring complete
Corp. barrier in upper section.
RBT removal
ongoing in lower
section
Phillips Nolichucky BKT Yes 2,230 0.6 Fish from N. Toe Monitoring in 2021 to
Hollow (2) system in NC evaluate additional
translocation needs
Little Paint French None Yes 2,000 1.5 TBD, maybe from In progress—
Creek Broad Smoky Mountain temperature data
National Park obtained in 2020
within the
watershed.
Devil Fork Nolichucky RBT Yes 1,900 0.5 Restore between Not in progress
(3) lower 2 falls; no
fish above upper
falls
Trail Fork French None Yes 2,640 2.2 Use fish from Gulf In progress; RBT
Big Creek Broad Fork tribs.; removal complete;
propagate at BKT translocation
Tellico facility 2021; AOP project in
progress
13Table 4-1. (cont.)
Species Start Length
Stream Watershed present Barrier elevation (ft) (miles) Comments Status
Jennings Nolichucky RBT TBD TBD TBD Use fish from Not in progress
Creek Phillips Hollow;
account for
Round Knob
Branch
Horse Nolichucky RBT TBD TBD TBD Remove RBT if Not in progress
Creek barrier exists;
otherwise move
to Tier 2
Right Nolichucky RBT Yes? 2,220 1.7 Potential barrier Marked and moved
Prong located and RBT below culvert
Rock Creek moved to tier 1 barrier in 2020 to
evaluate its
effectiveness
Table 4-2. Potential Tier 2 Brook Trout re-introduction projects in Region 4.
Species Start Length
Stream Watershed present Barrier elevation (ft) (miles) Comments Current status
Sinking Watauga RBT/BNT No 2,060 1.3 Initially thin No barrier present;
Creek RBT/BNT; include check downstream
Basil Hollow trib. for end of trout
distribution in 2021
Upper Nolichucky RBT No 2,800 1.0 Initially thin RBT Not in progress
Granny
Lewis
Creek
Green Mountain Branch
Five electrofishing passes through Green Mountain Branch since 2018 removed 780 Rainbow Trout
(including 580 age-0 fish). The 2020 effort removed 8 Rainbow Trout—likely remnant age-0 fish from 2019—
near the barrier. Another electrofishing pass will be completed in 2021 to check for any remaining Rainbow.
Ninety-one Brook Trout were translocated from Beaverdam Creek tributaries into the upper third of Green
Mountain Branch in August 2020 (22 from Chalk Branch, 26 from Maple Branch, and 43 from Birch Branch).
A pelvic fin clip was taken from each fish and preserved to characterize the genetic composition of the
founding population. The presence of age-0 Brook Trout during the 2021 electrofishing effort will verify that
these fish successfully spawned during 2020. Additional Brook Trout will be translocated from the three
donor streams if necessary.
Little Jacob Creek
Brook Trout have been established in Little Jacob Creek down to the culvert at the USFS road (FR
4002) crossing (Habera et al. 2019). Another barrier (2-m high concrete structure) ~1.2 km further
downstream on USFS Job Corp property (36.56090 N, -81.97489 W; elevation 1,913 ft) was evaluated in
142019 to determine the feasibility of extending Brook Trout range downstream to that point. Temperature
loggers deployed at the barrier (lowest point downstream) in August 2019 determined that the 7-day mean
(MEANT) and maximum (MAXT) temperatures were 20.0°C and 20.8°C, respectively, for August and 19.9°C
and 20.8°C for September. These were below the upper thermal tolerance limits for MEANT and MAXT
(23.3°C and 25.4°C, respectively for Brook Trout) as described by Wehrly et al. (2007). Thus, the
temperatures are marginal in this section. Fish community composition near the barrier includes Central
Stoneroller Campostoma anomalum, Creek Chub Semotilus atromaculatus, and Blacknose Dace
Rhinichthys atratulus, suggesting that water temperature may be marginal for Brook Trout.
Three electrofishing passes between the FR 4002 culvert and the Job Corps barrier in 2020 removed
224 Rainbow Trout (24 age 0, 131 sub-adults, 69 adults). Brook Trout had already begun to colonize this
reach and several adult and age-0 fish were captured during each removal effort in 2020. Another
electrofishing pass will be made in 2021 to ensure removal of Rainbow Trout in this reach. Future plans to
improve habitat may include replacement of the FR 4002 culvert (original barrier) with a bottomless arch
structure designed to allow for aquatic organismal passage (AOP) and habitat improvement in the lower
portion of the creek to increase pool frequency and depth. These habitat improvements may help increase
Book Trout abundance in that area.
A monitoring site (Table 4-3) was established about 100 m upstream of the FR 4002 road crossing in
2020 to evaluate development of the Brook Trout population in that area. Although few Brook Trout were
present (Table 4-4), 3 of the 11 fish captured were age 0, indicating Brook Trout are reproducing.
Table 4-3. Site and sampling information for Little Jacob Creek in 2020.
Location Site 1
Site code 420202501
Sample date 17 July
Watershed South Holston
County Sullivan
Lat-Long 36.55127 N, -81.96718 W
Elevation (ft) 2319
Land ownership Public
Fishing access Good
Begins at tail end of large pool ~ 30
Description m upstream of first trail crossing.
Effort
Station length (m) 124 422 m2
Electrofishing units 2 350 V AC
Habitat
Mean width (m) 3.4
Canopy cover (%) 85
Est. % site pool/riffle 42 58
Habitat assessment score 159
Water Quality
Flow (cfs; visual) 1.12 normal
Temperature (C) 19.2
pH NM
Dissolved oxygen (mg/L) NM
Alkalinity (mg/L CaCO3) NM
15Table 4-4. Abundance estimates for Little Jacob Creek in 2020.
Total Pop. Size Biomass (kg/ha) Density (fish/ha)
Species Catch Est. C.I.. Est. C.I. Est. C.L.
RBT ≤90 mm 0 0 (0-0) 0 (0-0) 0 (0-0)
RBT >90 mm 1 1 (1-1) 1.63 (1.63-1.63) 24 (24-24)
BKT ≤90 mm 3 3 (3-3) 0.45 (0.45-0.45) 71 (71-71)
BKT >90 mm 8 8 (8-8) 11.09 (11.09-11.09) 190 (190-190)
Little Stony Creek
A native Brook Trout restoration project was initiated in a 1.4-km reach of Little Stony Creek
(tributary to Watauga Lake) during fall 2014 (Habera et al. 2015a). Native Brook Trout propagated at TNACI
using adults from Left Prong Hampton Creek were stocked in 2014, 2015, 2018 and 2019. A three-pass
depletion sample at the monitoring site (Table 4-5) in the lower portion of the restoration zone (290 m
upstream of the falls) was completed in 2020 to determine Brook Trout abundance and successful
reproduction (presence of age-0). Age-0 Brook Trout were present and abundance estimates were 23.9
kg/ha and 983.4 fish/ha (Table 4-6). The pre-removal (2014) Rainbow Trout biomass estimate for this site
was 23 kg/ha. Given the presence of age-0 Brook Trout and the comparability of current Brook Trout
biomass with pre-removal Rainbow Trout biomass, this Brook Trout restoration project can be considered
successful and complete.
Table 4-5. Site and sampling information for Little Stony Creek in 2020.
Location Site 1
Site code 420201201
Sample date 22 June
Watershed Watauga River
County Johnson
Lat-Long 36.29183 N, -82.06678 W
Elevation (ft) 2410
Land ownership Public
Fishing access Good
Between waterfall and road
Description crossing
Effort
Station length (m) 150 600 m2
Electrofishing units 2 500 V AC
Habitat
Mean width (m) 4
Canopy cover (%) 65
Est. % site pool/riffle 44 56
Habitat assessment score 162
Water Quality
Flow (cfs; visual) NM normal
Temperature (C) 16.7
pH 7.0
Dissolved oxygen (mg/L) NM
Alkalinity (mg/L CaCO3) NM
16Table 4-6. Abundance estimates for Little Stony Creek in 2020.
Total Pop. Size Biomass (kg/ha) Density (fish/ha)
Species Catch Est. C.I. Est. C.I. Est. C.I.
BKT ≤90 mm 8 13 (0-46) 0.68 (0.00-2.38) 217 (0-767)
BKT >90 mm 45 46 (42-50) 23.22 (21.21-25.25) 767 (700-833)
Blacknose Dace 53 111 (0-240) 10.93 (0.00-24.80) 1,850 (0-4000)
Shell Creek
Shell Creek is a tributary to the Doe River in Cater County and is separated from Left Prong
Hampton Creek by Big Ridge. Shell Creek was sampled in 2019 as part of a USFS BioBlitz and Rainbow
Trout were the only fish present in the upper portion of the stream. A potential fish passage barrier was
identified at 36.147231 N, -82.030345 W, just downstream of the USFS boundary, and suitable trout habitat
extends ~1 km upstream. Consequently, Shell Creek was added to the native Brook Trout restoration
program as a Tier 1 stream (will be managed as a Tier 2 stream if the barrier is ineffective).
A two-pass Rainbow Trout removal effort in August 2019 removed 64 fish (including 47 age-0), while
a third pass in May 2020 removed 13 more Rainbow Trout which were allupstream of the culvert in a 2021 follow-up survey, it would indicate that it is ineffective barrier and potentially
would limit the success of a Brook Trout restoration project in this stream.
Stream Temperature Monitoring
Temperature loggers were deployed in several streams across elevational and geographical
gradients to collect baseline data during June-September and determine suitability for Brook Trout
restoration (Little Paint Creek). Average monthly temperature remained below 20°C in each case, although
maximum temperature can exceed 20°C in Little Paint Creek during August and September (Figure 4-1).
Additional stream temperature data will be collected during 2021.
Average Monthly Temperature (C)
20
Left Prong Hampton
19 Briar Creek
Little Paint Creek
18 Little Stony Creek
Rocky Fork
Temperature (C)
17 Trail Fork
16
15
14
13
12
June July August September
Maximum Monthly Temperature (C)
22
21
20
Temperature (C)
19
18
17
16
15
14
13
12
June July August September
Figure 4-1. Average monthly and maximum monthly temperatures (°C) for trout streams monitored in 2020.
185. Tailwater Monitoring
Region IV’s tailwater trout fisheries present unique fishery management problems and opportunities
for which no standard solutions or practices apply (Hill 1978). The problems inherent in sampling tailwaters,
such as their large size, fluctuating flows, and the lack of any practical means for maintaining closed
populations, make it difficult at best to collect quantitative data from these systems. Natural reproduction is
variable and most tailwater trout fisheries are substantially hatchery-supported, with abundances and
size/age-class densities related to stocking rates. However, Brown Trout fisheries in the South Holston and
Wilbur tailwaters are self-sustaining and substantial natural reproduction by Rainbow Trout has been recently
been documented in the Norris, Wilbur, and South Holston tailwaters. TWRA prefers to manage for wild
trout fisheries where possible (TWRA 2017), thus management strategies in these tailwaters (e.g., fingerling
Rainbow Trout stocking) will be adjusted accordingly.
Six Region IV tailwater trout fisheries (Norris, Cherokee, Wilbur, Ft. Patrick Henry, Boone, South
Holston; Figure 1-1) are currently monitored annually. Sampling is conducted each year in late February or
March (except Cherokee) to provide an assessment of the overwintering trout populations present before
stocking begins. The Cherokee tailwater (Holston River) monitoring stations are currently sampled in the
summer (June) and fall (October/November). Trout survival over the summer is the most important issue for
the Cherokee tailwater fishery, so sampling is timed to document trout abundance before and after the high
water temperatures (daily minimum >21° C) that occur in late summer/early fall. Catch per unit effort (CPUE)
for each species at each site (fish/h), as well as means for each tailwater, are calculated annually to monitor
trout abundance trends. Annual monitoring samples have occasionally been cancelled (e.g., 2015 at Norris,
2008-09 at Wilbur, and 2008 at South Holston) because appropriate flows were unavailable.
Trout fishery management plans are in place for the Norris (Habera et al. 2020), Wilbur (Habera et
al. 2015b), Boone/Ft. Patrick Henry (Habera et al. 2018), and South Holston (Habera et al. 2015c) tailwaters.
The Wilbur and South Holston management plans are scheduled to be updated in 2021.
Sampling Methods and Conditions
Sampling effort for the Norris, Cherokee, South Holston, and Wilbur tailwaters annually consists of
600-s (pedal time) runs at each of 12 monitoring stations with boat-mounted electrofishing systems (120
pulses/s DC, 4-5 amps). The smaller Ft. Patrick Henry and Boone tailwaters are sampled using 900-s runs at
4 stations. Electrofishing on these tailwaters (except Norris) is conducted during the day with generation by
one unit (turbine). Only trout are collected during these efforts. Tailwater sampling conditions and effort are
summarized below:
Table 5-1. Tailwater sampling conditions and effort.
Year annual
monitoring
Tailwater began Sample time Stations Approximate flow Total effort (h)
Norris 1999 Night 12 114 m3/s (4,000 cfs) 2.0
Cherokee 2003 Day 12 114 m3/s (4,000 cfs) 2.0
Ft. Patrick Henry 2002 Day 4 88 m3/s (3,100 cfs) 1.0
Wilbur 1999 Day 131 71 m3/s (2,500 cfs) 2.0
Boone 2009 Day 4 88 m3/s (3,100 cfs) 1.0
South Holston 1999 Day 12 71 m3/s (2,500 cfs) 2.0
1An extra site was added in 2010 to help evaluate the Quality Zone; effort there (600 s) is not included in total effort.
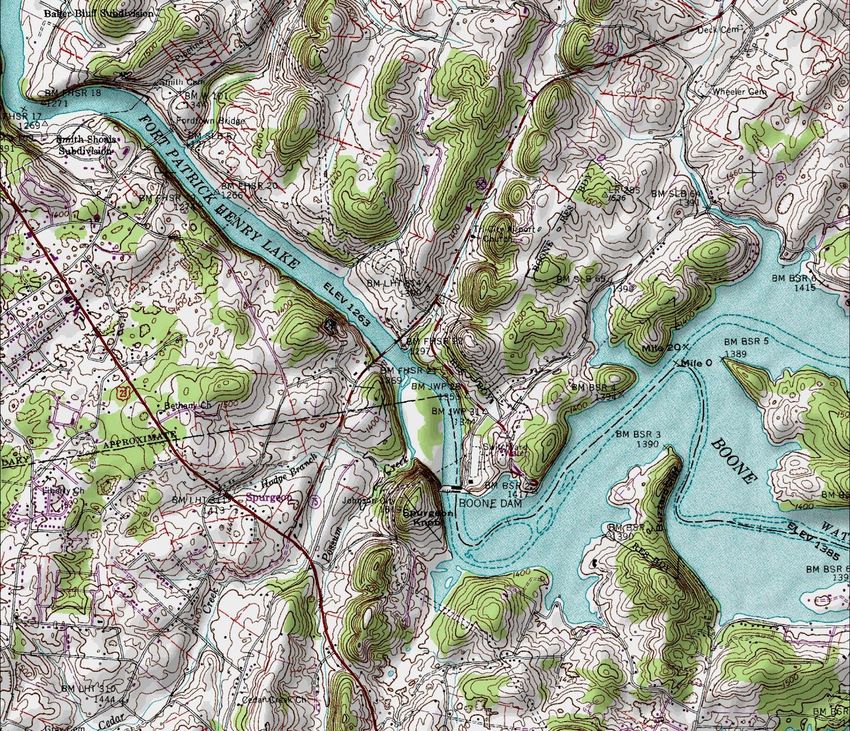
19Norris (Clinch River)
Catch and Length Frequency
The 12 Norris tailwater monitoring stations (Figure 5-1) produced 331 trout weighing nearly 183 kg in
2020 (Table 5-2; Figure 5-2). The catch included 312 Rainbow Trout and 41 Brown Trout. No Brook Trout
were captured, although 12,000 were
stocked in 2019. Trout in the 356-508
mm (14-20 in.) protected length range
(PLR) were present at all 12 monitoring
stations (Table 5-1). The 199 14-20 in.
Rainbow Trout was the highest catch in
the PLR obtained to date. Overall, 63% of
Rainbow Trout and 58% of Brown Trout
>178 mm were within the PLR (Figure 5-
2). The remainder of the Brown Trout
catch was >508 mm. Several sub-adult
(152-208mm) Rainbow Trout without
adipose fin clips were captured, indicating
that these fish represent natural
reproduction.
CPUE
A PLR Rainbow Trout from the 2020 Norris tailwater sample.
The mean electrofishing CPUE
for all trout ≥178 mm in 2020 (164 fish/h) was within the typical post-PLR range (150-200 fish/h; Figure 5-3).
Brown Trout CPUE (9 fish/h) was the lowest observed to date and is likely related to reduced stocking rates
(20,000/year) in 2018 and 2019. Mean CPUE for trout within the PLR (356-508 mm) has increased
substantially since 2008 and exceeded 100 fish/h for the first time in 2020 (Figure 5-3). The PLR catch rate
objective for the new Norris tailwater management plan is a mean of ≥56 fish/h for 2020-2025 (Habera et al.
2020).
RSD-14
Relative stock density for trout ≥356 mm or 14 in. (RSD-14) has improved for both Rainbow Trout
and Brown Trout post-PLR, with values often exceeding 50 and seldom below 30 since 2011(Figure 5-4).
These consistently higher RSD-14 values indicate that trout population size structures have shifted toward
larger fish (≥14 in.)—which is what PLR regulations are intended to accomplish. An RSD-14 value of 50
indicates that 50% of all stock-size trout—those at least 10 in. in length—are 14 in. or larger and is
representative of a trout fishery with an exceptional proportion of larger fish. RSD-14 for Rainbow Trout (80)
and Brown Trout (100) in 2020 were the highest observed to date (Figure 5-4). The RSD-14 objective for the
new Norris tailwater management plan is ≥45 for 2020-2025 (Habera et al. 2020).
Stocking
Norris typically has the highest trout stocking rate of any Tennessee tailwater (about 237,000/year).
Annual allocations have been 197,000 Rainbow Trout (160,000 4-5 in. fingerlings and 37,000 9-12 in.
adults), 20,000 Brown Trout (6-8 in. sub-adults) and 20,000 Brook Trout (8-9 in. adults). Stocking rates have
varied recently (Figure 5-5) because of Dale Hollow National Fish Hatchery’s (DHNFH) need to stock fish
early in 2016 and 2017 (poor fall water quality) and inconsistent availability of Brook Trout. Additionally, the
2019 (111,000) and 2020 (18,000) fingerling stocking rates were reduced to accommodate marking these
20fish (fin clips/coded wire tags) for the TN CFRU research project. Only 18,000 fingerlings could be marked in
March 2020 before Covid-19 restrictions at DHNFH curtailed that effort.
Angler Surveys
Results for the 2019 Norris tailwater creel survey (Black 2020) indicated that trout anglers made an
estimated 8,813 trips comprising 26,729 hours of effort. Both estimates are substantially below the 2017
survey estimates (13,346 trips; 42,770 hours) and less than half the effort estimated in 2015 (56,427 hours;
17,348 trips). Consequently, estimated catch for 2019 declined to 21,546 fish (54% Rainbow, 36% Brown,
10% Brook)—about half of the 2017 level. Interestingly, harvest (5,118 fish; 53% Rainbow, 36% Brown, 11%
Brook) was relatively unchanged from 2017 and overall harvest rate (24%) was higher than it has been since
2013 (22%). Anglers reported in 2019 that 35% of Rainbow Trout and 14% of Brown Trout they caught were
in the PLR, while about 2% of Rainbow Trout and 1% of Brown Trout were above the PLR (>20 in.). Another
angler survey was conducted on the Norris tailwater in 2020 and results will be available for the 2021 report.
Research
Preliminary results of the 2019-2020 TN CFRU study indicate that the Norris tailwater Rainbow Trout
population is primarily supported by natural reproduction. This is based on the high proportion of unmarked
juvenile fish (see photo below) captured relative to marked hatchery-origin fish (all 129,000 fingerlings
stocked during 2019-2020 were marked).
Because further analysis is needed to
accurately determine survival, recruitment,
and growth, this project will be extended for
another two years to track PIT tagged fish,
increase capture rates of marked fish, and
explore fish movement throughout the
tailwaters. As part of the ongoing TN CFRU
project, 100,000 fingerling Rainbow Trout
are scheduled to be marked for stocking in
March 2021.
Management Recommendations
TWRA’s current management goal
for the Norris tailwater is to maintain the
A wild Rainbow Trout yearling from the 2020 Norris tailwater sample enhanced quality of trout angling
(adipose fin present). opportunities available to the variety anglers
who enjoy this fishery (Habera et al. 2014).
The PLR regulation, established in March 2008, has successfully increased abundances of 14-20-inch trout,
improving trout population size structures (RSD-14), and maintained these improvements. Anglers have
recognized this by overwhelmingly expressing their support for the PLR during the 2013 and 2019 creel
surveys. Accordingly, the PLR regulation continues to be the primary strategy for attaining the goal in the
2020-2025 Norris tailwater management plan. Future stocking of fingerling Rainbow Trout may be
substantially reduced or eliminated given the results TN CFRU’s research and TWRA’s policy to manage for
wild trout where feasible (TWRA 2017; Hatchery-Supported Fisheries Goal 1: Optimize use of hatchery
trout, Strategy 1). The notable increase in Rainbow Trout reproduction may reflect the increased number of
potential spawners resulting from the PLR regulation.
21Norris Tailwater
1
5 4 2
3
6
7
8
9
10
11
12
Figure 5-1. Locations of the Norris tailwater (Clinch River) monitoring stations.
22Table 5-2. Catch data for the12 electrofishing stations on the Norris tailwater sampled 18 March 2020.
% %
Total Size range Total Abundance Abundance
Station Species catch (mm) weight (g) (number) (weight)
1 Rainbow 11 369-506 9,780 65 59
Brown 6 475-498 6,736 35 41
Totals 17 16,516 100 100
2 Rainbow 50 185-561 29,859 100 100
Totals 50 29,859 100 100
3 Rainbow 34 155-486 18,146 97 96
Brown 1 431 768 3 4
Totals 35 18,914 100 100
4 Rainbow 12 231-433 5,804 100 100
Totals 12 5,804 100 100
5 Rainbow 18 292-438 9,571 100 100
Totals 18 9,571 100 100
6 Rainbow 13 203-436 5,360 81 53
Brown 3 463-601 4,720 19 47
Totals 16 10,080 100 100
7 Rainbow 24 185-501 12,184 86 68
Brown 4 449-552 5,648 14 32
Totals 28 17,832 100 100
8 Rainbow 31 185-498 13,136 100 100
Totals 31 13,136 100 100
9 Rainbow 27 183-497 12,926 100 100
Totals 27 12,926 100 100
10 Rainbow 23 197-473 8,935 85 53
Brown 4 497-760 8,083 15 47
Totals 27 17,018 100 100
11 Rainbow 27 177-495 10,634 100 100
Totals 27 10,634 100 100
12 Rainbow 42 165-532 19,186 98 94
Brown 1 505 1,300 2 6
Totals 43 20,486 100 100
Total Rainbow Trout 312 155-561 155,521 94 85
Total Brown Trout 19 431-760 27,255 6 15
Overall 331 182,776 100 100
23Norris Tailwater
70
Rainbow Trout 356-508 mm PLR Rainbow Trout
60 n = 312
Number of Fish
Brown Trout 155-561 mm
50
Brown Trout
40 n = 19
431-760 mm
30
20
10
0
102 127 152 178 203 229 254 279 305 330 356 381 406 432 457 483 508 533 559 584 610 635 660 686 711 737 762
Length Class (mm)
Figure 5-2. Length frequency distributions for trout from the Norris tailwater monitoring
stations in 2020.
24Norris Tailwater
Trout 178 mm (7 in.)
350
Rainbow
300
Brown
All
CPUE (fish/h)
250
200
150
100
50
0
'96 '97 '98 '99 '00 '01 '02 '03 '04 '05 '06 '07 '08 '09 '10 '11 '12 '13 '14 '15 '16 '17 '18 '19 '20
Year
Trout 356-508 mm (14-20 in.)
140
120 Rainbow
Brown
CPUE (fish/h)
100
All
80 Mgt. Plan objective for 2020-25
(mean = ≥56 fish/h for all trout)
60
40
20
0
'96 '97 '98 '99 '00 '01 '02 '03 '04 '05 '06 '07 '08 '09 '10 '11 '12 '13 '14 '15 '16 '17 '18 '19 '20
Year
Figure 5-3. Mean trout CPUEs for the Norris tailwater samples. Bars indicate
90% confidence intervals. The 356-508 mm PLR regulation was
established in 2008.
25Norris Tailwater
100
90 Rainbow
Brown
80
70 Mgt. Plan objective for 2020-25
(RSD-14 ≥45 for Rainbow and
60 Brown Trout)
RSD-14
50
40
30
20
10
0
'96 '97 '98 '99 '00 '01 '02 '03 '04 '05 '06 '07 '08 '09 '10 '11 '12 '13 '14 '15 '16 '17 '18 '19 '20
Year
Figure 5-4. Relative stock densities for Norris tailwater Rainbow Trout and
Brown Trout ≥14 in. (RSD-14) for 1996-2020.
26Norris Tailwater
350
Fingerling Rainbow
300 Adult Rainbow
Number stocked (x1000)
Brown Trout
250 Brook Trout
200
150
100
50
0
'10 '11 '12 '13 '14 '15 '16 '17 '18 '19 '20
Year
Figure 5-5. Trout stocking rates for the Norris tailwater (2010-2020). The 2019 and
2020 fingerling Rainbow Trout stocking rates (111,000 and 18,000) were
reduced to accommodate marking (fin clips coded wire tags) for the TN
CFRU research project.
27Cherokee (Holston River)
Catch and Length Frequency
The 12 Cherokee tailwater monitoring stations (Figure 5-6) produced 36 trout (35 Rainbow Trout, 1
Brown Trout) weighing over 35 kg on 18 June 2020 (Table 5-3). Water temperature on that date averaged
15.8° C. Rainbow Trout were predominantly in
the 356 to 432-mm size classes, although five
fish >500-mm were also captured (Figure 5-7).
The 4 November 2020 sample produced 25
trout (21 Rainbow Trout, 4 Brown Trout)
weighing just over 22 kg (Table 5-3); water
temperature averaged 19.2° C during that
effort. Most Rainbow Trout captured in
November were in the 381-457 mm size
classes and none were >500 mm, although two
Brown Trout >500 mm were captured (Figure
5-7).
CPUE
The Cherokee tailwater near Blue Spring.
While the October 2019 Cherokee
tailwater sample produced one of the lowest mean catch rates (trout 178 mm) to date (1.5 fish/h), the 2020
mean CPUE (12.5 fish/h) increased to its highest level since 2015 and mean CPUE for Rainbow Trout (10.5
fish/h) was higher than for any previous sample (Figure 5-8). Mean catch rates for larger trout in November
2020 (10.5 fish/h 356 mm and 2.5 fish/h 457) mm were also higher than for any sample year (Figure 5-8).
The mean catch rate for Rainbow Trout 178 mm (18 fish/h) for June 2020 was similar to the June
2019 sample (15 fish/h, Figure 5-9). Mean summer (June) CPUEs have been somewhat higher than
subsequent fall catch rates, but also exhibit higher variability among sites (wider 90% confidence intervals;
Figure 5-9). Given the annual thermal bottleneck in this tailwater, it is unsurprising that trout catch rates
decline from June through the late October/early November.
Stocking
The Cherokee tailwater received 28,500 adult (mean length, 248 mm) Rainbow Trout and 9,000 sub-
adult (mean length, 173 mm) Brown Trout in 2020 (Figure 5-10). Stocking rates during the past five years
have averaged 29,000 adult Rainbow Trout and 27,000 sub-adult Brown Trout annually.
Water Temperature Monitoring
Hourly water temperature data were collected (Onset TidbiT® v2 loggers) at the monitoring sites near
Cherokee Dam and at Blue Spring during June-November 2020. Maximum daily water temperature near
Cherokee Dam was ≥21° C for 54 days (25 August-18 October; Figure 5-11) but did not reach 25° C.
Minimum daily water temperature reached 21° C on 4 September and remained ≥21° C from 8 September--
16 October (total of 41 days; Figure 5-11), thus there was no coldwater habitat during that period. Based on
2005-2020 data, there is typically no coldwater habitat (daily minimum water temperature is ≥21° C) near the
dam during 13 September-12 October (30 days; Figure 5-11).
28Maximum daily water temperature at the Blue Spring site (13 km below Cherokee Dam) was ≥21° C
for 71 days in 2020 (consistently from 22 August-27 October; Figure 5-12) but reached 25° C only once (21
September). Minimum daily water temperature reached 21° C on 30 August and remained ≥21° C through
14 October (45 days; Figure 5-12), thus there was no coldwater habitat during that period. Based on 2003-
2020 data, there is typically no coldwater
habitat (daily minimum water temperature
is ≥21° C) at Blue Spring during 31
August-12 October (43 days; Figure 5-
12).
Fall electrofishing catch rates
appear to be generally correlated with
summer/early fall water temperatures,
which in turn are related to variability in
flow from Cherokee Dam during March-
August. Above average precipitation in
some years (e.g., 2003, 2013, 2017-
2019) results in higher average flows
from Cherokee Dam, earlier depletion of
cold water stored in the reservoir, and
unsuitably warm tailwater temperatures
A large (500 mm) well-conditioned Rainbow Trout from the June 2020 for long periods of time. The reverse is
Cherokee tailwater sample. true during dry years such as 2007 and
2008. Consequently, there is a relatively
strong (R2 = 0.50) inverse relationship (2nd order polynomial) between the number of days where minimum
water temperature was ≥22° C at the Blue Spring site and the overall electrofishing catch rate (log10-
transformed +1) for all trout 178 mm (Figure 5-13). There is also a relatively strong (R2 = 0.56) positive
relationship (2nd order polynomial) between water temperatures (expressed as the number of days where the
minimum was ≥21° C at Blue Spring) and mean flow during March-August (Figure 5-14). Extended periods
of low flows and high air temperatures in late summer (e.g., in 2016) can also raise water temperatures to
levels that impact trout survival.
Management Recommendations
Trout in the Cherokee tailwater are subject to a lack of coldwater habitat (i.e., minimum daily
temperatures exceed >21° C during September and part of October each year. Consequently, most trout
survive less than a year, even with a relatively low harvest rate (Habera et al. 2015a). Some fish do find
thermal refugia such as groundwater upwellings or cooler tributaries (Baird and Krueger 2003) and survive
through at least one thermal bottleneck to produce the large (≥457 mm) fish that are captured in most
monitoring samples.
Current management policy excludes stocking fingerling Rainbow Trout because of their low
recruitment potential and avoids stocking fish during July-October because of high water temperatures (>21°
C) during those months. General, statewide angling regulations for trout are appropriate for maintaining this
fishery. Special regulations (minimum size or slot limits) would offer little benefit, as few fish protected by
such measures would survive the next summer thermal bottleneck. Summer and fall electrofishing at the 12
existing monitoring stations, annual water temperature monitoring, and periodic angler surveys (a new
survey will be conducted during 2021) should continue. This information will be used to develop a trout
fishery management plan for this tailwater. Objectives of the plan will likely focus on determining optimal
annual stocking rates and evaluating survival and growth of various stocked cohorts.
29You can also read