First half results 2021 - Domino's pizza group plc 3 August 2021 - Domino's Pizza Group plc
←
→
Page content transcription
If your browser does not render page correctly, please read the page content below
first half results 2021
    Domino’s pizza group plc
      26 weeks ended 27 June 2021

           3 August 2021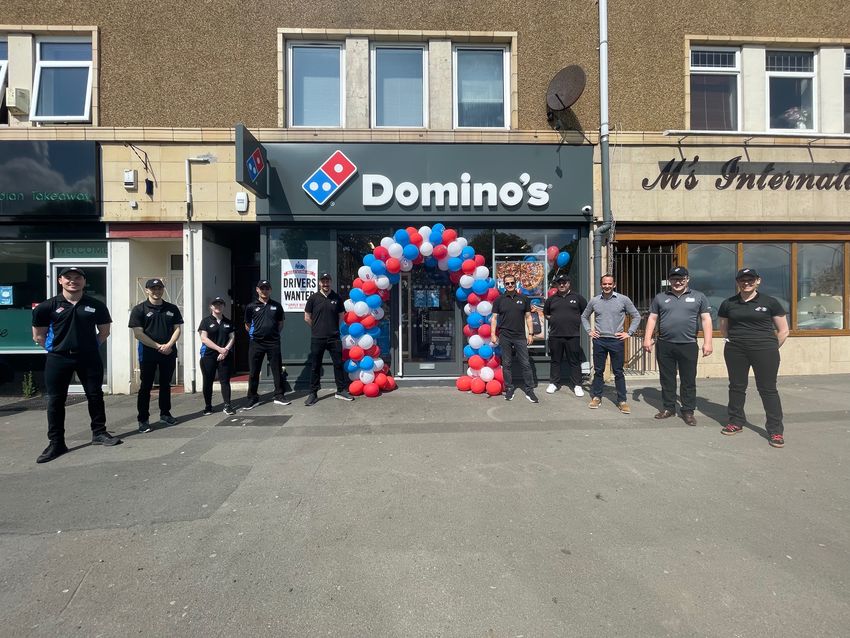
AGENDA

1. Overview – Dominic Paul, CEO

2. Financial performance – Neil Smith, CFO

3. Strategic & operational update – Dominic Paul, CEO

4. Q&A
First half performance
• Strong trading performance in the first half
• Translated into good earnings, cash generation and shareholder returns
– Interim dividend of 3.0p
– Additional £35m share buyback announced – totalling £80m announced since March ‘21
• Disposal of non-core international businesses – nearing completion
• Executing on our strategic objectives
– System sales up 20%
– UK&I online represents 92% of system sales
– New integrated media campaign ‘Domin-Oh-Hoo-Hoo’
– New App launched with Group Ordering, Deal Wizard & In Car Collection
– 13 new store openings – plans for up to 30 this year
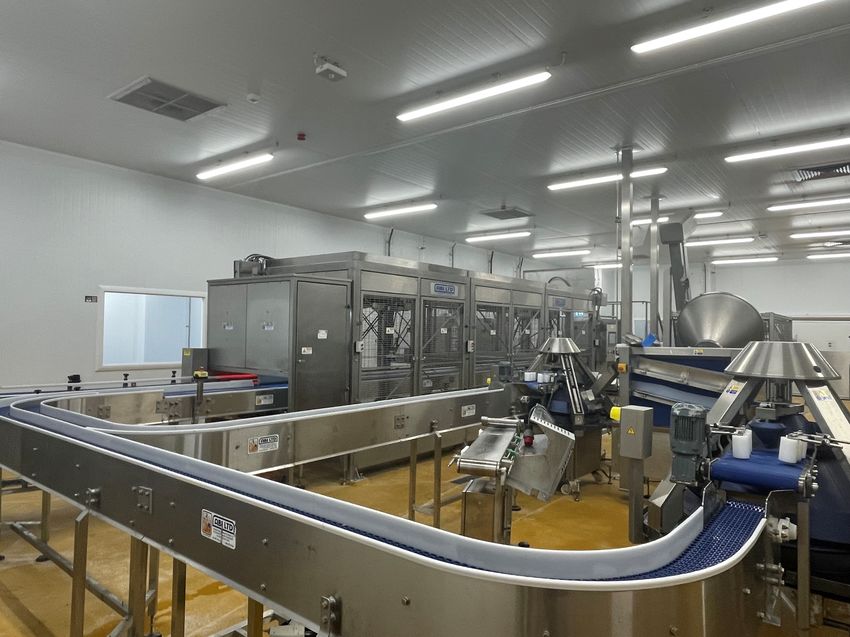
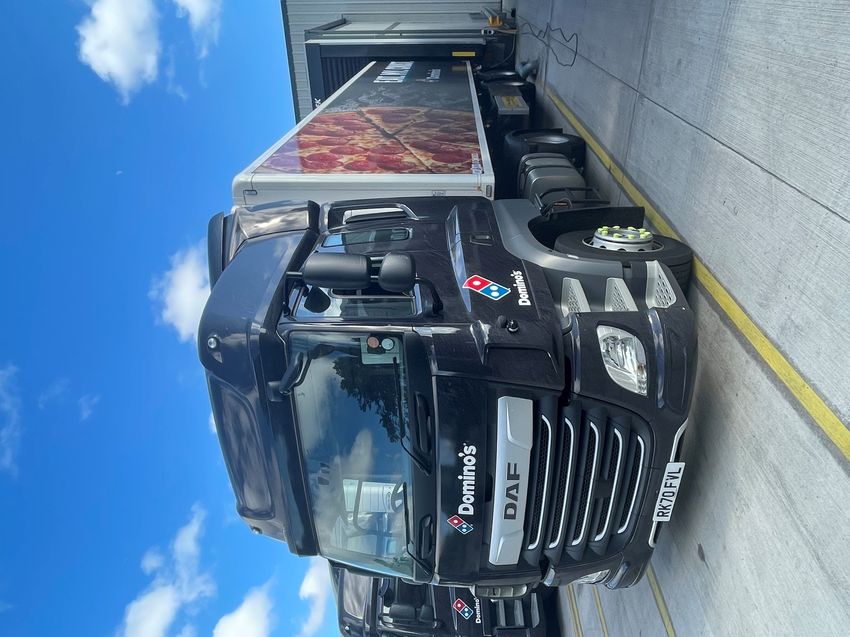
– New supply chain centre in Cambuslang, Scotland
3 Half year results 2021
AGENDA

1. Overview

2. Financial performance – Neil Smith, CFO

3. Strategic & operational update

4. Q&A

INCOME STATEMENT
    Strong trading delivering underlying earnings growth

    Underlying, £m                                    H1 21        H1 20           FY 20
    UK & Ireland EBITDA                               69.5           57.6          120.8    • UK&I EBITDA growth of £11.9m
                                                                                              assisted by:
    Depreciation & Amortisation                       (7.8)           (8.1)        (16.5)
                                                                                                – Covid-19 related costs reduced to
    UK & Ireland EBIT                                  61.7          49.5          104.3          £1.5m (H1 20: £6.2m)
    German Associate EBIT                               2.2            1.9           4.7        – VAT benefit of £3.7m (H1 20: nil)
    Finance costs                                      (3.1)         (3.8)          (7.8)
                                                                                            • Underlying PBT growth of £13.2m
    Profit before tax                                 60.8           47.6          101.2
                                                                                            • Underlying EPS of 10.7p, up 23%
    Taxation                                          (11.0)         (7.7)         (16.9)
    Profit after tax                                  49.8           39.9           84.3

    Underlying basic EPS (p)                           10.7           8.7           18.2

    Adoption of IFRS 16 applied in all reporting periods – see Appendix slide 33

5   Half year results 2021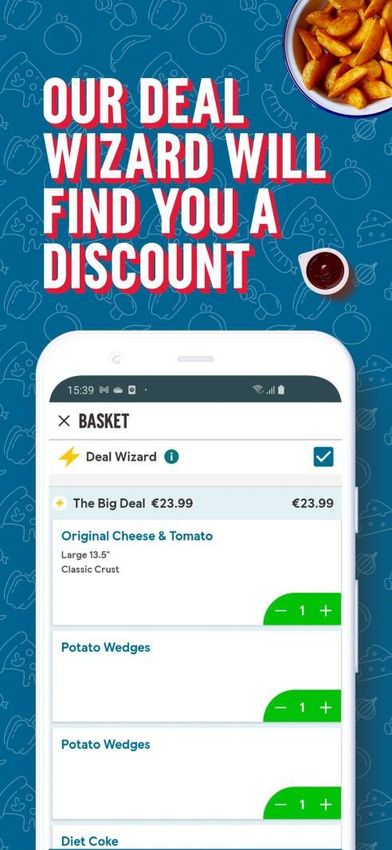
COVID-19 RELATED COSTS & VAT BENEFIT
    Included within underlying items

    £m                               H1 21   H1 20   FY 20
    Supply chain operations           0.9      2.1     4.6   • Covid-19 related costs significantly
                                                               reduced in H1 21
    Franchisee support                0.3      3.4     3.7
                                                                 – Expected to decline further in H2
    Charges to supply chain EBITDA     1.2     5.5     8.3
    Community                         0.3      0.7     0.7   • UK VAT rate reduction since July
                                                               2020 generated benefit sufficient to
    Total                              1.5     6.2     9.0     more than offset Covid-19 costs in H1
    VAT benefit                       3.7     0.0      3.6       – Expected to decline in H2 as VAT
                                                                   rate due to increase to 12.5% from
                                                                   1 October 2021
                                                             • No government loans or funding; no
                                                               furlough; repaid business rates on
                                                               corporate stores

6   Half year results 2021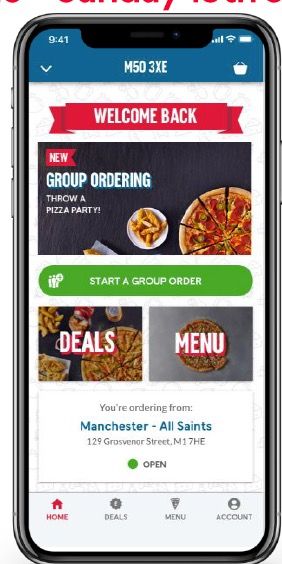
ANALYSIS OF UK & IRELAND EBITDA
    Strong performance

    £m                                   H1 21    H1 20    FY 20
    Supply chain centre EBITDA           52.6     48.4      99.3    Key impacts on EBITDA are:
    Net royalties                         21.1     17.7     37.8    • Supply chain EBITDA includes £1.2m
    Net overheads, realty & incentives   (15.1)   (14.3)   (31.9)
                                                                      of Covid-19 related costs
    UK corporate stores                    2.1     0.3       1.6    • Increase in net royalties from 19.6%
    UK investments                        5.4       1.9      6.1      increase in system sales
    IFRS 16 leases                        3.4       3.6      7.9    • Net overheads increase driven by
    Underlying UK & Ireland EBITDA       69.5     57.6     120.8        – Investments in people to add
                                                                          capability and expertise
                                                                        – Investment in data analytics and
                                                                          marketing effectiveness
                                                                    • Corporate stores and JVs trading
                                                                      well through year with some
                                                                      support from VAT reduction

7   Half year results 2021
FRANCHISEE trading
    Healthy profits for the system
                                      H1 21*      H1 20*   FY 20*
    Store level                                                     • Franchisees and their teams continue to
                                                                      operate effectively and safely in
        Average EBITDA               £154k         £85k    £229k
                                                                      constantly changing environment
        EBITDA margin                 25%            16%    20%
                                                                    • VAT rate cut in UK in July 2020
    Franchisee level
                                                                      continues to assist profitability – effect
        Average EBITDA               £134k         £66k    £191k      will diminish from October 2021
        EBITDA margin                  21%           12%     17%
                                                                    • Strong community support and job
    * UK only
                                                                      creation

    Source: Extracted from submissions from franchisees
    Not subject to audit by DPG or externally

8   Half year results 2021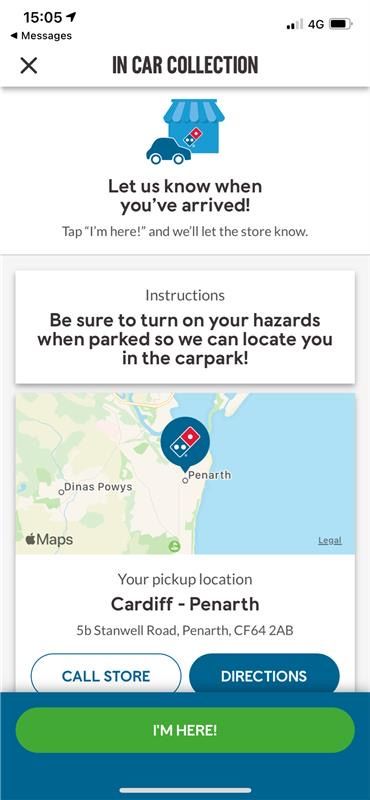
SALES PERFORMANCE
    Reported system sales growth aided by effect of UK VAT reduction

    £m                                           H1 21         H1 20   % change
    UK system sales                             716.5          597.0     20.0%    • UK system sales up 20.0% to £716.5m,
                                                                                    including c. £87m benefit from VAT
    Ireland system sales                         35.8           31.9      12.2%
                                                                                    reduction
    Total system sales                          752.3          628.9      19.6%
                                                                                  • LFL sales growth across UK & Ireland of 19.3%
                                                                                    excluding splits
    Supply chain revenue                         183.1         170.8       7.2%
                                                                                       – adjusting for VAT impact LFL sales growth
    Royalty, rental & other revenue              40.8           33.2     22.9%           was 5.5% excluding splits
    Corporate stores revenue                      17.7          15.4      14.9%
                                                                                  • Supply chain revenue up 7.2% as a result of
    NAF & eCommerce                              36.2           27.5      31.6%     increased volume
    Total DPG reported revenue                  277.8          246.9      12.5%
                                                                                  • Royalty, rental and other revenue increased
                                                                                    by 22.9% due to increased royalty revenue, in
    UK & Ireland EBITDA                          69.5           57.6                part from VAT rate reduction
    Reported EBITDA margin % of                                                   • Corporate stores revenue of £17.7m up 14.9%
                                                 9.2%          9.2%                 year-on-year
    system sales

    UK VAT reduction from 20% to 5% effective from July 2020
                                                                                  • Reported EBITDA margin as % of system sales
                                                                                    remained consistent
9   Half year results 2021
UK & IRELAND TRADING PERFORMANCE
Strong system sales; order count helped by recovery of collection
Delivery & collection analysis Quarterly profile
Total sales
£51.3m £752.3m
+79.8% +19.6% 18.5% 20.0% 19.3%
£72.1m
COLLECTION 13.5%
+12.8%
£628.9m 3.5%
DELIVERY Q1 -5.2% Q2 H1
H1 2020 H1 2021
LFL exc Splits Growth Total Order Count Growth
Total orders
1.5m 33.7m
• H1 total sales growth of 19.6%; LFL growth of 19.3%,
+27.1%
assisted by VAT rate reduction
+3.5%
32.6m
-1.5%
• H1 order count growth of 3.5% as collection rolling
(0.4m) COLLECTION closures last year
DELIVERY – Delivery business -1.5% orders
– Collection business +27.1% orders
H1 2020 H1 2021
10 Half year results 2021NON-UNDERLYING & DISCONTINUED OPERATIONS
Materially reduced charges
£m H1 21 H1 20
Discontinued International trading performance
• Focused on removing burden of
Iceland 0.6 0.5 International on Group cash flow
Norway - (3.3) – Trading losses now negligible
Switzerland 0.5 (1.4) • Norway disposal completed
Sweden (0.9) (2.4) May ’20 - loss of £10.8m
Central costs (0.8) (0.7)
• Sweden disposal completed May
Total trading loss (0.6) (7.3) ’21 – loss of £0.4m
Loss on disposal of Iceland (6.6) -
• Iceland disposal completed May ‘21
Loss on disposal of Norway - (10.8) - £13.5m of cash received - book
Loss on disposal of Sweden (0.4) - loss of £6.6m
Finance costs & tax - (1.2) • Other non-underlying charges of
Total charge from discontinued operations (7.6) (19.3) £0.9m relate primarily to legal and
Non-underlying charges professional fees
(0.9) (1.6)
Total charge from non-underlying & discontinued (8.5) (20.9)
11 Half year results 2021FREE CASH FLOW
Strong generation of free cash flow from the business
£m H1 21 H1 20 FY 20
Continuing operations EBITDA 71.7 59.5 125.5 • Strong free cash flow of £51.3m in
the first half
Discontinued operations EBITDA 0.2 (4.3) (4.2)
Remove contribution from • Working capital in the prior year
investments (7.6) (3.8) (10.8) benefitted from timing inflow of
£20.7m from the end of 2019
IFRS 16 – net lease payments (5.0) (8.4) (11.0)
Working capital 3.5 17.2 29.1 • IFRS 16 outflow of £5.0m relates to
cash payments and receipts for
Dividends received 2.6 1.5 2.5
leases now not presented as part
Net interest (2.2) (1.2) (4.4) of EBITDA
Tax (10.2) (11.3) (23.1)
• Tax cash outflows decreased by
Other (1.7) (2.3) (4.6) £1.1m as a result of timing of UK tax
Free cash flow 51.3 46.9 99.0 payments during the year
12 Half year results 2021USE OF FREE CASH
In the first half we have distributed £70.7m to shareholders
£m H1 21 H1 20 FY 20 • Total capital expenditure of £7.8m primarily
Free cash flow 51.3 46.9 99.0 relates to SCC (Cambuslang) and IT/Digital
investments
Capex (7.8) (7.1) (19.4)
Share receipts - - 13.4 • Acquisitions and disposals primarily reflects
the £13.5m of proceeds from the Iceland
Acquisitions & disposals 11.6 (6.4) (6.4) disposal
Receipts from German associate 9.2 - -
• £9.2m of receipts from our German associate
Other - 2.0 4.6
primarily relate to MAF
Net cash generated 64.3 35.4 91.2
• Dividend paid of £42.3m represents the FY 20
Dividend paid (42.3) - (25.6)
Final dividend of 9.1p paid in May '21
Share transactions (31.3) - -
• Share transactions include £28.4m of the spend
Forex on RCF 3.5 (4.9) (4.8)
to date of the £45m ongoing share buyback
Total movement in net debt (5.8) 30.5 60.8 programme and £2.9m of EBT purchases
• Total cash generated in H1 of £64.3m
• Closing net debt at £177.6m
13 Half year results 2021CAPITAL ALLOCATION PHILOSOPHY
£48.8m of cash generated in H1 to be distributed to shareholders
PRIORITIES FOR CAPITAL PHILOSOPHY OUTCOMES FOR H1 21
Invest in the business to drive Returns-based approach to Capital investment of £7.8m
long-term organic growth investment in core business to support business growth
Sustainable & Proposed H1 21
progressive dividend Annual EPS cover of at least 2x
dividend of 3.0p (£13.8m)
Board to take disciplined Divestment of sub-scale
Investment in additional
approach to assessing organic international businesses and
growth opportunities
and inorganic opportunities focus on the core business
Surplus cash Return surplus cash to our Incremental £35m share
shareholders buyback – total £80m
Strong balance sheet:
Normalised net debt / EBITDA leverage range of 1.5x - 2.5x
14 Half year results 2021Current trading & outlook
For FY 21 we expect:
• Execution of new strategy is delivering further growth in earnings
• We expect to incur Covid-19 related costs of c. £2.5m in the year (FY 20: £9.0m). The VAT benefit for the
full year is estimated at c. £6m (FY 20: £3.6m)
• Underlying depreciation & amortisation of £16m to £18m
• Underlying interest (excluding foreign exchange movements) of £4m to £6m
• Underlying effective tax rate of c. 18% for the full year
• UK & Ireland capital expenditure of c. £15m
• Net debt at FY 21 year-end around £200m
15 Half year results 2021AGENDA 1. Overview 2. Financial performance 3. Strategic & operational update – Dominic Paul, CEO 4. Q&A
TRADING ENVIRONMENT
    Our flexible and robust business model is incredibly agile and can
    adapt quickly to changing market conditions
    • Our agile business model has proved to be a real advantage
            – Vertically integrated ownership of supply chain
            – 100% ownership of customer relationship
            – Franchised model enables rapid response to changing market conditions

    • Delivery market grew rapidly through Covid-19 back drop
            – Focused on retaining customers won through Covid-19 and maintaining momentum

    • Collection market is recovering
            – Expect to recover towards order count levels in line with 2019 by the end of the year

    • Agile business model able to mitigate some inflationary pressure and labour availability

17 Half year results 2021
purpose
delivering a better future through food people love
1 2 3 4 5 MEDIUM TERM ambition
Nobody Turbo-charge Amplify our Uphold our Model
delivers like our collection product quality industry-leading excellence as a
Domino’s business & value scale economics franchisor £1.6bn to Add 200
£1.9bn New stores
VALUES in UK&I
System sales
We grow
We do the We are We love We are
and win
right thing one team customers bold
together
18 Half year results 2021Clear roadmap on our strategy execution
Multiple initiatives driving our strategic programme
In 2021 2022 and beyond
1 Personalise web platform & Driving improved Launch new web platform
deploy CRM marketing effectiveness
Launch new mobile App
2 Roll out In Car Collection Targeted promotion of
collections Introduce on-the-go menu items
3 Relaunch full menu offering Drive loyalty via Attract new consumers through
pizza innovation differentiated innovation
4 Utilise cages & dollies for Install scan & dispatch
Deploy dynamic distribution routing
SC efficiencies supply system
5 Stronger business Bolster our capabilities
Roll out new store formats
review process (e.g. in data)
Progress
19 Half year results 2021Nobody delivers like domino’s
Driving engagement through new App & functionality
• Both iOS and Android App live, with CRM capability
built in
• Group Ordering and Deal Wizard functionality added
and performing in-line with expectations
• Significant improvement in sales metrics post launch
• Great customer feedback with 4.8 stars on App Store
& 4.6 stars on Google Play
• Implemented 'Braze' CRM, omni-channel customer
engagement platform
20 Half year results 2021Turbocharge our collection business
Rolling out In Car Collection to grow share of carry out
• New ordering channel representing a growing % of digital carry-
out orders
• 300 stores at end June, potential for over 450
• Rollout across web and App ordering
• Regional advertising test planned in Q3 to drive local awareness
• Strong customer feedback at 4.5 stars
21 Half year results 2021Amplify our product quality and value
OUR SUPERCHARGE MEDIA STRATEGY FOCUSES ON PLACING DOMINO’S AT
THE HEART OF REUNIONS, SUPPORTED BY ‘GROUP ORDERING’
22 Half year results 2021Uphold our industry-leading scale economics
Accelerating franchisee new store openings
• New store opening incentive launched at end of Q1 driven
by franchisees wanting to seize market opportunity
– New stores: £100k - 3 annual instalments
– Split stores: £150k - 3 annual instalments
– Similar package for Ireland
• Offers best-in-class returns for franchisees
• Strong appetite across franchisees, from largest to
smallest, to open stores
• 13 stores opened in H1 (+8 vs LY). Plans for 2021 store
opening target of up to 30 vs. 19 in 2020
• Early trading of new stores above expectations
• Pipeline building for 2022
23 Half year results 2021Model excellence as a franchisor
Investment in supply chain, opened SCC, Scotland
• Opened new Scotland facility in April 2021
• 92 stores now supported from Cambuslang with
capacity to serve 150 stores
• Facility was built to allow our new store distribution
method of food baskets, Cages & Dollies
• Availability and accuracy of 99.9% and 99.8%
• Cages & Dollies deliveries across over 200 stores
• Further investment in Supply Chain infrastructure
planned for Ireland
24 Half year results 2021Franchisee Alignment
We are stronger together
• Our world class franchisees continue to work hard in challenging and variable market
conditions, with strong momentum maintained in H1
• We are engaged with our franchisees to drive profitable system growth
• We continue to have open dialogue with Domino's franchisee representatives and
the offer made, to align their objectives with ours, remains in discussion
• Where it makes economic sense to do so, we are implementing components of the offer
– New store incentives
– Investment in capabilities
– Investment in Supply Chain and Digital capabilities
• We are getting on with delivering the strategy to our mutual benefit
25 Half year results 2021SUMMARY & Outlook
• We have great foundations for future growth
– Asset light business model generating strong cash flow
• Excellent progress with clear building blocks in place to deliver our medium-term
objectives
– System sales of £1.6bn to £1.9bn
– Over 200 new stores
• Trading in first half of the year has been strong
– Enabling transparent and strong cash returns to shareholders
• Second half has started well
26 Half year results 2021Appendix
UK & IRELAND UNIT METRICS - 2021
                                            LFL Inc Splits (YOY Growth)                      Total (All Stores)
                                                      Items Per
                                         Orders            Order   Product Mix                           YOY Order
    UK & ROI                  Sales    (Volume)       (Volume)       (Volume)      Price   Orders (m)      Growth

    Total
    Q1                       17.7%       (5.9)%           7.3%           2.1%      14.1%       16.6m         (5.2)%
    Q2                       19.2%        12.2%         (7.9)%           1.9%     13.0%         17.1m         13.5%
    H1                       18.4%         2.5%         (0.3)%           2.7%     13.6%        33.7m           3.5%
    Delivery only
    Q1                       24.7%         5.9%           1.9%           3.9%      13.1%       13.3m           6.8%
    Q2                          1.1%     (9.7)%         (2.4)%           0.7%     12.5%         13.1m        (8.7)%
    H1                        11.7%      (2.5)%         (0.3)%           1.7%     12.8%        26.4m         (1.5)%
    Collection only
    Q1                      (12.0)%     (35.1)%          13.2%         (2.2)%      12.1%        3.3m        (34.5)%
    Q2                      1391.5%     488.8%           19.8%        378.3%     504.5%         4.0m         494.7%
    H1                        77.8%      25.7%            11.9%          11.7%    28.6%         7.3m           27.1%

    • Average discount 40.4%, with 92.4% of orders sold on promotion

28 Half year results 2021
UK & IRELAND SYSTEM SALES BRIDGES
UK system sales £m ROI system sales £m
+20.0% +12.2%
7.1 (3.9) 3.9 0.0 0.0 0.0
114.1 2.2
Immature Split New Immature Split 35.8
New territories 716.5 store store territories
store store
growth growth growth
growth
597.0 LfL 31.9 LfL
exc. Splits exc. Splits
2020 H1 2021 H1 2020 H1 2021 H1
29 Half year results 2021UK & IRELAND LFL SALES growth - 2021
Q1 Q2 H1
LFL sales growth 2021 2021 2021
Excluding splits
UK 18.8% 20.5% 19.7%
Ireland 8.2% 14.5% 11.3%
UK & Ireland combined 18.5% 20.0% 19.3%
Including splits
UK 17.9% 19.6% 18.8%
Ireland 8.2% 14.5% 11.3%
UK & Ireland combined 17.7% 19.2% 18.4%
30 Half year results 2021UK & IRELAND LFL SALES growth - 2020
Q1 Q2 Q3 Q4 FY
LFL sales growth 2020 2020 2020 2020 2020
Excluding splits
UK 4.0% 5.6% 18.3% 15.2% 10.9%
Ireland (1.7)% (5.4)% 2.0% 0.2% (1.2)%
UK & Ireland combined 3.5% 5.2% 17.5% 14.6% 10.3%
Including splits
UK 2.8% 4.7% 17.3% 14.6% 9.9%
Ireland (3.3)% (6.6)% 1.5% 0.2% (2.1)%
UK & Ireland combined 2.2% 4.2% 16.5% 14.1% 9.3%
31 Half year results 2021STORE NUMBERS
27 June 27 Dec 29 Dec
£m 2021 2020 2019
UK 1,158 1,147 1,130
Franchise 1,123 1,110 1,094
Corporate 35 37 36
ROI 54 54 54
UK & ROI total 1,212 1,201 1,184
Discontinued International operations
Switzerland 20 20 21
Norway NA NA 56
Iceland NA 23 24
Sweden NA 14 13
32 Half year results 2021IFRS 16 IMPLICATIONS – H1 21
Income Statement (underlying) Balance sheet
IFRS 16
£m Pre-IFRS 16 impact Post-IFRS 16 £m H1 21
Revenue 265.0 12.8 277.8 Right of use asset 21.5
Costs excl. depreciation (201.0) (9.4) (210.4) Lease receivable 201.4
Contribution of investments 4.3 - 4.3 Lease liability (224.7)
EBITDA 68.3 3.4 71.7 Net assets impact (1.8)
Depreciation (4.9) (2.9) (7.8)
EBIT 63.4 0.5 63.9
Net finance costs (2.2) (0.9) (3.1)
Profit before tax 61.2 (0.4) 60.8
Taxation (11.0) - (11.0)
Profit after tax 50.2 (0.4) 49.8
33 Half year results 2021NET DEBT BRIDGE
Net debt broadly unchanged
Net debt /
Net debt /
Reported EBITDA
Continuing EBITDA
Inc Discontinuing
(Excl IFRS16): 1.36x
(Excl IFRS16): 1.39x
(7.8) 9.2
51.3 (42.3)
(171.8)
(31.2) 13.5 (2.4) 0.5 3.4 (177.6)
OPENING FCF Capex Receipts from Dividends Share Iceland Sweden Other Forex CLOSING
NET DEBT (pre capex) German paid transactions disposal disposal NET DEBT
Associate
34 Half year results 2021GROUP BALANCE SHEET
27 Jun 27 Dec
£m 2021 2020
Intangible assets 32.2 30.5
Property, plant and equipment 90.7 91.1
Right-of-use assets 21.5 20.1
Lease receivables 201.4 204.7
Trade and other receivables 54.0 57.4
Inventory 12.7 11.0
Market Access Fee 8.7 15.3
Investments 56.1 51.7
Cash and cash equivalents 36.8 63.4
Deferred consideration 5.1 5.7
Tax assets 1.9 3.2
Assets held for sale 8.7 38.1
Total Assets 529.8 592.2
35 Half year results 2021GROUP BALANCE SHEET (CONTINUED)
27 Jun 27 Dec
£m 2021 2020
Lease liabilities (224.7) (226.5)
Trade and other payables (94.1) (90.3)
RCF (217.4) (243.6)
Share buyback obligation (16.7)
Other financial liabilities (0.4) -
Tax liabilities (2.9) (3.6)
Provisions (13.4) (13.5)
Liabilities held for sale (7.7) (23.5)
Total liabilities (577.3) (601.0)
Net liabilities (47.5) (8.8)
36 Half year results 2021GLOSSARY
Item Definition
AWUS Average Weekly Unit Sales
ASPA Average Sales Per Address
eCommerce fund The fund used to recharge costs for the development and maintenance of our eCommerce platform with franchisees
German associate Represents our 33% associate investment in the trading operations of Domino’s Pizza Germany (also referred to as Daytona JV)
HFSS High fat, salt, or sugar
International Represents our former businesses in Norway, Sweden, and Iceland, the business in Switzerland and our share of the German
associate.
London Relates to the corporate stores held following the acquisition of SMP and HMF and subsequent corporate store openings and
corporate stores closures
NAF National Advertising Fund
Shorecal Represents our 15% interest in the trading operations of Shorecal Limited, a franchisee group which operates stores in the
Republic of Ireland and Northern Ireland.
37 Half year results 2021ALTERNATIVE PERFORMANCE MEASURES
Location in release of
Item Definition reconciliation to GAAP measure
OVERALL TERMINOLOGY
Non-underlying items Items that are material in size, unusual or infrequent in nature, and are Group income statement, note 5
disclosed separately as non-underlying items in the notes to the accounts.
PROFIT MEASURES
Group operating profit before tax Group operating profit before tax excluding non-underlying items Group income statement, note 3
excluding non-underlying items
Net interest before non-underlying items Group finance costs excluding non-underlying items Group income statement, note 3
Underlying profit before taxation Group profit before tax excluding non-underlying items Group income statement, note 3
Underlying profit for the period Group profit after taxation excluding non-underlying items Group income statement
Earnings before Interest and Tax (EBIT) EBIT is directly comparable to underlying operating profit Not applicable
Non-underlying items Items that are material in size, unusual or infrequent in nature, and are Group income statement, note 5
disclosed separately as non-underlying items in the notes to the accounts.
Underlying basic EPS Group EPS excluding non-underlying items Note 7
Last 12 months (LTM) EBITDA LTM EBITDA for the period from 29 June 2020 to 27 June 2021 based on Not applicable
underlying activities including share of profits from associates and joint
ventures.
38 Half year results 2021ALTERNATIVE PERFORMANCE MEASURES
Location in release of
Item Definition reconciliation to GAAP measure
REVENUE MEASURES
System sales System sales represent the sum of all sales made by both franchised and
Not applicable
corporate stores to consumers.
Like-for-like (LFL) sales growth LFL excluding splits sales performance is calculated for UK & Ireland
excluding splits against a comparable 26 week period in the prior year for mature stores
Not applicable
which were not in territories split in the year or comparable period. Mature
stores are defined as those opened prior to 29th December 2019.
Like-for-like (LFL) sales growth LFL including splits sales performance is calculated for UK & Ireland against
including splits a comparable 52 week period in the prior year for mature stores, including Not applicable
those which were in territories split in the year or comparable period.
CASH FLOW MEASURES
Net debt Group cash less bank revolving credit facility and other loans Not applicable
Free cash flow Free cash flow comprises cash generated from operations less dividends
received, net interest cash flows and corporation tax. Free cash flow
Not applicable
before non-underlying cash items represents the free cash flow before the
inclusion of the cash impact of items recognised as non-underlying.
39 Half year results 2021FORWARD-LOOKING STATEMENTS CAUTION
These interim results, our Annual Report and the Domino's Pizza website may contain certain "forward-looking statements" with respect to Domino's Pizza
Group plc and the Group's financial condition, results of operations and business, and certain of Domino's Pizza Group plc’s and the Group's plans, strategy,
objectives, goals and expectations with respect to these items and the economies and markets in which Domino's Pizza Group plc operates.
Forward-looking statements are sometimes, but not always, identified by their use of a date in the future or such words as "anticipates", "aims", "due",
"could", "may", "should", "expects", "believes", "intends", "plans", "targets", "goal" or "estimates". By their very nature, forward-looking statements are
inherently unpredictable, speculative and involve risk and uncertainty because they relate to events and depend on circumstances that will occur in the
future. Many of these assumptions, risks and uncertainties relate to factors that are beyond the Group's ability to control or estimate precisely.
There are a number of such factors that could cause actual results and developments to differ materially from those expressed or implied by these
forward-looking statements. These factors include, but are not limited to, changes in the economies and markets in which the Group operates; changes in
the legal, regulatory and competition frameworks in which the Group operates; changes in the markets from which the Group raises finance; changes in
interest and exchange rates; the impact of legal or other proceedings against, or which affect, the Group; changes in accounting practices and
interpretation of accounting standards under IFRS; and changes in our principal risks and uncertainties.
Any written or verbal forward-looking statements made in these our interim results, our Annual Report or the Domino's website, or made subsequently,
which are attributable to Domino's Pizza Group plc or any other member of the Group or persons acting on their behalf are expressly qualified in their
entirety by the factors referred to above. Each forward-looking statement speaks only as of the date of these interim results or our Annual Report, or on
the date the forward-looking statement is made. Domino’s Pizza Group does not intend to update any forward-looking statements.
40 Half year results 2021You can also read