FINANCING THE SUSTAINABLE DEVELOPMENT GOALS
←
→
Page content transcription
If your browser does not render page correctly, please read the page content below
RESEARCH REPORT

FINANCING THE SUSTAINABLE
DEVELOPMENT GOALS
Lessons from government spending on the MDGs

                                  2015 REPORT

Government spending is falling one-third short of MDG needs – and the SDGs
will require at least US$1.5 trillion extra a year. Based on lessons from
tracking country budgets, this report recommends how the SDGs should be
financed: by doubling tax revenue, through radically overhauling global tax
rules; doubling concessional development cooperation, and improving its
allocation and effectiveness; and raising US$500 billion in innovative public
financing. In addition, all spending must be dramatically reoriented to fight
inequality, and needs to be much more transparent and accountable to the
world’s citizens.

Development Finance International (DFI) and Oxfam have collaborated on this Government Spending
Watch report to share research results and contribute to public debate on public financing for
development, financing the SDGs, and the Financing for Development processes. The report does
not necessarily reflect Oxfam or DFI policy positions. The views expressed are those of the authors.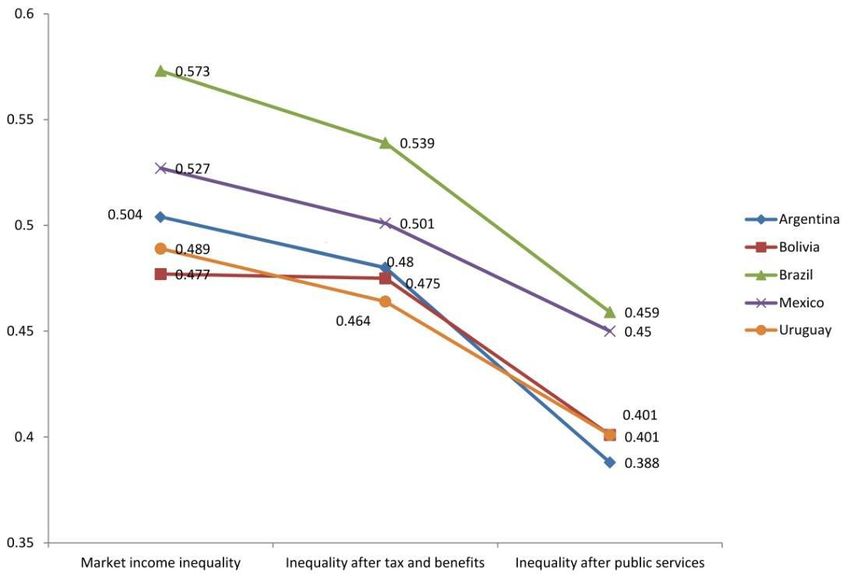
ACKNOWLEDGEMENTS
This report was written by Matthew Martin and Jo Walker. The research and data team who produce the GSW
data consists of Maria Holloway, Lance Karani, Jeannette Laouadi, David Waddock and Jo Walker. Special
thanks go to David Waddock for acting as interim data team lead. Rebecca Simson and Paolo de Renzio played
a key role in the research underlying Section 5. Earlier data and research contributions, without which GSW
would not be possible, were made by Richard Watts, Alison Johnson, Katerina Kyrili and Hannah Bargawi.

Key contributions to the compilation and interpretation of the data were made by budget officials in the 66
countries for which GSW has compiled data – too many to mention individually.

Oxfam provided valuable comments and input, including from Paul O’Brien, Max Lawson, Greg Adams, Ceri
Averill and Claire Godfrey.

Finally, DFI and Oxfam are most grateful to the Global Campaign for Education, the International Budget
Partnership, Save the Children International, UNESCO, UN Women and WaterAid, who have commissioned
work using GSW data during 2013–15, which helps us to continue to develop and deepen our analysis and
understanding of trends in government spending.

2   Financing the Sustainable Development Goals: Lessons from Government Spending on the MDGs

EXECUTIVE SUMMARY
THE AIM OF THIS REPORT AND ITS DATA
Six months remain until the end of the Millennium Development Goals (MDGs) – the framework
used to measure global development progress since 2000. Government spending is a key way for
countries to achieve the MDGs. Yet astonishingly, throughout the MDG period, the international
community has conducted no comprehensive monitoring or analysis of spending.

Since 2009, Development Finance International (DFI) has compiled the latest data on MDG spending
through investigative data gathering with government officials across seven key sectors: agriculture
and food, education, environment, health, social protection, water, sanitation and hygiene (WASH)
and women’s rights. These data have been published in reports and on the Government Spending
Watch website (www.governmentspendingwatch.org), and have helped to increase spending levels
and transparency.

The 2015 Government Spending Watch (GSW) report aims to take stock of progress on MDG
spending (and less desirable spending on debt and defence) as the world moves towards the finish
line for the MDGs. However, 2015 is also the year when the international community will agree a
new set of more ambitious Sustainable Development Goals (SDGs) for 2016–30, and will decide how
financing for development (FfD) should fund them. This report aims to influence these decisions, by:
     Analysing whether current spending trends will suffice to achieve the SDGs;
     Examining how spending has been funded since 2008, and what needs to change in FfD;
     Identifying what needs to be done to ensure that government spending combats inequality; and
     Assessing how ready countries (and the international community) are to track SDG spending,
     and to hold governments and funders accountable for its levels and results.

MDG AND SDG SPENDING
Section 2 of this report looks at recent spending on the MDGs and the implications for potential
spending on the SDGs. It demonstrates that government spending in developing countries rose
rapidly in 2012–14, but revenues did not. This has led to growing deficits, resulting in sharp increases
in debt service. As a result, debt service is ‘crowding out’ MDG spending in 21 of 66 countries, and
MDG spending has not risen to the same degree as overall government spending because debt
service has absorbed 40% of the extra spending, and infrastructure 35% – only 25% of additional
finance has been allocated to MDG sectors.

In terms of specific sectors, based on 2014 data, what is the country spending performance and
what implications does this have for spending on the SDGs?
     Agriculture: Only 14–16% of countries are meeting financial targets, and average spending is
     only halfway to the target and has fallen since 2012. The SDGs for zero hunger and sustainable
     agriculture will require doubled spending, and tracking of what is anti-hunger and sustainable.
     Education: Only 19–22% of countries are meeting Education For All (EFA) targets, though
     average spending is 80% of the target and most countries are increasing spending levels.

3   Financing the Sustainable Development Goals: Lessons from Government Spending on the MDGs
Education is the sector closest to reaching its MDG targets, but the SDGs’ lifelong high-quality
    learning agenda will require US$161 billion more.
    Environment: This sector has no MDG financial targets and received less than 1% of spending,
    and the average is falling. The environment and climate change SDGs require US$261 billion
    more a year, and there is an urgent need to set targets and ensure that all spending is
    ‘sustainability-compliant’.
    Health: No African country is meeting its targets, though 40% of all countries are meeting World
    Health Organization (WHO) per capita spending targets. Average spending is only half the
    targeted level, and recent trends have been mixed. Universal free healthcare will require an
    increase of US$50–80 billion, and a major effort is needed to monitor spending split by disease
    and beneficiary group.
    Social protection: Only Timor Leste meets any of the international finance targets on social
    protection: across all countries the average spending is less than 1% of GDP – though most
    countries have increased spending in recent years. Higher spending will be vital to target zero
    extreme poverty, full employment and decent work, and reduced inequality: even a cash
    transfer programme would cost US$65–90 billion extra a year. It will also be vital to invest in
    capacity to disaggregate social protection spending by target and beneficiary.
    WASH: Only 10% of countries are meeting targets, spending averages less than 1% of GDP and a
    majority of countries are reducing spending as a percentage of GDP. Reaching universal access
    to WASH will require US$24 billion, plus more to ensure sustainable water management, and
    much better monitoring of spending for both purposes.

Overall, countries should be spending close to 60% of their budgets on the MDGs, but current
allocations are only 38% and falling. Total additional public spending needs for the SDGs (including
the sectors above as well as access to modern energy and infrastructure) could be as high as US$1.5
trillion a year. New sectors will also pose extra challenges for tracking spending, as much of it will be
implemented by state-owned enterprises or will use complex finance mechanisms such as public-
private partnerships (PPPs).

FINANCING THE SDGs
Section 3 analyses how the MDGs have been financed. It finds that government revenue currently
funds 77% of spending, which has been more stable, aligned with government priorities, balanced
between investment and recurrent and easy to implement than donor-funded spending. The SDGs
therefore require a massive step up in domestic resource mobilisation, which requires:
    Major changes in international tax rules and practices to give fair treatment to developing
    countries, including in current G20/OECD tax initiatives, by allocating taxation rights primarily to
    source countries of raw materials, redesigning tax treaties and sharply reducing tax exemptions;
    Major reinforcement of developing country capacity to receive, analyse, audit and supply tax
    information, prosecute evaders and renegotiate contracts and agreements with corporations;
    Agreement on inclusive global governance of cooperation in tax matters, via the FfD process and
    a reinforced UN Tax Committee, to give developing countries equal decision-making power.

Whatever the increase in government revenue, it will not suffice to fund all the SDGs. Concessional
international public finance will still be vital. We need to mobilise US$1 trillion extra a year from:

4   Financing the Sustainable Development Goals: Lessons from Government Spending on the MDGs
All DAC donors recommitting to reach 0.7% of gross national income (GNI) in official
development assistance (ODA), by 2025, which could mobilise an additional US$250 billion a
year, bringing ODA to around US$400 billion;
South–South cooperation providers accelerating increases in concessional flows. These rose by
300% during 2000–15, and a similar increase for the SDGs would raise them to US$80 billion;
Innovative financing of US$450–550 billion a year, including taxes on carbon, bunker fuels and
air travel (US$250–300 billion), financial transactions and currency (US$100–150 billion) and
issuance of IMF Special Drawing Rights (SDRs) (at least US$100 billion).
There is also a need to focus 90% of concessional flows on the countries with the greatest needs –
low- and lower-middle income countries, including 50% on countries in ‘special situations’ (fragile
and conflict-affected, least developed, landlocked and small island states) – channelling international
public financing for development where it is most needed because lower-income and ‘special needs’
countries can least afford to fund the SDGs using their own revenues.
Public non-concessional finance and PPPs will have a role to play in financing the SDGs. However,
rising debt burdens diverting spending from the MDGs, and many current national debt
restructurings (notably in high- and middle-income countries), limit the scope for non-concessional
finance, and it will be vital that the FfD agreement includes a dramatic strengthening of current
measures to prevent and resolve debt crises. There are also major doubts about the scope for and
potential impact of public-private blended finance in many SDG sectors, and especially in reducing
poverty and inequality. To maximise their contribution to the SDGs, we must set effectiveness
indicators for non-concessional public finance and blended and private finance.
The post-2015 context needs more rational accountability for sectoral aid allocation. This should
involve:
An overall target for allocating concessional funding to SDG sectors of 60% or higher;
Targets for global sector allocations of concessional funding, similar to those agreed for spending
by developing country governments but updated to reflect SDG funding needs;
Using ‘markers’ for SDG spending in each sector in global and national aid databases; and
Screening all aid projects for positive impacts on the three pillars of the SDG agenda (e.g.
increasing income and gender equality and fighting environmental crises).
This report also makes recommendations to improve financing effectiveness in each sector.
Finally, the report stresses the need for dramatic improvement in the effectiveness of financing,
going beyond the 2011 agreement on a Global Partnership on Effective Development Cooperation,
by:
Targeting 80% of aid to reach developing countries, and 85% of this to be in their budgets;
Tracking these trends automatically in global and national aid databases;
Monitoring the investment/recurrent spending within aid to ensure sustainable spending;
Putting a much higher share of aid through government systems (as agreed in Busan).
SPENDING TO FIGHT INEQUALITY
Section 4 examines how public spending can be used to fight inequality. Income inequality has
increased sharply since 2000, undermining growth and poverty reduction efforts. The SDGs
therefore focus strongly on reducing inequality, with many goals designed to ‘leave no one behind’
and help the most marginalised. Moreover, failing to tackle inequality will add hundreds of billions of
5 Financing the Sustainable Development Goals: Lessons from Government Spending on the MDGsdollars to the spending needed to end poverty: failure to tackle inequality will mean failure to
deliver the SDGs.
In the search for policy measures to combat income inequality, many analysts have identified more
equitable government spending and more progressive and redistributive tax systems as crucial
interventions. Investment in public services – especially by covering their costs on education, health
and social protection – can help by lifting the poorest people out of poverty. Much more analysis is
needed to ensure that government spending tackles all forms of inequality simultaneously: it will
require a laser-like focus on ensuring that all spending in government budgets (as well as all aid)
addresses inequality issues, as well as rebalancing all spending to tackle specific forms of inequality
and the design of more specific and focused programmes to reach the marginalised.
Some of the key areas which GSW has identified through its research are:
Increasing sector financing and spending envelopes to eliminate user fees, insurance systems
and profit-making provisions which discriminate against the marginalised;
Ending major inequities within sectors by increasing spending on pre-primary and primary
education, maternal/child and reproductive health, sanitation and smallholder agriculture; and
Combating geographical/spatial inequality by allocating more to areas which are making less
SDG progress, using ‘equitable spending formulas’, to overcome huge current inequities.
Finally, reducing inequality among beneficiary groups (by gender, age, ethnicity, disability or
sexuality) will require a more comprehensive and integrated analysis of all intended beneficiaries of
spending (building on gender-responsive and child-oriented budgeting experiences) and its impact
on inequality, as a basis for targeting reallocation to more marginalised groups.
Overall, the world is woefully ill prepared to use government spending to fight inequality. We need
much higher spending levels; more detailed data and impact analysis; capacity-building and political
buy-in to anti-inequality allocation formulas; leadership by governments and local stakeholders
rather than donors in fighting inequality; and close national-level monitoring of implementation to
combat the diversion of spending to the needs of more powerful interest groups.
ACCOUNTABILITY FOR RESULTS
The final crucial element to ensure that public spending fights inequality and reaches the SDGs will
be citizens in developing and developed countries holding governments and donors accountable.
This process begins with greater transparency, especially of data on spending and revenue/aid in
budget-related documents, allowing them to track increases in ‘means of implementation’ for the
SDGs, which are in turn likely to accelerate SDG results.
This report makes many recommendations to increase transparency but section 5 shows that:
Current budget transparency is moderate but increasing rapidly, although it is lower for actual
spending, types of spending and donor financing, and for spending on new SDGs;
Transparency varies considerably by country, with 20% of 124 countries performing very well,
23% well, 25% moderately and 32% relatively badly;
Budget transparency makes tracking MDG spending and financing more feasible, by
encouraging governments to improve the quality and details of their data;
6 Financing the Sustainable Development Goals: Lessons from Government Spending on the MDGsWhen accompanied by government will/capacity and parliamentary/civil society demand, and
sustained across the whole planning and budgeting cycle, transparency brings accountability
and leads to higher MDG spending allocations;
With similar conditions, accompanied by efforts to improve spending effectiveness, higher
allocations lead to higher actual spending, and in turn to better MDG results.
This evidence suggests a number of low-cost ‘quick wins’ tailored to country circumstances to
increase accountability and results, as part of the data revolution needed to support the SDGs:
Publishing budget documents and data which governments already produce;
Improving data and documents on spending by making reporting gradually more disaggregated
and moving towards programme budgets; publishing regionally disaggregated spending;
publishing preliminary actual data more rapidly; and publishing ‘budgets by beneficiary’;
Improving data and documents on revenue by publishing breakdowns by tax, sector and size of
enterprise; analysing revenue losses from exemptions and incentives, and publishing lists of
companies granted exemptions; publishing and analysing national tax codes to prevent harmful
tax competition; analysing tax ‘incidence’ and progressivity to combat inequality; and publishing
tax revenues mobilised/exemptions received by donor projects;
Improving and publishing data on aid and other budget financing, by making the International
Aid Transparency Initiative (IATI) and national budget aid systems compatible; reporting
automatically via Development Assistance Committee (DAC)/IATI and national systems whether
aid is on the national budget; enhancing efforts to collect data from non-DAC funders including
South–South partners and civil society organisations (CSOs)/foundations; and publishing and
tracking all loan agreements and ‘off-budget’ contingent liabilities such as PPPs.
However, transparency on its own will not suffice to ensure accountability. This also requires:
Dramatically scaling up capacity-building support to governments to improve budget data,
through low-cost interventions designed to achieve the above quick wins; and to parliaments
and civil society to demand more transparency and accountability;
Setting SDG monitoring goals and mandating relevant UN agencies to monitor budgets and
means of implementation (spending, revenue and aid) for the SDGs within three months of the
end of each calendar year, through processes similar to those used by GSW;
Governments agreeing national SDG-compatible development plans and financing compacts
with their development partners, against which all can be held accountable by citizens for
results.
The recommendations in this report set out a detailed and ambitious Financing for Development
agenda – bold enough to match the ambition contained in the SDGs. Without this level of ambition,
many of the SDGs will be dead at birth, as countries fight over a stagnating pool of tax revenue and
concessional resources and stumble forward in semi-darkness as to how much is being spent on the
SDGs. To reach the ‘world we want’, the recommendations in this report must be adopted.
7 Financing the Sustainable Development Goals: Lessons from Government Spending on the MDGs1 INTRODUCTION
Six months remain until the end of the Millennium Development Goals (MDGs) – the key objectives
used to measure global development progress since 2000.1 Government spending is a key way for
countries to achieve the MDGs. Yet astonishingly, throughout the MDG period, the international
community has conducted no comprehensive analysis of whether government spending is high
enough to achieve the goals.
Since 2009, Development Finance International (DFI) has been compiling the latest data on MDG
spending across seven critical sectors, seen as particularly important for the achievement of the
goals: agriculture and food, education, environment, health, social protection, water, sanitation and
hygiene (WASH) and women’s rights.2
In 2013, these data were analysed to give an up-to-date and unique analysis of spending across
these seven key sectors in 52 countries towards achieving the MDGs, in the ‘Government Spending
Watch 2013’ report.3 The report gave a clear message: that spending was falling way short of MDG
needs, and had stagnated or fallen during the period 2009–13.
The 2015 Government Spending Watch (GSW) report aims to update this analysis and take stock of
progress on MDG spending, as the world moves towards the finish line for these goals. It extends the
2013 dataset and analysis by:
Updating data to cover 2014–15 budgets and, where possible, actual expenditure levels;
Expanding coverage to 66 low- and middle-income countries, for which budget spending data on
the MDGs are readily available (up from 52 in 2013);4
Comparing MDG spending with ‘less desirable’ spending on defence and debt service.
All these additional data are available free on the GSW website for all to use.5
However, 2015 is also the year when the international community will agree on a new set of more
economically, socially and environmentally ambitious Sustainable Development Goals (SDGs) for the
period 2016–30, with a strongly focus on fighting inequality. In July, leaders will also meet in Addis
Ababa to decide how financing for development (FfD) should fund these goals.6 This report has been
launched to coincide with these processes, in hope that the analysis will help to inform the
discussions by giving solid evidence to:
Analyse whether current spending trends will suffice to achieve the SDGs;
Examine how spending has been funded since 2008, and what needs to change in FfD;
Identify what needs to be done to ensure that government spending combats inequality; and
Assess how ready countries (and the international community) are to track SDG spending and to
hold governments and funders accountable for its levels and results.
The rest of this report is organised into an additional five areas of analysis. Section 2 looks at
government spending on the MDGs, assessing for each sector whether countries are meeting
spending targets or needs and the additional spending that will be needed for the SDGs. Section 3
looks at how this spending is being financed and the influence of external financing on spending
patterns. Section 4 looks at how ready spending is to combat inequality (as a critical priority in the
SDGs). Section 5 looks at how greater transparency and accountability of government spending and
8 Financing the Sustainable Development Goals: Lessons from Government Spending on the MDGsfinancing could be vital to achieve the SDGs. Section 6 concludes with practical suggestions to help deliver the SDGs. 9 Financing the Sustainable Development Goals: Lessons from Government Spending on the MDGs
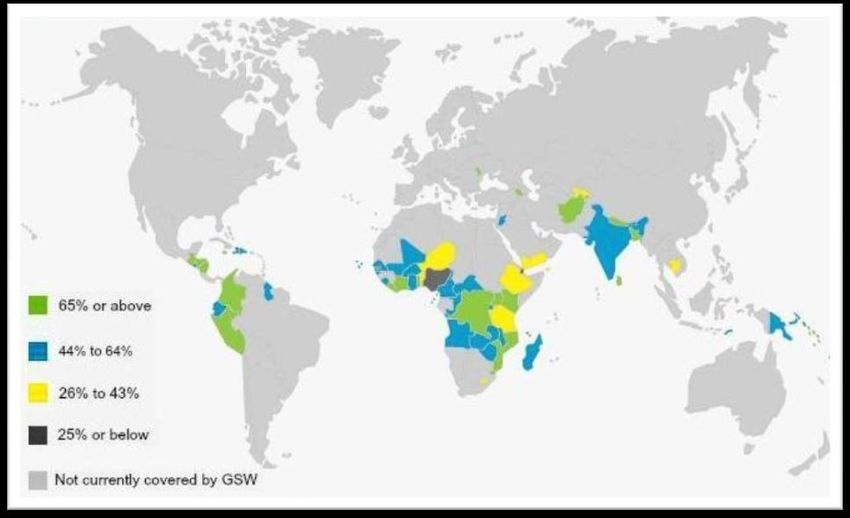
Figure 1. Countries covered by the GSW database

Note: This map shows the data available for all 67 countries currently on the GSW website. The online database includes South Africa, but analysis of the country’s data was not completed in time to be included in
this report. The number of countries in the database is currently being incrementally expanded, with a view to having all low-income countries (LICs) and middle-income countries (MICs) online in the future. Figure
5.1 in this report shows the current expansion plans.

                                                                             For more information, please visit: http://www.governmentspendingwatch.org

10    Financing the Sustainable Development Goals: Lessons from Government Spending on the MDGs
Box 1: The GSW website and database
The Government Spending Watch (GSW) website provides comprehensive, up-to-date data on
government spending on the MDGs. It was the first global, comprehensive and up-to-date
database: several other organisations publish MDG spending data, but with two years’ delay and
for only some sectors or countries.
The GSW dataset covers 66 low- and middle-income countries (see Figure 1). It covers seven
MDG-related sectors: agriculture, education, environment, health, social protection, water,
sanitation and hygiene (WASH) and women’s rights, as well as data on defence and debt service
spending. The data cover planned and actual expenditure for 2008 to 2014.
Compiling the dataset required a lengthy exercise of investigative data-gathering from public and
semi-public budget-related documents. The data available in many of these make identifying
MDG spending very difficult, so DFI has worked with a network of government officials to
interpret and classify data using a complex but consistent methodology and ruthlessly excluding
7
data where they are unclear.
Data are disaggregated by type of spending (recurrent vs investment) and source of funding
(government vs donor). They are presented in national currency, US$ equivalents, constant and
current prices, as a percentage of GDP and total spending, and per capita. They can be viewed
as graphs or tables, or downloaded in Excel format.
As discussed in Section 4, some data are not available, and one of GSW’s aims is to encourage
technical support to countries and support advocacy and campaigning, so that data are more
readily available. Due to lack of resources, data on the GSW website are currently limited to the
period 2012–14: all data will be made publicly available as soon as possible.
The website also contains a series of analytical research reports and briefings, some of which
focus on specific sectors or regions. The aim of these is to help policy makers in governments
and international institutions make the right decisions in allocating spending, by giving them clear
analysis of spending trends, comparing them with other countries and the promises they have
made and analysing case studies in detail to show how spending has affected progress towards
the MDGs.
The GSW website also contains a brief guide to campaigning and advocacy, to help civil society
and parliaments hold governments and donor agencies to account for spending on the MDGs
and other goals. This includes a summary of targets set and promises made by governments,
inspiring stories and videos on key campaigns which have increased spending and made a
difference to the lives of citizens across the world, and links to global, regional and national
coalitions working on increasing spending and transparency. The GSW site will continue to grow
in 2015, adding additional countries and 2015 budgets, a toolkit for influencing government
spending and financing, and more analysis. From 2016 it will be adapted to cover spending on
the newly agreed Sustainable Development Goals (SDGs).
GSW is jointly sponsored by Development Finance International (www.development-finance.org)
and Oxfam www.oxfam.org). These two partners are gradually building a wider coalition of
sponsors for this vital initiative. All comments and feedback, and expressions of interest in joining
this coalition, are welcomed. Please use the website’s feedback page
(http://www.governmentspendingwatch.org/feedback-and-suggestions) to contact us.
11. Financing the Sustainable Development Goals: Lessons from Government Spending on the MDGs2 GOVERNMENT SPENDING:
TARGETS, TRENDS AND SDG IMPLICATIONS
This section evaluates 2014 spending against internationally agreed MDG-related targets, drawing on
GSW data on 66 low-income and lower-middle or middle-income countries.8 It begins by assessing broad
overall trends in government spending and financing across these countries. It then looks at the
proportion of government spending that is going to the MDGs and to other ‘less desirable’ spending on
debt service and defence. Next it analyses six key sectors,9 comparing spending levels with targets set to
meet the MDGs, analysing recent trends and looking at additional spending and monitoring needs for the
SDGs. Finally, it summarises progress across all six MDG sectors, and looks at spending needs for
additional SDG sectors.
TRENDS IN OVERALL SPENDING AND FINANCING
Figures 2.1–2.4 show trends in government spending for the 66 GSW countries and offer Rising spending
explanations on trends in spending.10 On average, spending has risen by 3.2% of GDP and deficits
since 2008 (Figure 2.1), with a sharp increase in 2009 largely caused by efforts to
‘stimulate’ economies to combat the global economic crisis, followed by stagnation in have been
2009–11 and a renewed rapid rise in 2012–14. funded mainly
by borrowing
This spending increase has been only partly matched by a rise in budget revenues (Figure
2.2). Revenues fell sharply in 2009 as a result of the global crisis, rose consistently in
2010–12 but have stagnated since, and are only 0.9% of GDP higher than in 2008. As a result, budget
deficits (Figure 2.3) grew by 2% of GDP in 2009, fell back in 2010–13, but widened sharply to 8% of GDP in
2014. These deficits have been financed (Figure 2.4) by 5% of GDP in aid grants each year but also by a
16% cumulative increase in debt/GDP levels – resulting in sharp increases in debt service.
12. Financing the Sustainable Development Goals: Lessons from Government Spending on the MDGsOVERALL ‘MDG SPENDING’ TRENDS
This overall rise in spending has not brought a similar increase in ‘MDG spending’.11 MDG Increases in
spending rose in real terms every year during the period 2008–13, but stagnated in 2012–14. overall
In addition, as discussed in more detail below, the international community has set targets for government
spending levels needed to reach the MDGs as a percentage of GDP or total government spending are
spending, and spending is falling well short of these targets. As Figures 2.5 and 2.6 show, since not being
2012 spending on the MDGs has stagnated at just over 11.5% of GDP, after rising sharply in matched by
2009 but falling during 2010–12. As a proportion of total government spending, MDG spending spending
also fell by 0.5% in 2012–14, continuing an earlier decline since 2008. MDG spending is not increases in
keeping pace with broader spending increases. What is crowding it out?
MDG spending
13. Financing the Sustainable Development Goals: Lessons from Government Spending on the MDGsDEBT AND DEFENCE: CROWDING OUT MDG SPENDING? While analysing government budgets, GSW researchers have identified a clear link between high levels of debt service and defence spending and lower levels of MDG spending.12 Spending on these areas is clearly crowding out spending on MDG sectors in a considerable number of countries. On average, combined debt service and defence spending is reaching 21.3% of total government spending, compared with 37.9% going to the MDGs. Almost three-quarters of this ‘less desirable’ spending is going to debt service, which averages 14.9% of total spending.13 Just over one-quarter is going to defence, which averages 6.4%.14 Debt service crowds out MDG spending in one-third of countries Spending on debt service is crowding out MDG spending in a considerable number of countries. Twenty- one spend more than 15% of their budget on debt service, and 12 more than 20%. Six have to divert more than one-third of spending to debt service, with the highest burdens occurring in Sri Lanka (69%), Jordan (66%), Jamaica, the Occupied Palestinian Territory (48%), Colombia (45%) and Ghana (38%). All these countries are spending more on debt than on the MDGs: Sri Lanka is spending 3.3 times as much on debt service, Jamaica 2.5 times as much and Colombia and Jordan twice as much. In addition, average debt service has risen since 2008 by 1.2% of GDP across the sample of countries, reflecting the high levels of borrowing to fund government spending discussed above. At the other end of the scale, some countries are spending very little on debt service, providing greater fiscal space for spending on the MDGs. Fourteen countries are spending less than 5% of their budget on debt service and, of these, 10 are able to allocate more than 30% of their budgets to MDG spending. In particular, Kiribati is spending more than 70 times as much on the MDGs as on debt, Afghanistan 50 times and the Solomon Islands 21 times. Ethiopia, Mali, Moldova and Rwanda also stand out as countries that are close to meeting various MDG spending targets, due in part to low levels of debt service, which accounts for less than 10% of their total spending. Defence spending is worrying in at least four countries Defence spending is crowding out MDG spending in far fewer countries. Of the 44 countries for which data are available, only eight spend more than 10% of their budget on defence, and only two (Afghanistan and Armenia) more than 15%. Unsurprisingly, Afghanistan is spending the most on defence (22%): this represents 85% of the total amount spent on the MDGs. Armenia, Colombia and Sri Lanka also spend around half as much on defence as on the combined MDGs. On the other hand, six countries spend less than 3% of their budgets on defence (Cape Verde, Ghana, Jamaica, Moldova, Papua New Guinea and Timor Leste), and Cape Verde and Moldova are spending more than 20 times as much on the MDGs as on defence. In addition, defence spending has fallen slightly on average (by 0.7% of GDP between 2008 and 2013), reducing its negative impact on MDG spending. When the combined effects of debt and defence spending are taken into account, Sri Lanka emerges as the country suffering the worst diversion from the MDGs, with the ‘less desirable’ spending more than four times as high. In contrast, Moldova spends more than 11 times as much on the MDGs as it does on defence and debt service combined. Overall, higher revenue, increased borrowing and a fall in defence spending have all provided additional fiscal space for spending. However, only a quarter of the extra spending has gone towards the MDGs: more than 40% has gone to debt service, and the remaining third to infrastructure – reflecting developing countries’ growing concern to accelerate growth as well as reaching the MDGs. The next section explains trends for each MDG sector in terms of meeting internationally agreed targets, and demonstrates how these overall trends are leading to stagnation in spending on these key sectors. 14. Financing the Sustainable Development Goals: Lessons from Government Spending on the MDGs
15. Financing the Sustainable Development Goals: Lessons from Government Spending on the MDGs
MDG SECTOR-SPECIFIC SPENDING

                   AGRICULTURE AND FOOD
MDG target 1.C aims to halve extreme hunger by the end of 2015. According to the latest figures, there
are 805 million chronically undernourished people in the world, about one in nine of the global
population.15 This is down by more than 200 million since the start of the MDGs.16 However, overall
hunger levels have fallen only from 23% to 13.5% in developing countries, narrowly missing the MDG
target of halving hunger,17 while one in four children around the world remains stunted due to chronic
malnourishment in the first two years of their lives.18

Are countries meeting their agriculture spending targets?
GSW tracks agriculture spending to map government efforts to meet MDG 1.C, as this tends        Average
to be the most direct budgetary commitment and has proven capabilities in reducing              spending on
hunger.19
                                                                                                agriculture in
In 2003, African governments meeting in Maputo committed themselves to spend at least           Africa is 5% –
10% of their budgets on agriculture within five years.20 Figure 2.9 shows how the 31 African    half the amount
countries for which data are available performed in 2014. Five countries met the target         needed to meet
(Burundi, Guinea-Bissau, Malawi, Mali and Niger), but this was down from six (including         the 10% CAADP
Burkina Faso) in 2013 and nine in 2012. Malawi is the star performer, with an average of
                                                                                                spending target.
15% over the past five years. On the other hand, Angola, Ghana, Lesotho, Liberia and
Nigeria spend 2% or less of their budgets, and need to enhance efforts considerably.21
Though there is no formal target for other regions, GSW also assesses the performance of
non-African countries against a 10% target, given that the World Bank has found this level essential for
countries to transform their agricultural sectors.22 Figure 2.10 shows that, of 26 non-African countries,
only three (Bhutan, India and Nepal) are reaching 10%. Colombia, Ecuador and Jordan spend 1% or less.
This means that across all 57 countries for which data are available only eight, or 14%, are meeting the
target.

16. Financing the Sustainable Development Goals: Lessons from Government Spending on the MDGs
What are the recent trends in agriculture and food spending? In 2013, the GSW report showed that after a small increase in the aftermath of the food price crisis of 2008–09, agriculture spending fell slightly in 2010–12.23 This has continued since 2012, with only 48% of countries increasing spending as a percentage of GDP, and 41% as a proportion of total spending. Average spending is only 5% of the budget (half the amount needed to meet the 10% target). 17. Financing the Sustainable Development Goals: Lessons from Government Spending on the MDGs
The SDGs require doubled spending and closer monitoring
The new hunger-related SDGs go way beyond the current targets: they commit not only to ending hunger
everywhere by 2030, but also to improving nutrition and promoting sustainable agriculture. Against a
backdrop of several interlocking crises – including changing climate, increasing resource constraints and
population growth – reaching zero hunger levels, sustainably, will require much higher spending on
nutrition and sustainable farming. Additional public spending needs are estimated at US$61 billion a year
(US$46 billion for zero hunger and US$15 billion for sustainable agriculture).24

They will also entail reinforced commitment to track spending more closely: by separating out
programmes which address hunger and nutrition and by analysing whether agriculture spending is
promoting sustainability. The Scaling Up Nutrition (SUN) movement is leading efforts to improve the
tracking of spending on nutrition,25 and GSW will work closely with them in future.

                     EDUCATION
MDG target 2.A commits that, by 2015, children everywhere will complete a full course of primary
schooling. In 2000, the Dakar Framework for Education For All (EFA) also set out six goals, and a broad
commitment to ensuring quality education for all.26 Progress has been patchy. There have been huge
strides in getting children into primary school; some improvements in youth literacy; a narrowing of
gender gaps; and more children than ever completing basic education. But 58 million children are still
missing out on primary school, expansion of access to primary education has been slowing,27 the global
early school primary leaving rate (25%) is the same as in 2000 and (due to insufficient focus on quality)
many children end basic education without basic literacy and numeracy.28

Are countries meeting their education spending targets?
There are two international benchmarks for spending on education: governments should spend 6% of
gross national product (GNP) and 20% of their overall budgets on education. Hence, GSW tracks total
education spending as a percentage of both overall spending and gross domestic product (GDP).29 The
2014 data show that only 11 of 59 countries with data available for 2014 met the percentage of GDP
target: Cape Verde, Kiribati, Lesotho, Malawi, Moldova, Mozambique, Niger, Samoa, Senegal, Solomon
Islands and Zimbabwe. A similar number, 13, met the percentage of spending target: Benin, Côte d’Ivoire,
Dominican Republic, Ethiopia, Guatemala, Honduras, Madagascar, Mali, Nicaragua, Senegal, Solomon
Islands, Vanuatu and Zimbabwe – although the two groups contain different countries due to different
government spending/GDP levels. Across both targets, spending is nowhere near the levels needed for
the MDGs.

18. Financing the Sustainable Development Goals: Lessons from Government Spending on the MDGs
What are the recent trends in education spending? Overall, governments have increased spending on education by 0.6% of GDP since 2008. However, after a sharp rise in 2009–10, spending fell in 2011 and has broadly stagnated thereafter at 16.8% of government spending and 5% of GDP.30 19. Financing the Sustainable Development Goals: Lessons from Government Spending on the MDGs
The country-level position is slightly better, as shown in Figures 2.15 and 2.16: between 2012 and 2014,
59% of countries increased spending as a percentage of GDP, and 54% as a percentage of total spending.

Implications for the post-2015 education agenda
The draft SDGs set out a far broader agenda for education than the MDGs: the new                The total cost for
agenda commits to lifelong learning, going beyond pre-primary/primary/junior                    meeting the new
secondary education and including upper secondary, vocational, technical and tertiary
                                                                                                post-2015 education
education and full access for youth and adults. Alongside the drafting of the SDGs, there
has been a process to create an ‘EFA 2’ agenda (known as the ‘Muscat agreement’).               goals will require a
Both of these agendas have a far greater focus on learning and quality than the                 tripling of spending
MDGs/EFA, and aim to ensure access to education for the most marginalised children.             in low-income
This will be far more expensive than existing achievements and requires new, ambitious
                                                                                                countries
commitments.31
However, the Muscat agreement commits governments only to spending 4–6% of GNP,
and 15–20% of total government spending – lower levels than contained in the current targets discussed
above.32 As a result, the current targets contained in the Muscat agreement fall well short of what is
required to fund the SDG-related expansion.
In March 2015, UNESCO estimated that the annual total cost of achieving universal pre-primary, primary
and lower secondary education in low- and lower-middle-income countries is projected to increase from
US$100 billion in 2012 to US$239 billion between 2015 and 2030. The projected increase reflects a
combination of greater numbers of students and higher per student expenditure to improve quality and
address marginalisation,33 and is broadly consistent with the Muscat targets, though it is unclear how this
relates to reduced percentages of GNP or total spending.
In addition, it is clear that even these UNESCO costings fall well short of the SDG ambitions, notably in
aiming to finance only pre-primary, primary and lower secondary education and thereby omitting all the
other levels of education covered by the SDGs. As a result, no reliable costings exist for meeting the new
post-2015 education targets, and it is urgent that these be established as a top priority.

20. Financing the Sustainable Development Goals: Lessons from Government Spending on the MDGs
ENVIRONMENT MDG target 7.A is to integrate the principles of sustainable development into country policies and programmes and reverse the loss of environmental resources; target 7.B is to achieve, by 2010, a significant reduction in the rate of biodiversity loss. Although MDG7 has galvanised some political attention, bringing minor progress, the degradation of ecosystems, unsustainable use of natural resources and loss of biodiversity have continued at an alarming rate since the 1990s. In the last decade alone, 13 million hectares of forest have been lost worldwide each year.34 Over the lifetime of the MDGs it has become increasingly clear that these targets are a weak reflection of the ambition necessary to address the environmental challenges facing the planet, provide too little clarity for governments to implement them, fail to cover linkages with other development goals and target a narrow range of symptoms rather than underlying causes. Are countries meeting the environment spending targets? Tracking spending on the environment targets is highly complex, partly because the targets cover diverse sets of systems (forests, oceans, wetlands, urban biodiversity, etc.), which require changes and spending across a broad range of government agencies if development policy is to be compliant with sustainable development. Robustly tracking spending is difficult, but GSW builds an initial picture by analysing spending by environmental agencies and relevant budget lines in other ministries. Figure 2.17 shows that of the 39 countries with data, only three planned to spend above 1% of GDP in 2014 (Haiti, Papua New Guinea and Samoa) and these are all highly vulnerable Small Island Developing States (SIDS) who are already feeling the worst impacts of environmental devastation and climate change. On average, across all countries, 21. Financing the Sustainable Development Goals: Lessons from Government Spending on the MDGs
spending is only 0.3% of GDP, clearly nowhere near the amount needed to address the global
environmental crisis.

What are the recent trends in environment spending?
Average spending has actually fallen by two-thirds from a peak of 0.9% of GDP in 2012, which reflected
spending to combat natural disasters (mostly in SIDS). In terms of numbers of countries, rises in 51% have
been more than offset by falls in 41% (with no change in 8%), as shown in Figure 2.18.

                                                                                        Average spending
                                                                                        on the
                                                                                        environment is
                                                                                        only 0.3% of GDP
                                                                                        – nowhere near
                                                                                        the amount
                                                                                        needed to address
                                                                                        the global
                                                                                        environmental
                                                                                        crisis.

‘Sustainability-compliant’ spending targets – a priority for the SDGs
The complexity of allocating spending against the MDG environment targets may well explain why there
are currently no global targets or reliable estimates for costing the MDGs related to the environment: in
turn, this may explain why spending on the environment has fallen behind other types of MDG spending.
In addition, assessing whether government spending is ensuring greater environmental sustainability
would require an analysis of all spending similar to the ‘gender-responsive’ spending concept (see Box 4
in Section 4). Improving this will take considerable efforts to track the SDGs.

The current business-as-usual approach to environment spending shows an appalling lack of will to deal
with the environmental crisis facing the planet. One of the largest increases in financing needs for the
SDGs will be for the environmental goals. The draft SDGs acknowledge increasing environmental
degradation and natural disasters, the urgency of reducing carbon emissions sharply by 2030 and the
need to ensure that policies and spending across a wide range of sectors are ‘sustainability-compliant’.
They include goals on protecting biodiversity, combating desertification and deforestation, conserving
oceans and ‘climate-smart’ targets for agriculture, poverty and energy. Estimates indicate that this will
require annual public spending increases of US$80–115 billion for climate change mitigation,35 US$60–
100 billion for climate change adaptation36 and US$15–41 billion for the other environmental goals.37 It
will also be urgent to set targets for and to track both ‘core’ environmental spending and the degree to
which all government programmes are ‘sustainability-compliant’ as a top priority for the post-2015
framework.

22. Financing the Sustainable Development Goals: Lessons from Government Spending on the MDGs
HEALTH
Health is the most prominent sector in the MDGs, with three goals dedicated to it, but on which progress
has varied. MDG target 4.A aimed to reduce by two-thirds the under-five mortality rate, but only a 50%
reduction has been achieved. MDG target 5.A (to reduce maternal mortality by three-quarters) and target
5.B (universal access to reproductive healthcare) will be missed by wide margins. Efforts to combat key
diseases (target 6) are mainly paying off, with a 25% fall in deaths from malaria and lower rates of new
HIV infections, but many people still do not have access to anti-retroviral treatment.38
Are countries meeting the health spending targets?
Ensuring that healthcare is free and universally provided takes significant Average
government spending. Over a decade ago, two clear targets were established. In
2002, at a Special Summit in Abuja, Nigeria, African Heads of State committed spending on
themselves to allocate 15% of government expenditure to health. Globally, the WHO health in low-
Commission on Macroeconomics and Health in 2001 concluded that a minimum of income countries
US$34 per capita was required to be spent on health to reach the health-related is below US$20
MDGs.39 More recently, the Taskforce on Innovative International Financing forecast
per capita.
that, by 2015, US$60 per capita was needed to strengthen health systems and
provide essential services in 49 low-income countries (LICs).40
In 2014, GSW data show that no sub-Saharan African country met the 15% Abuja target.41 Malawi met it
in 2011, and was the highest-spending country in 2008–14 (averaging 13%). The only other country to
meet the target in the GSW database was Togo in 2008. Ten countries exceeded 10% of allocations in
either 2013 or 2014 – Burkina Faso, Burundi, DRC, Ghana, Lesotho, Liberia, Malawi, Swaziland, Mali and
Zambia. Senegal was the lowest-spending African country in 2014, spending below 5% – well below the
Abuja target.42 Among non-African countries, Kiribati met 15% in 2010, and El Salvador and Nicaragua are
at 17%.
In relation to the target of US$60 per capita, 23 countries of 59 with data available planned to spend
above US$60 in 2014. However, these included only four LICs (for whom the target was set), and average
LIC per capita spending is below US$20, with the lowest spenders being Haiti (US$6), Madagascar (US$4)
and Zimbabwe (under US$1). Unsurprisingly, lower-middle-income countries (LMICs) and middle-income
countries (MICs) tend to spend much more per capita, with 13 spending over US$100. Some MICs are
spending very low amounts, such as India at a shocking US$18 per person. By far the highest-spending
country per capita in the GSW database is Samoa, at $315 per capita; since 2008, spending on health has
doubled as a percentage of total spending, although this appears to be temporary spike, possibly as a
result of post-cyclone reconstruction. Overall, most countries are spending much less than is needed.
23. Financing the Sustainable Development Goals: Lessons from Government Spending on the MDGsWhat are the recent trends in health spending? Overall, the latest year’s GSW data indicate virtually no rise in health spending as a percentage of GDP since 2012, with spending standing at 2.7% of GDP, the same as the 2009 level cited in the GSW 2013 report. However, the average proportion of total government spending has fallen since 2012, from 9% to 8.6%. During 2012–14, only half the countries increased health spending compared with total spending, as did 52% as a percentage of GDP. These trends are very worrying, given the major shortfalls in meeting the health MDGs. 24. Financing the Sustainable Development Goals: Lessons from Government Spending on the MDGs
Health SDGs require a trebling of spending and careful tracking
The draft SDGs are much more ambitious than the MDGs on health: they target universal access to
healthcare (UHC) and focus on accelerating reductions in maternal and child mortality and increasing
access to sexual and reproductive health services. The consensus in the international health community is
that UHC-related spending needs to be predominately public.43 Ensuring that healthcare is free at the
point of delivery will also be critical to achieving equity (as will be shown in the next section).44 This will
require a significant scale-up of spending – which makes the context of current stagnant spending very
worrying.

In particular, this will require a vast scaling up of public spending. The Lancet Commission on Global
Health 2035 has suggested that LICs and LMICs would need to spend US$51 billion more a year from
2015, rising to $80 billion in 2035, saving an additional 10 million lives.45

One further major issue will need to be resolved in monitoring spending on the SDGs: the degree and
nature of disaggregation. As research carried out by GSW has found, data in the health sector are very
difficult to disaggregate. Whether considering beneficiaries for maternal and child health, spending on
particular diseases or spending by objective such as sexual and reproductive health, it is fiendishly
difficult to disentangle spending by intended outcome or with a focus on equity. Though overall health
spending will need to be tracked to reach UHC, only more detailed data can assess whether governments
are adequately tackling the main barriers to UHC and achieving higher life expectancy, as well as
targeting those most in need.

                   SOCIAL PROTECTION
MDG target 1.A is to halve the proportion of people whose income is less than US$1.25 a day.46 This
target was met in 2010, lifting half a billion people out of poverty in the process. However, concerns
remain about the fact that many countries, especially in Africa, did not meet the target.

25. Financing the Sustainable Development Goals: Lessons from Government Spending on the MDGs
All government spending which boosts economic development for the poor and promotes inclusive and employment-intensive growth can help meet this goal. However, GSW data focuses on the direct government interventions that have been most effective in reducing poverty and providing employment, known as ‘social protection’ spending.47 Are countries meeting the social protection spending targets? Social protection can be classified in two major groups, according to their financing mechanisms: contributory and non-contributory. To track efforts on MDG target 1.A, GSW looks only at how much governments are spending on non-contributory social protection. This is because GSW focuses on mechanisms which target extreme poverty (and hunger)48 or can help to mitigate the poorest against shocks which may push them into deeper poverty. Given that contributory funds are almost always for those in formal (especially government) employment, they do not tend to target the poorest or most vulnerable, and hence are not included by GSW as a means to track spending on the MDGs. Two targets have been established for spending on social protection. In 2008 at the African Union (AU) Windhoek Conference, African governments committed to a basic Social Protection Floor, the cost of which was determined at 4.5% of GDP. In addition, the International Labour Organization (ILO) and others have estimated the level of government spending needed to provide basic social protection at between 2.9% and 5.2% of GDP.49 Given that GSW tracks only non-contributory spending, we have chosen to measure countries’ progress by the lower end of the ILO target (i.e. 2.9% of GDP), although clearly this is a somewhat crude measure.50 For the 45 countries covered by the GSW database which have information available on social protection, spending is well below both these targets, as shown in Figure 2.23. No African country is anywhere near meeting the Windhoek or the ILO target. Timor Leste is the only country which meets the lower end of the ILO target range. Armenia is close, spending 2.3% of GDP, as is Jordan (2.2%). Only six countries (Dominican Republic, Guatemala, Haiti, India, Papua New Guinea, Samoa) spend 1%, and overall there is a woefully insufficient focus by LICs on social protection spending. 26. Financing the Sustainable Development Goals: Lessons from Government Spending on the MDGs
What are the recent trends in social protection spending?
Around 60% of countries have either increased their spending on social protection or kept it at the same
level as a percentage of GDP since 2012, while 53% have increased spending as a percentage of total
spending, which shows a slight increase comparative with other sectors. This builds on previous GSW
analysis which demonstrated slight rises from 2009 to 2012. Hence this appears to show a steady
incremental increase in spending over the past five years on social protection – at the very least, the
sector is staying relatively buoyant in comparison with other sectors, which is in line with recent findings
in the ILO’s ‘World Social Protection Report’.51 GSW’s analysis of budget documents in collecting these
data has revealed a number of countries that have introduced new social protection budget lines, which
also appears to corroborate the report’s findings that a number of MICs are expanding their social
protection programmes, while LICs are beginning to more explicitly focus on social protection.52

SDG implications: US$100 billion spending and more detailed data for
social protection
The draft SDGs reflect a consensus that the MDGs have targeted only extreme poverty, that inequality is
rising across the world and that the poor increasingly require life-cycle social protection to provide
resilience against natural disasters and other ‘shocks’. As a result, the SDGs include zero extreme poverty;
inclusive and sustainable economic growth, full and productive employment and decent work for all; and
reduced inequality. Investment in social protection will be essential to make progress on all these goals,
moving towards a lifelong social protection floor reflected in comprehensive sector-wide spending
programmes for social protection. Currently, the ILO estimates that 70% of the world’s population is at
risk of falling through the cracks because they are not adequately covered by social protection.53 Ensuring
improved coverage will take a huge scale-up in finance. Few estimates exist of the cost of such spending,
apart from cash transfer programmes to end extreme poverty, which have been costed at US$66–95
billion a year.54 More comprehensive social protection floors would have costs several times higher.

The SDG agenda will also make it more vital to disaggregate social protection spending to understand
how it is impacting on different goals – in terms of benefits (income, food, employment, etc.);
beneficiaries (children, families, elderly or disabled people) and the degree to which it reduces poverty
and inequality – by distinguishing clearly between contributory and non-contributory systems.

27. Financing the Sustainable Development Goals: Lessons from Government Spending on the MDGs
You can also read