Federal Involvement in Real Estate - A call for examination January 2013
←
→
Page content transcription
If your browser does not render page correctly, please read the page content below

Federal Involvement in
   Real Estate
   A call for examination

January 2013
This report is a product of Smart Growth America.
Smart Growth America is the only national organization dedicated to researching, advocating for
and leading coalitions to bring smart growth practices to more communities nationwide. From
providing more sidewalks to ensuring more homes are built near public transportation or that
productive farms remain a part of our communities, smart growth helps make sure people across
the nation can live in great neighborhoods. For additional information visit
www.smartgrowthamerica.org.

         Any errors and all interpretations are the responsibility of Smart Growth America.

              1707 L St. NW, Suite 250, Washington, DC 20036 | (202) 207-3355

Acknowledgments
Project Team
Geoff Anderson, President and CEO, Smart Growth America
Christopher Coes, Managing Director, LOCUS, Smart Growth America
Alex Dodds, Online Communications Manager, Smart Growth America
Catherine Hartnett, Director, Government Affairs and Outreach, Smart Growth America
Tom Madrecki, Press Manager, Smart Growth America
Ilana Preuss, Vice President and Chief of Staff, Smart Growth America

David Paul Rosen & Associates
McBee Strategic Consulting, LLC

Additional Contributors and Reviewers
Smart Growth America would also like to acknowledge the following individuals for their
contributions to this project: Jeri Mintzer, Zach Smith, and Nicholas Chang/Smart Growth America;
Ethan Handelman/National Housing Council; and John McIlwain and Lynn Ross/Urban Land
Institute.

                                                 i
Table of Contents
Executive Summary....................................................................................................................iii
1. The federal government’s involvement in real estate ......................................................... 1
Loans and loan guarantees: $1.363 trillion over 5 years ............................................................. 1
Tax expenditures: $680 billion over 5 years ................................................................................ 2
Direct grants and credit subsidies: $187 billion over 5 years....................................................... 3
An even larger impact............................................................................................................. 4
2. This spending has an enormous impact on the U.S. real estate market .......................... 6
A finger on the scale .................................................................................................................. 6
Favoring homeowners over renters......................................................................................... 6
Favoring single-family homes.................................................................................................. 7
Providing funding to purchase second homes ........................................................................ 8
Majority of funding is going to a small proportion of households ............................................. 8
Creating policy barriers to market changes............................................................................. 9
Failing to adequately support existing neighborhoods, a key to our fiscal recovery ................. 9
3. What purposes and criteria should guide federal involvement in real estate? .............. 10
Guiding principles for reform .................................................................................................... 10
1. Support balanced housing choices in suburbs, cities and rural communities .................... 10
2. Reinvest in America’s existing neighborhoods and communities....................................... 11
3. Provide a safety net for American families......................................................................... 11
4. Help more Americans reach the middle class ................................................................... 11
Conclusion ................................................................................................................................ 13
Appendix A ................................................................................................................................ 14
Appendix B ................................................................................................................................ 17
Endnotes ................................................................................................................................... 18
iiExecutive Summary
Federal financing of and spending on real estate impacts millions of Americans on every street, in
every neighborhood, town and rural community. From loan guarantees to commercial tax credits,
these programs help those most in need pay their rent, help families purchase their first home, and
provide financing for commercial development. The federal government impacts where and how
homes and even whole neighborhoods are built in the United States.
Each year, the federal government spends approximately $450 billion on real estate
through a combination of direct expenditures and tax and loan commitments. Smart Growth
America surveyed 50 federal real estate programs to better understand where this money goes
and how it influences development. The spending examined in the report’s analysis includes tax
expenditures, loan guarantees, and low-interest loans and grants. It does not include the
Government Sponsored Enterprises (GSEs), nor does it include non-real estate spending that
greatly influences development, including investments in transportation, other infrastructure and
federally owned real estate.
This spending has an enormous impact on the U.S. real estate market. Though usually
viewed as a “free” market, the U.S. real estate sector is heavily influenced by direct and indirect
government intervention. Much has been written about how zoning, infrastructure provisions,
subdivision regulations, local approval processes and other factors make the real estate market a
product of more than simple supply and demand. And recently, more has been written about the
outsized role of the GSEs and the need for their reform. Taken as a whole, these expenditures and
investments impact where real estate is developed and what kind of product is built.
Even a cursory analysis reveals this impact is uneven. For example, small multifamily
buildings are less likely to receive financing, despite the fact that most renters in the United States
live in these smaller buildings. Viewed as whole, federal funds are not targeted to those most in
need, are not targeted to strengthen existing communities and are not targeted to places where
people have economic opportunities.
Federal real estate spending should be reviewed and refocused. Smart Growth America’s
survey revealed several instances where federal real estate expenditures and commitments could
better meet our national needs and provide better benefits to homeowners, renters and
communities. These shortcomings mean U.S. taxpayers are failing to get the most out of these
large federal investments.
Federal real estate spending and commitments should be coordinated around a clear set of goals
to support thriving economies in communities across the country. With Congress and the
presidential administration taking a fresh look at how the nation spends taxpayer money, now is
the time for policymakers to re-examine federal commitments to the real estate market.
Smart Growth America believes in the federal commitment to housing all Americans and stabilizing
communities; we urge policymakers to review federal programs with the following goals in mind:
1. Support balanced housing choices in suburbs, cities and rural towns.
2. Reinvest in America’s existing neighborhoods and communities.
3. Provide a safety net for American families.
iii4. Help more Americans reach the middle class.
How and where real estate is developed is an important policy issue and one that influences other
issues like education, jobs, infrastructure and transportation. The federal government needs to look
at the benefits of its investments, and this means not only looking at what but also where
investment takes place.
Housing and commercial development can alter and strengthen an entire community if done right:
new investment in existing neighborhoods can spur revitalization, provide choices for people to live
near economic opportunities and transportation, and support regional economic growth in the
process. This type of investment can lower infrastructure costs and increase the tax base for
localities, helping towns and cities become more fiscally secure.
Rural main streets, suburban downtowns and city centers alike are the heart of the American
economy and supporting these areas with strategic development will help strengthen them.
American communities have benefited from the support of federal real estate programs, but that
support can do more for local governments, local neighborhoods, and the national economy.
iv1. The federal government’s involvement in real estate
Outside of Fannie Mae and Freddie Mac, the federal government is the largest single investor in the
U.S. real estate market.
To gain a more comprehensive understanding of just how extensive the federal government’s
involvement in real estate is, Smart Growth America, working with David Paul Rosen & Associates,
surveyed federal budgets from 2007, 2008, 2009, 2010 and 2011 and inventoried a sample of
more than 50 federal programs currently investing in the real estate sector. This inventory included
major sources of funding from federal agencies that provide direct funding or commitments to the
private real estate sector.
These expenditures and commitments represent approximately $450 billion each year. From fiscal
year (FY) 2007 to FY 2011, the federal government committed a total of $2.23 trillion to real estate
from the major programs included in this survey (see Table 1).
TABLE 1
Total federal spending on real estate programs, FY 2007-20111
Loans and loan guarantees $1.363 trillion
Tax expenditures $0.680 trillion
Direct grants and credit subsidies $0.187 trillion
Total commitment $2.23 trillion
Smart Growth America’s inventory focused on three different types of federal commitments: loans
and loan guarantees, tax expenditures and direct grants and credit subsidies. Each of these
supports the real estate market in some way. The largest programs from each type of commitment
were included in the survey and are described below.
Many small programs, measured by budgetary commitments, were not included in the analysis.
Fannie Mae and Freddie Mac were also excluded as quasi-governmental in their current
conservatorship state. In addition, the survey excluded expenditures with significant but indirect
impacts on real estate, such as transportation spending and water infrastructure. It also excluded
spending by the government for federal use such as military housing and other federal properties.
The inventory is not intended to be all-inclusive but to reflect the major programs and policies
managed by the federal government to better understand its intervention in the real estate sector.
Loans and loan guarantees: $1.363 trillion over 5 years
Direct loans and loan guarantees are the largest form of real estate commitment the federal
government makes, with a 5-year total of nearly $1.4 trillion (see Table 2). These programs provide
direct loans and loan guarantees for single-family, multifamily, rural housing and commercial
development. This type of support encourages and creates incentives for private lending where
otherwise there would be a lack of private investment. Loan guarantees are not direct cash
expenditures but rather the government taking on the risk of the loan, and this commitment
becomes direct spending only if loans cannot be repaid.2
1The largest loan programs for residential development are administered by the Federal Housing
Administration (FHA). FHA’s single-family and multifamily loan programs provide support for
properties where private lending may not be available. During the housing crisis, FHA played an
important role to ensure sufficient loan availability in the housing market when private capital was
not available. In FY 2011, FHA multifamily housing commitments totaled $13.1 billion, nearly four
times the amount in FY 2009.3
The largest loan program for commercial development is administered by the Small Business
Administration (SBA). Totaling $61 billion over the study period, SBA provides loans and
guarantees for construction or renovation of qualified small business facilities.
TABLE 2
Loans and loan guarantees, FY 2007–2011
Federal Housing Administration’s single-family loan programs $1.104 trillion
Federal Housing Administration’s multifamily loan programs $0.112 trillion
Department of Agriculture’s residential and commercial loan programs $0.080 trillion
Small Business Administration’s commercial loan programs $0.061 trillion
Department of Energy’s commercial loan programs $0.006 trillion
Total loans and loan guarantees $1.363 trillion
Note: Details of these loan programs are provided in Table 1 of Appendix A.
Tax expenditures: $680 billion over 5 years
Tax expenditures are the federal government’s second largest type of real estate spending. These
provisions from the Department of Treasury support individual homeowners and commercial
builders through a series of tax credits, deductions and exclusions (see Table 3).
The largest tax expenditure is the Mortgage Interest Deduction (MID), totaling nearly $400 billion
over the 5-year study period. This deduction allows homeowners to reduce their taxable income by
the amount of interest paid on their mortgage for either a principal or secondary residence. Interest
is deductible on the first $1 million of debt used for acquiring, constructing or substantially
renovating a residence. The deduction can also be applied to interest on home equity loans up to
$100,000. In both cases the deduction only applies for taxpayers who itemize their tax deductions.
TABLE 3
Tax expenditures, FY 2007–2011
Mortgage Interest Deduction $396 billion
State and Local Property Tax Deduction $106 billion
Capital Gains Exclusion $94 billion
Other tax programs4 $84 billion
Total tax expenditures $680 billion
Note: Details of these programs are provided in Table 2 in Appendix A.
2The next two largest tax expenditure policies are the real estate property tax deduction and the
capital gains exclusion on home sales. The real estate property tax deduction, totaling $106 billion
over 5 years, allows homeowners to deduct their state and local property taxes from their annual
federal taxes. The capital gains exclusion, costing $94 billion over the same period, allows
homeowners to not pay taxes on the first $250,000 (or $500,000 if filing taxes jointly) of profit off
the sale of a home. These 3 tax deductions and exclusions provide 88 percent of all the federal tax
expenditure spending on real estate.
The Low-Income Housing Tax Credit (LIHTC), totaling $29
billion over the 5-year study period, is another tax expenditure Property Taxes
and is used to build a variety of housing choices. Annually, States and municipalities use
housing tax credits are allocated to states that then award property taxes to build local
these credits to builders for qualified projects. The credit infrastructure, including
provides an incentive for the private sector to build new and transportation, drinking water
rehabilitate existing affordable rental housing in communities and wastewater systems. State
across the country. Over the past 25 years, LIHTC has and local property taxes also
provided financing for the development of more than 2.5 help fund services that indirectly
million affordable rental homes across the country and has impact housing and
leveraged more than $75 billion in private investment capital. businesses, including schools,
Annually, LIHTC finances approximately 90 percent of all and police and fire stations.
affordable housing.5
The depreciation of commercial real estate program is another tax expenditure included in this
survey. A key business tool, this program allows a commercial property owner to deduct the
decreased value of the property over its useful life. Depreciation can only be applied to a building,
since the building wears out over time. Commercial property must be depreciated over 39 years by
equal amounts each year over its useful life. Residential income property, where 80 percent or
more of its gross rental income for the year is from residential units, can also claim the deduction.
Residential property must be depreciated over a period of 27.5-years. The depreciation of rental
properties cost the federal government $24 billion over the study period and $3.6 billion for
buildings other than rental housing.6
Direct grants and credit subsidies: $187 billion over 5 years
Direct grants and federal credit subsides are the smallest federal real estate expenditures or
commitments, equaling less than 10 percent of the total funding surveyed. The major direct grant
programs are provided by the Department of Housing and Urban Development (HUD) and the
Department of Agriculture (USDA) to builders to spur development of residential and commercial
properties in target locations (see Table 4).
3TABLE 4
Direct grants and credit subsidies, FY 2007–2011
Department of Housing and Urban Development $184 billion
Department of Energy $1.4 billion
Total direct grants/expenditures $186 billion
Department of Agriculture $0.9 billion
Small Business Administration $0.1 billion
Total credit subsidies $1.0 billion
Note: Details of these programs are provided in Table 3 in Appendix A.
At HUD, the two largest direct grant programs are the tenant-based rental assistance program and
the project-based rental assistance program—both major safety net programs for low-income
households. These programs provide individual households with the opportunity to have affordable
housing, spending no more than 30 percent of their income on a place to live. The tenant-based
program allows households to use the assistance in any rental property that will accept it, while the
project-based program allows a property owner to provide lower-cost housing throughout a
specific property.
The USDA provides support through its Rural Development program, which is available to rural
communities across the country. The program provides loans and grants for housing and
community facilities, including fire and police stations, libraries, nursing homes and schools.
Credit subsidies are the smallest type of support to private real estate. Credit subsidies are derived
from programs at both USDA and SBA. USDA provides credit subsidies to reduce the cost of
loans for the development of farm labor housing, for example, and SBA provides credit subsidies
to reduce the cost of loans for commercial development by guaranteeing loans, revolving lines of
credit and repayments of other types of debt.
An even larger impact
While $450 billion was the average amount directly committed to real estate each fiscal year by the
federal government, the government’s impact goes even further. This figure does not include the
obligations of GSEs Fannie Mae and Freddie Mac, which exceed $5.5 trillion in outstanding loans
and loan guarantees.7 These loans and loan guarantees provide more backing to single-family
properties than to multifamily ones. As a result of conservatorship that began in September 2008,
the federal government explicitly backs Fannie Mae and Freddie Mac, including direct spending in
the case of any losses. To date the federal government has spent $180 billion since its
conservatorship of the GSEs began.8
This analysis also does not include federal funding for infrastructure projects like roads, railroads,
public transportation, sewer systems, water lines and broadband, or federal government property
including military bases and buildings owned or leased by the General Services Administration.
These factors also influence where and how real estate is developed and multiply the federal
government’s impact. For instance, infrastructure investment through the surface transportation
4authorization and drinking water and wastewater state revolving loan funds in the FY 2011 budget
equaled $53.8 billion, and this figure reflects only a portion of the total infrastructure spending from
the federal government.9
Why does the federal government invest in real estate?
The federal government invests in real estate for a variety of reasons, depending on the
specific program. The MID, created in 1913, is intended to promote homeownership. The
Federal Home Loan Bank Act of 1932 provides sources of low-cost funds to banks to
extend mortgage loans. The tenant-based rental assistance program at HUD is intended
to increase affordable housing supply for low-income households. The New Markets Tax
Credit, created by the Community Renewal Tax Relief Act of 2000, is designed to drive
investment in communities with high levels of poverty and spur economic redevelopment.
Many of the programs surveyed are very old, and it is time to ask whether these are still
the right funding priorities. Are today’s programs accomplishing their intended purpose?
Are programs coordinated across the federal government? And are these programs
meeting the needs of the American people today?
52. This spending has an enormous impact on the U.S.
real estate market
Though many think of the United States as a free market economy, real estate is greatly influenced
by government policies. These policies, programs and spending impact what is built in
communities across the nation, which influences the housing choices and business opportunities
available to families and businesses.
Since the first local zoning code was created in 1916, local governments have created a diverse
set of rules to govern the amount and type of development allowed in America’s counties, towns
and cities. Zoning codes, parking regulations, development fees, tax abatements, financing
programs, infrastructure spending, caps on the number of building permits issued, allowable uses
on properties and specific requirements in sewer and water districts are just some of the ways
local governments influence real estate development. All of these regulations impact the quantity
and type of real estate available to consumers.
Federal involvement in real estate is no different. The massive investments outlined in the previous
section manifest themselves as incentives to individual buyers and sellers. And like local
interventions, they impact the quantity and type of real estate available to consumers.
Federal real estate programs have accumulated over a long period of time and have not
necessarily ever been viewed as a whole. As a result, they are unlikely to work together toward a
coherent set of objectives or policy direction. While a review of these programs to detect a
common direction is beyond the scope of this study, this report is intended to show the size and
breadth of the major federal subsidies for real estate, and in so doing, highlight the importance of
taking a fresh look at these programs to ensure that they are meeting the needs of America’s
families, businesses and taxpayers.
A finger on the scale
Even a cursory survey of federal real estate spending and commitments reveals an uneven impact
on the real estate sector. We provide these observations here and believe they provide both
direction and evidence for a comprehensive review.
Favoring homeowners over renters
The largest proportion of federal financing is directed at homeownership, totaling about 84 percent
of total federal spending on housing (based on the programs surveyed by Smart Growth
America).10 The MID for homeowners is one such program and is among the largest expenditures
of the federal government. This tax deduction costs an average $80 billion annually and promotes
increased spending on housing. But according to the Reason Foundation11 and the Center for
American Progress12 it does not necessarily increase rates of homeownership. The MID is only
claimed by homeowners, not renters, who itemize their taxes. This skews the deduction
predominantly to higher income households that own their homes. There is no similar deduction or
credit for renters, nor for moderate/lower income homeowners (the majority of whom do not
itemize their taxes). The MID also creates an additional penalty for households that lose their
homes to foreclosure, as they lose both their real estate asset and a tax benefit.
6Based on the programs included in Smart Growth America’s survey, support for multifamily rental
opportunities makes up only 16 percent of total housing support, despite the fact that 35 percent
of U.S. households are renters, a figure that is projected to increase in the aftermath of the Great
Recession.13 Many renters, in addition, are also low-income, with a median income of $30,934
compared to $64,063, the median income of homeowners.14 Lower incomes paired with
increasing rents and the scarcity of affordable units available to lower income renters show that
more may be needed to support rental housing.15 Renters, in fact, face a penalty from the federal
government, receiving less support per household, and being ineligible for a large deduction like
the MID. There is assistance available for low-income renters through HUD programs including
public housing, housing vouchers and project-based assistance; however only one in every four
households in need receive some
form of assistance.16
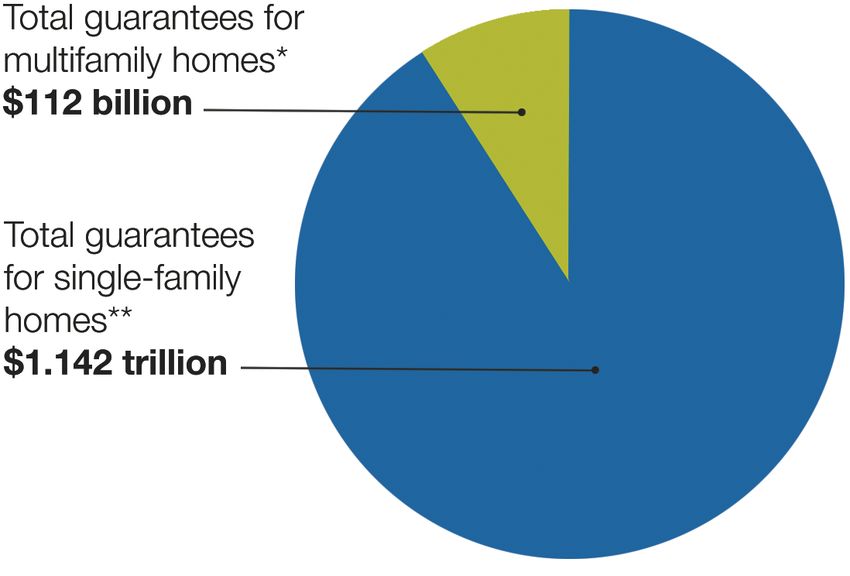
FIGURE 1
Favoring single-family homes Federal support for single-family homes vs.
Loans and loan guarantees from FHA multifamily homes, FY 2007-2011
and USDA disproportionately support
single-family homes over multifamily
homes.
Congressional appropriations
provided FHA with approximately
$1.1 trillion in loan guarantees for
single-family housing between FY
2007 and FY 2011. During that same
time the agency could provide only
$112 billion for multifamily products—
one-tenth of the investment. Making
up more than 90 percent of FHA’s
support for housing, single-family
loans dwarf support for multifamily
products regardless of market
demand (see Figure 1). This comes at
a time when demand for multifamily * Includes single-family homes guaranteed by FHA and all USDA
housing exceeds ten-year averages in Rural Housing guarantees.
communities across the country.17 ** See Table 1 of Appendix A for a detailed breakdown of the total
This despite the fact that multifamily between FHA and USDA Rural Development funds.
products have one-fifth the
delinquency rate than that for single-family housing and demand is rising for multifamily housing
across the country.18 Additionally, one-third of renters in the United States live in small multifamily
buildings, with more than five units but less than 50. These buildings are in high demand but
among the most difficult to finance and do not receive any focused federal support. Similarly, the
largest housing program at USDA provides loans and loan guarantees for single-family housing
(See Table 1 in Appendix A for details).
Providing easier access to low-cost loans for single-family housing skews the real estate market to
build that product type over multifamily products that might otherwise be built if access to financing
was equal.
7Providing funding to purchase second homes
Often the federal intent stated in mortgage policy is to support homeownership and to expand the
number of households who are owners. The percent of households owning a home is tracked
closely across the national stage (65.5 percent in the second quarter of 201219) and used as a
benchmark of national success. Yet, the deduction of mortgage interest from household taxes
applies to both first homes and second homes. In 2011, approximately 30 percent of households
that claimed the MID also claimed the deduction on a second home.20 Not only does this
potentially drive up the cost of homes and undermine widespread ownership, but scarce federal
resources are being used to help purchase second
homes while homeowners who do not itemize their
taxes receive no such assistance. In 2011, approximately 30
percent of households that
Majority of funding is going to a small proportion
of households claimed the MID also
The distribution of funding for housing programs claimed the deduction on
demonstrates that middle-income households receive
significantly less support than either end of the a second home
spectrum with most of the subsidy going to the upper
income households. In fact, households making more than $200,000 get nearly three times the
subsidy of all other households combined (see Figure 2). The rationale for supporting lower income
households is clear—without it, they are at risk of being without housing. The rationale for providing
three times the support to the households with income levels above $200,000 is less clear. This
spending is clearly not focused on stability for the middle class.
FIGURE 2
Estimated average housing subsidy per household/taxpayer, 200821
$200,000 and over $6,253
$100,000-$200,000 $2,551
$75,000-$100,000 $1,046
Income range
$50,000-$75,000 $626
$40,000-$50,000 $289
$30,000-$40,000 $265
$20,000-$30,000 $340
$10,000-$20,000 $455
Below $10,000 $833
$0 $1,000 $2,000 $3,000 $4,000 $5,000 $6,000 $7,000
Subsidy (Tax and direct)
8Creating policy barriers to market changes
A number of existing programs establish “use limits” to the kinds of real estate products that can
receive low-cost loan support. For example, builders of properties that include a mix of commercial
and multifamily residential uses (both rental and condo) may only apply for an FHA loan or loan
guarantee if they limit the percent of commercial space of the project, regardless of the market
demand and viability of the project. Demand for mixed commercial and residential real estate
development is a growing trend, and the federal government should not create a barrier to real
estate types if the fiscal viability of the loan is sound. FHA recently responded to the market
demand for mixed-use development by raising the limit on commercial space allowed in buildings
receiving funding through its single-family loan program for condominiums. Additional adjustments
are likely needed.
Failing to adequately support existing neighborhoods, a key to our fiscal recovery
Fiscal impact studies have shown repeatedly that reinvesting in existing neighborhoods and
redeveloping existing buildings benefits municipal budgets, local property tax base and local
economies. Because of outdated infrastructure, however, these projects can be prohibitively
expensive for developers. Current federal support for real estate does not provide incentives for in-
town development to reuse infrastructure, nor does it take into account the long-term savings for
communities and taxpayers that can result from this type of real estate.
93. What purposes and criteria should guide federal
involvement in real estate?
Existing federal programs provide extensive funding for the real estate market. In some cases—
such as the overwhelmingly disproportionate spending on single-family housing compared to
multifamily housing—programs that were created to meet market demand are now moving in
opposition to the market. Some federal spending programs are used to subsidize new
development on the outskirts of communities in
locations that are very costly for local
communities—while other federal programs Changing demand
are attempting to revitalize and strengthen According to a number of recent studies,
nearby community cores at the same time. demand for housing is changing dramatically
Even this overview of federal real estate in the United States. The National Association
subsidies suggests that a comprehensive of Realtors found in 2010 that two-thirds of
evaluation is needed. households would select a smaller home
within walking distance to restaurants, shops
Today with the fiscal pressures facing the and schools over a large-lot property farther
federal government, it is even more important away, if they could afford it. In 2012 the
that we ensure that federal expenditures and Urban Land Institute recognized that
commitments on real estate are meeting our apartments are in high demand, stating
national needs, strengthening communities and “Living smaller, closer to work, and preferably
providing economic opportunity. The federal near mass transit holds increasing appeal as
government should ensure real estate more people look to manage expenses
spending is cost-effective and meeting the wisely.” That report also notes a strong and
needs of families across the income spectrum, growing demand for commercial spaces in
across community types and across the urban districts.
country. It is time for a fresh look at all these
programs.
Guiding principles for reform
Smart Growth America recommends that federal real estate policy be more targeted to ensure that
federal investments do the following:
1. Support balanced housing choices in suburbs, cities and rural communities.
2. Reinvest in America’s existing neighborhoods and communities.
3. Provide a safety net for American families.
4. Help more Americans reach the middle class.
1. Support balanced housing choices in suburbs, cities and rural communities.
Our research has shown that the federal government disproportionately supports single-family
housing over multifamily housing. This comes at a time when market demand for multifamily
housing choices is growing. Smart Growth America does not believe the federal government
should be in the business of determining the housing products available to the American people.
The government should be efficient with federal resources and modernize investments to reflect
today’s demand for a variety of housing choices.
102. Reinvest in America’s existing neighborhoods and communities.
Support community stability by reinvesting in existing communities where the public and private
sector have already made substantial investments. With 35 percent of the nation’s wealth invested
in the built environment and trillions of federal dollars directed at it, ensuring stability of real estate
investments is key to our economic future.24 Yet over the past 50 years, the federal government
has increasingly spent its scarce resources on new communities at the expense of existing
neighborhoods. This has a profound effect on the cost to taxpayers. Building new infrastructure
rather than fixing existing infrastructure
increases maintenance costs for states,
municipalities and the federal government. The benefits of reinvestment
This strategy also pushes new development to Investing in existing communities brings many
follow the new infrastructure, causing local benefits to the residents of those
governments to lose population or face communities as well as the localities and the
foreclosures. Federal programs to support federal taxpayer. Investing within communities
communities when this happens are even expands the tax base, creates additional jobs
more costly. All of this leads to massive and increases property values. Alternatively,
inefficiencies in taxpayer investment, and providing infrastructure to development on
negatively affects economic competitiveness the fringe—outside of existing communities—
and performance. costs three times as much as providing
infrastructure to in-town development.22 In
The federal government should focus fact, Sacramento, CA found that building
programs to protect past public and private within communities would save the city $7.5
investments, including property values and billion in infrastructure costs.23
infrastructure. Cities, states and private
developers alike have already made significant
investments in America’s communities, and the government should protect the value of those
investments.
3. Provide a safety net for American families.
The federal government has long intervened in the real estate market through a variety of programs
that have one overall purpose—providing a safety net for families and individuals who would
otherwise not be able to meet their basic need for shelter. This is justified by both moral and
practical considerations. From a practical and policy perspective, providing basic shelter creates a
host of public goods and avoids public harm. Public medical costs, crime costs, basic sanitation,
and other publicly and privately born costs are all reduced by providing shelter. 25 Shelter is a basic
building block enabling people to successfully participate in the economy. It does not guarantee
they will succeed, but it is virtually guaranteed they won’t without it. Despite being one of the most
basic functions of government, this goal currently receives some of the lowest levels of support
from federal investments.
4. Help more Americans reach the middle class.
A significant proportion of federal real estate investment is directed at promoting homeownership,
which is considered a gateway to the middle class. Homeownership has been a goal of the federal
government because of the benefits associated with it—stabilizing a household’s largest cost
(shelter) while enabling a household to accumulate wealth. Housing as a wealth-building
mechanism has been particularly important for households of modest means. It allows the shelter
portion of a household budget to be used as an investment that generally builds equity over time—
something not possible when these funds are spent on rent. It is time for the federal government to
11consider how best to support households to reach the middle class, not just support them once
they attain it.
Helping lower income families move into the middle class and helping middle-income families stay
there will also help to promote better health outcomes, higher educational achievement for
children, lower demands on social services, basic safety net programs and less involvement with
the criminal justice system. Each of these will reduce public costs—costs that can be avoided
when households move into the middle class.
Federal real estate financing should benefit all Americans, whether homeowners or renters in rural,
suburban and urban communities, in a way that makes membership in the middle class an
attainable feat.
12Conclusion
The federal government heavily influences the U.S. real estate market, but more must be done to
ensure this funding effectively meets the nation’s current and future needs. Policymakers have a
unique opportunity to improve the way the federal government invests to ensure taxpayers reap
the greatest benefit. Now is the time for Congress to examine real estate funding and coordinate
these programs around a clear set of goals and policy objectives. These changes will yield better
returns on taxpayer investment while strengthening the real estate market over time. By examining
and reforming federal real estate programs, legislators can allow communities across the country
to grow stronger and more vibrant.
13Appendix A
TABLE 1
Federal loan guarantees and new loan commitments for housing programs,
FY 2007–2011
This table shows the major federal loan and loan guarantee programs for both single-family and multifamily
housing. The major programs are in HUD’s Federal Housing Administration or in USDA’s Rural Development
program. In order to understand consistent federal support for these programs, these figures do not include
funding provided by the American Reinvestment and Recovery Act.
Federal Housing Administration (HUD)
FHA Multifamily loan guarantee commitments $0.112 trillion
FHA Single-family loan guarantee commitments $1.104 trillion
Total FHA loan guarantees and commitments $1.216 trillion
Rural Development (USDA)
Section 502 (Single-family homeownership direct loans) $0.006 trillion
Guarantee authority for new loan commitments $0.032 trillion
Total USDA loan guarantees and commitments $0.038 trillion
Total loan guarantees and commitments for housing programs $1.254 trillion
TABLE 2
Federal loan guarantees and new loan commitments on non-housing programs,
FY 2007–2011
These federal programs provide loans and loan guarantees to commercial real estate in general and to build
facilities specific for rural development.
Department of Energy (DOE)
Section 1705 Loan Guarantee Program $6 billion
Total DOE loan guarantees and commitments for non-housing $6 billion
programs
Department of Agriculture (USDA)
Community Facilities Program Direct Loans $2 billion
Business and Industry Loan Guarantees $5 billion
Rural Broadband Direct Loans $1.2 billion
Rural Water and Waste Disposal Direct Loans $4 billion
Electric Program Direct Loans $27 billion
14Telecommunications Program Direct Loans $3 billion
Total USDA loan guarantees and commitments for non-housing $42 billion
programs
Small Business Administration (SBA)
7(a) Guaranteed Loan Program $44 billion
Section 504 Certified Development Companies $17 billion
Total SBA loan guarantees and commitments for non-housing $61 billion
programs
Total federal loan guarantees and commitments for non-housing
$109 billion
programs
TABLE 3
Tax expenditures, FY 2007–2011
This table presents the total tax expenditures on real estate through programs administered by the
Department of Treasury from FY 2007 to FY 2011. The first three programs—MID, local property tax
deduction and capital gains exclusion—provide nearly 90 percent of the federal tax expenditures subsidy to
real estate.
Deduction for mortgage interest $396 billion
Deductibility of state and local property tax on owner-occupied homes $106 billion
Capital gains exclusion on home sales $94 billion
Single-family mortgage revenue bonds $6 billion
Multifamily mortgage revenue bonds $4 billion
Low-Income Housing Tax Credit $29 billion
Historic Preservation Tax Credits $2 billion
Rehabilitation of non-historic structures tax credit $0.8 billion
Depreciation of rental housing in excess of alternative depreciation system $24 billion
New Market Tax Credit $3 billion
Like-kind exchanges $14 billion
Energy efficient commercial building deduction $0.600 billion
Tax-exempt private activity facility bonds for green buildings $0.200 billion
Expensing of environmental remediation costs $0.600 billion
Total tax expenditures $680 billion
15TABLE 4
Direct grants and credit subsidies, FY 2007–2011
Direct grants from federal programs provide focused assistance into the real estate sector to serve specific
needs, often in support of lower-income households. Credit subsidies reduce the cost of loans to specific
Department Housing and Urban Development (HUD)
HOME $9 billion
Community Development Block Grant program $19 billion
Project-Based Rental Assistance $37 billion
Tenant-Based Rental Assistance $84 billion
Public Housing Capital Fund $12 billion
Total HUD grants $184 billion
Department of Energy (DOE)
Weatherization Assistance Program $1.4 billion
Total DOE grants $1.4 billion
Department of Agriculture (USDA)
Community Facilities Program direct loan subsidy $0.05 billion
Business and Industry Program direct loan subsidy $0.87 billion
Total USDA credit subsidies $0.92 billion
Small Business Administration (SBA)
7a Guaranteed Loan credit subsidy $0.07 billion
Total SBA credit subsidies $0.07 billion
Total direct grants and credit subsidies $187 billion
16Appendix B
TABLE 1
Comparison of multifamily and homeowner tax and direct expenditures
From 2007 to 2011, the federal government provided more than $800 billion in tax credits and direct
expenditures for single-family and multifamily housing. This includes about $606 billion in tax and direct
expenditures on single-family housing and $227 billion for multifamily housing.
Multifamily tax expenditures
Low Income Housing Tax Credit (Section 42) $29 billion
Historic Credits for Rental Housing $0.8 billion
Depreciation of rental housing in excess of alternative depreciation system $24 billion
Multifamily mortgage revenue bonds (Section 141) $4 billion
Total multifamily tax expenditures $58 billion
Multifamily direct expenditures
HOME Program Rental $5 billion
Community Development Block Grants $4 billion
Project-Based Rental Assistance $37 billion
Tenant-Based Rental Assistance $84 billion
Public Housing Capital Fund $12 billion
HOPE VI/Choice Neighborhoods $1 billion
Public Housing Operating Fund $22 billion
Rural Housing Rental Assistance $4 billion
Total multifamily direct expenditures $169 billion
Homeowner tax expenditures
Deduction for mortgage interest on owner-occupied residences (sec 163 (h)) $396 billion
Deductibility of state and local property tax on owner-occupied homes (Sec 164) $106 billion
Capital gains exclusion on home sales $94 billion
Single-family mortgage revenue bonds $6 billion
Total homeowner tax expenditures $601 billion
Homeowner direct expenditures
HOME Program Homeowner/Buyer Assistance $4 billion
Weatherization Assistance Program $1.4 billion
Total homeowner direct expenditures $5 billion
Five year total multifamily and homeowner tax and direct expenditures $833 billion
17Endnotes
1 From an inventory of 50 federal programs included in the federal budget for FY 2007-2011.
2 Center for American Progress. (2012, October 11). “The Federal Housing Administration Saved the Housing
Market.” Retrieved November 15, 2012, from http://www.americanprogress.org/wp-
content/uploads/2012/10/Griffith_FHA.pdf.
3 Department of Housing and Urban Development. (2012, February 13). Housing and Communities Built to Last.
Retrieved November 16, 2012, from http://portal.hud.gov/hudportal/documents/huddoc?id=CombBudget2013.pdf.
4 See Table 2 in Appendix A for breakout.
5 Enterprise Community Partners. (2012, July 20). Issue Background: Low-Income Housing Tax Credit. Retrieved
November 30, 2012, from http://www.enterprisecommunity.com/policy-and-advocacy/issues/tax-incentives/low-
income-housing-tax-credits.
6 Center for American Progress. (2012, October 11). “The Federal Housing Administration Saved the Housing
Market.” Retrieved November 15, 2012, from http://www.americanprogress.org/wp-
content/uploads/2012/10/Griffith_FHA.pdf.
7 Elliott, D. (2011). The Federal Government as Banker. Uncle Sam in Pinstripes. Washington, DC: Brookings
Institution Press. Retrieved November 17, 2012, from
http://www.brookings.edu/~/media/press/books/2011/10/unclesaminpinstripes/unclesaminpinstripes_chapter.pdf.
8 Federal Housing Finance Agency. (2012, February 21). A Strategic Plan for Enterprise Conservatorships: The Next
Chapter in a Story that Needs an Ending. Retrieved October 23, 2012, from
http://www.fhfa.gov/webfiles/23344/StrategicPlanConservatorshipsFINAL.pdf.
9 Department of Defense and Full-Year Continuing Appropriations Act, 2011, H.R. 1473, 112th Congress, 1st
Session. (2011). Retrieved November 17, 2012, from http://www.gpo.gov/fdsys/pkg/BILLS-
112hr1473rds/pdf/BILLS-112hr1473rds.pdf.
10 Based on the tables provided. Total support of owner vs. renter programs in tax, direct grants, and loan guarantees.
11 Reason Foundation. (2011, August 19). Ending a Failed Social Policy. Retrieved May 31, 2012, from
http://reason.org/news/show/case-for-dropping-mortgage-deduction.
12 Center for American Progress. (2011, May). Budgeting for Growth and Prosperity. Retrieved November 17, 2012,
from http://www.americanprogress.org/wp-content/uploads/issues/2011/05/pdf/budget_for_growth.pdf.
13 National Multi Housing Council. (2011). Quick Facts: Resident Demographics. Retrieved May 18, 2012, from
http://www.nmhc.org/Content.cfm?ItemNumber=55508.
14 U.S. Census Bureau. (2011). American Community Survey. Median household income the past 12 months (in 2011
inflation-adjusted dollars) by tenure. Retrieved October 5, 2012, from
http://factfinder2.census.gov/faces/tableservices/jsf/pages/productview.xhtml?pid=ACS_11_1YR_B25119&prodTyp
e=table.
15 National Low Income Housing Coalition. (2012, September). Renters in Foreclosure: A Fresh Look at an Ongoing
Problem. Retrieved November 17, 2012, from http://nlihc.org/sites/default/files/Renters_in_Foreclosure_2012.pdf.
16 Urban Institute. (2008, December). Federal Programs for Addressing Low-Income Housing Needs. Retrieved
November 17, 2012, from http://www.urban.org/UploadedPDF/411798_low-income_housing.pdf.
17 Urban Land Institute. (2012). Emerging Trends in Real Estate. Retrieved October 18, 2012, from
http://www.uli.org/wp-content/uploads/ULI-Documents/Emerging-Trends-in-Real-Estate-US-2013.pdf.
18 National Housing Conference. (2010, October). Government-Sponsored Enterprises and Multifamily Housing
Finance: Refocusing on Core Functions. Retrieved November 17, 2012, from
http://www.nhc.org/media/files/Recap_NHC_GSE_Core_Functions.pdf.
19 U.S. Census Bureau. (2012, July 27). Residential vacancies and homeownership in the second quarter of 2012.
Retrieved October 19, 2012, from http://www.census.gov/housing/hvs/files/qtr212/q212press.pdf.
20 U.S. Census Bureau. (2011). American Community Survey. Financial characteristics for housing units with a
mortgage. Retrieved October 19, 2012, from http://www.census.gov/housing/hvs/files/qtr212/q212press.pdf.
21 David Rosen & Associates. Based on data from the Joint Committee on Taxation and the American Housing Survey,
from Department of Housing and Urban Development and the Government Accounting Office.
22 Strategic Economics, Inc. and Calthorpe Associates. (2010). “Vision California Fiscal Impact Analysis.”
23 Ibid.
24 Leinberger, C. (2009). The Option of Urbanism: Investing in a New American Dream. Washington, DC: Island Press.
25 Social Impact Research Center. (2011). The Social and Economic Value of Human Services. Retrieved November
17, 2012, from http://www.heartlandalliance.org/whatwedo/advocacy/reports/human-services-effectivness-
evidence-110511.pdf.
18Smart Growth America advocates for people who want to live and work in great
neighborhoods. We believe smart growth solutions support thriving businesses and
jobs, provide more options for how people get around and make it more affordable
to live near work and the grocery store. Our coalition works with communities
to fight sprawl and save money. We are making America’s neighborhoods great
together.
Smart Growth America is the only national organization dedicated to researching,
advocating for and leading coalitions to bring smart growth practices to more
communities nationwide. Visit us online at www.smartgrowthamerica.org.
1707 L St. NW Suite 250, Washington, DC 20036
202-207-3355
www.smartgrowthamerica.orgYou can also read