EXPOSURE ASSESSMENT AND RISK CHARACTERISATION FOR THE DEVELOPMENT OF A PM2.5 STANDARD - National Environment Protection Council Service Corporation
←
→
Page content transcription
If your browser does not render page correctly, please read the page content below

EXPOSURE ASSESSMENT AND RISK
CHARACTERISATION FOR THE DEVELOPMENT OF
           A PM2.5 STANDARD

                     FINAL REPORT

                       Prepared for

    National Environment Protection Council
              Service Corporation

                           by

                M Burgers and S Walsh
       Environment Protection Authority of Victoria

                    September 2002
1. INTRODUCTION

This report describes the outcomes from the consultancy “Exposure
Assessment and Risk Characterisation for the Development of a PM2.5
Standard” undertaken for the National Environment Protection Council
Service Corporation (NEPCSC).

The consultancy consisted of three main tasks:

I.      Assessment of Population Exposure

Estimates of population exposure to PM2.5 have been prepared for Sydney,
Melbourne, Brisbane and Perth using daily 24-hour average and annual
average PM2.5 concentrations for three consecutive years.

II.     Identification of Health Effects at Current Levels of Exposure

The health risks associated with current levels of PM2.5 in Sydney,
Melbourne, Brisbane and Perth have been estimated using the exposure
data derived in I above and dose-response relationships provided by the
NEPC Project Team. Table 1 lists the health endpoints considered in this
study.

Table 1. Health endpoints included in the health risk characterisation.
Endpoint     Description                                                  Age group
             Short Term
             Mortality
S1           • All cause                                                  All ages
S2           • Respiratory                                                All ages
S3           • Cardiovascular                                             All ages

             Hospital Admissions
S4           • Asthma                                                     All ages
S5           • Cardiovascular disease                                     Elderly
S6           • Chronic obstructive pulmonary disease                      Elderly

             Long Term
             Mortality
L1           • All cause                                                  All ages
L2           • Lung cancer                                                All ages
L3           • Cardiopulmonary disease                                    All ages

Baseline health incidence data for each health endpoint and for each city
(Sydney, Melbourne, Brisbane and Perth) have also been provided by the
NEPC Project Team.

                                                                                      2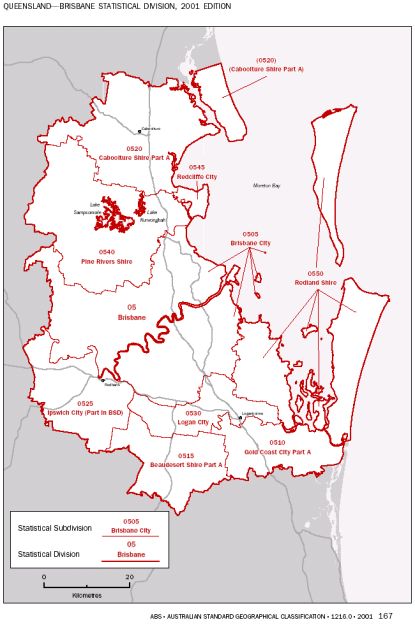
III.   Scenario Evaluation

To guide the development of PM2.5 standards in Australia, the NEPC
Project Team proposed a range of PM2.5 concentrations that could be
considered as possible standards. In this report, these concentrations are
referred to as ‘scenario levels’. The scenario levels considered are 35, 30,
25 and 20 µg/m3 for 24-hour PM2.5, and 10, 8 and 5 µg/m3 for annual
average PM2.5.

To model each scenario, the current PM2.5 concentrations in each city were
adjusted so that they were at or below the scenario level. The health
outcomes associated with these adjusted concentrations were then
calculated. These results were compared with the health outcomes
associated with current PM2.5 levels, to estimate the health outcomes that
would be avoided in each scenario.

                                                                          3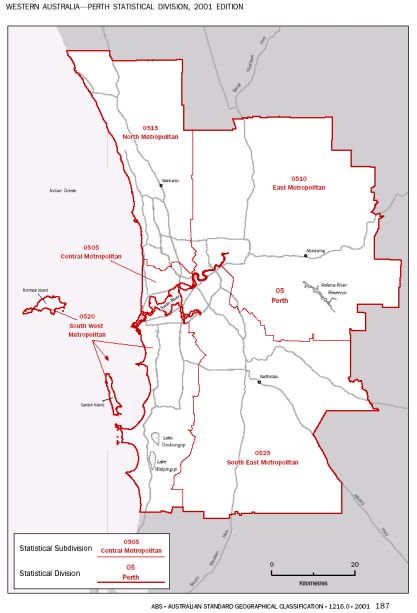
2. METHODOLOGY

The methodology for this project is that described in the USEPA
publication “Proposed Methodology for Particulate Matter Risk Analyses for
Selected Urban Areas” (USEPA, 2002). In order to adapt the USEPA
methodology to the requirements stated in the Consultancy Brief, some
minor modifications were made. The methodology used for each main
task is described below, with any changes from the USEPA methodology
indicated in the text.

2.1. Assessment of Population Exposure

Exposure data have been derived for each city by averaging the reported
PM2.5 concentrations across the city’s monitoring network. The averaged
concentration data are assumed to be representative of the ambient PM2.5
concentrations to which the city’s population is exposed. This approach is
consistent with what has been done in epidemiological studies estimating
PM2.5 concentration-response functions, used in the subsequent health risk
characterisation.

2.1.1 COMPOSITE CONCENTRATIONS

A spatially-averaged composite data set has been created for Sydney,
Melbourne, Brisbane and Perth by averaging data across suitable
population-oriented monitoring sites. The composite daily 24-hour data
consist of the average of the daily 24-hour PM2.5 concentrations at all sites
for which data were available on each day. Table M1 displays some
sample 24-hour PM2.5 data for July 1998 in Melbourne, with the annual
maximum concentrations for that year shown in the last row. Note that
the annual maximum composite (bottom right entry in Table M1) is the
maximum of the daily composite values (not the average of the station
annual maximum values).

Table M1. Sample 24-hour PM2.5 concentrations (in µg/m3) for the Alphington,
Brighton and Footscray monitoring stations and composite data in Melbourne.
Date       Alphington Brighton     Footscray Composite
        …            …          …            …       …
 20-Jul-98         13.0       11.0         12.4    12.1
 21-Jul-98         19.9       15.2         14.5    16.5
 22-Jul-98         12.2        7.0          6.3     8.5
 23-Jul-98         15.4       16.0         12.0    14.5
 24-Jul-98         22.4       18.0         20.1    20.1
 25-Jul-98         34.0       24.8         24.6    27.8
 26-Jul-98         25.0       24.9         22.0    24.0
        …            …          …            …       …
Max. 1998          34.0       31.0         35.7    33.2

The composite annual average PM2.5 concentrations for each city were
calculated similarly by taking the mean of the monitor-specific annual

                                                                               4
average concentrations. All calculations were performed for each year of
data provided.
In the USEPA methodology, the annual average PM2.5 concentrations at
the individual monitoring sites are derived by calculating the mean of the
average concentrations for the four quarters of the year. The average
quarterly concentrations are based on 24-hour PM2.5 concentrations. In
this project, the annual average concentrations at the individual
monitoring sites have been supplied directly by the NEPC Project Team.
2.1.2 FREQUENCY DISTRIBUTIONS
For each city and for each year of data, a frequency distribution was
calculated based on the composite daily 24-hour PM2.5 data. This was
done by allocating each daily concentration value x to a PM2.5
concentration ‘bin’, representing a 2 µg/m3 range of concentrations
starting at 0 < x 2 µg/m3, up to 34 < x 36 µg/m3. All concentrations
above 36 µg/m3 were placed in a separate bin. The frequency of
occurrence of each concentration range is expressed as a percentage of
the total number of occurrences, ie. as a percentage of the total number
of days for which data were available. The results are presented as bar
graphs in Section 4 of this report.
For each frequency distribution an inverse cumulative frequency
distribution was constructed linking PM2.5 concentration x with the number
of days on which the concentration was higher than x. The inverse
cumulative frequency distribution is a useful tool for describing air
pollution data as it indicates the frequency of events where levels are
greater than x, in other words, the frequency of extreme events. It is
expressed as a percentage of the total number of occurrences in the same
way as for the main frequency distribution (see above), and results are
presented as line graphs in Section 4.
The above calculations were repeated for each city using the combined
data for the three-year period.
2.1.3 POPULATION
Since city-wide average PM2.5 concentrations are used, the number of
people exposed in each city is assumed to be the population of that city.
The population of each city has been estimated using the 2001 Census
data for each city’s Statistical Division from the Australian Bureau of
Statistics.
52.2 Identification of Health Effects at Current Levels of
Exposure
The health effects at current levels of exposure to PM2.5 have been
estimated by calculating the change in the number of cases for each
health endpoint corresponding to a change in PM2.5 concentration from
current levels down to background. Therefore, for a given health
endpoint, the estimate of the number of cases associated with current
levels of exposure is actually an estimate of the difference between the
number of cases at current levels and the number of cases at background
level. Note that the health outcomes associated with PM2.5 levels below
background are not necessarily zero.
For the short-term health endpoints S1 to S6 in Table 1, the current PM2.5
concentrations are the composite daily concentrations for each city. For
the long-term endpoints L1 to L3, the current PM2.5 concentrations are the
composite annual average concentrations for each city.
2.2.1 BACKGROUND LEVELS OF PM2.5
Since the health outcomes are calculated only for PM2.5 concentrations
above background, estimates of background PM2.5 concentrations are
needed for each city.
The background PM2.5 concentration is defined as the ‘natural’
background, excluding all anthropogenic contributions. Note that the
concentration and composition of background PM2.5 can vary with
geographic location, from monitoring site to monitoring site; with season
of the year; and with meteorological conditions which affect the emissions
and secondary production of biogenic or geogenic species to the
background (USEPA, 1996b).
Following the advice of the NEPC Project Team, the background
concentration has been estimated by taking the average of the 5th
percentile 24-hour PM2.5 concentrations for the four cities. This results in
a value of 4.81 µg/m3. The same background level has been used for all
four cities.
2.2.2 DOSE-RESPONSE FUNCTIONS AND ESTIMATING HEALTH OUTCOME
CHANGES
For a given health endpoint, the change in the number of cases, ∆y = y0 –
y, corresponding to a change in concentration ∆x = x0 – x, is given by:
∆y = y(eβ∆x – 1) [1]
where y0 is the number of cases of that endpoint associated with a
specified ambient PM2.5 concentration x0, y is the baseline incidence rate,
6and x is the measure of ambient “as is” PM2.5 concentration (USEPA,
2002).
Calculation of the coefficient β
The dose-response functions provided by the NEPC Project Team are
expressed as a percentage increase in the number of cases of a given
health endpoint associated with a 10 µg/m3 increase in PM2.5
concentration. For example, a 10 µg/m3 change in peak 24-hour PM2.5 is
associated with a 1.7% increase in hospital admissions for cardiovascular
disease in the elderly (endpoint S5 in Table 1). In order to apply this
dose-response function to other concentration changes according to
Equation 1 above, it was necessary to calculate the value of the coefficient
β for each health endpoint.
The percentage increase in the number of cases of a given health
endpoint, z, corresponding to a given change in concentration, ∆x, is given
by
z = ∆y/y * 100 [2]
Using Equation 1,
eβ∆x = 1 + z/100 [3]
The term eβ∆x is also known as the relative risk associated with the
concentration change ∆x. Rearranging Equation 3 gives:
β = [ ln(1 + z/100) ] / ∆x [4]
Equation 4 was used to estimate values of the coefficient β for each health
endpoint using the dose-response data provided by the NEPC Project
Team (see Section 3.3) and a value of 10 µg/m3 for ∆x.
Baseline health effects incidence data
Calculating the change in the number of cases ∆y for a given health
endpoint corresponding to a given change in concentration according to
Equation 1 also requires knowledge of y, the baseline health effect
incidence rate. Baseline health incidence rates express the occurrence of
a disease or event (e.g., hospital admission for asthma, death) in a
specific period of time, usually per year or per day. Typically the rates are
expressed as a value per population group (e.g. the number of cases in
Melbourne). Incidence rates vary among geographic areas due to
differences in population characteristics (e.g., age distribution) and factors
promoting illness (e.g., smoking, air pollution levels). For a given
geographic area, incidence rates also vary over time.
7Baseline health effect incidence data have been provided for Sydney,
Melbourne, Brisbane and Perth by the NEPC Project Team (see Section
3.2).
The baseline health incidence rates were converted to per-capita rates so
that they could be applied to the appropriate population size. Any
incidence rates provided as annual values were also converted to average
daily rates by dividing by 365.
Short-term health effects
The health outcomes for the short-term endpoints S1 to S6 in Table 1
were estimated for each city on an annual basis by summing the daily
changes in the number of cases for each health endpoint, calculated using
Equation 1, for each year of data provided. The daily changes in the
number of cases (cases at current levels – cases at background level) for
each endpoint were calculated using 24-hour PM2.5 concentrations, a
constant background concentration, the β coefficient derived from the
endpoint’s dose-response function, and the daily baseline incidence rate
for the endpoint specific to the city.
The annual health outcomes for each endpoint were adjusted for any
missing 24-hour PM2.5 data to take into account the full year. This was
done by multiplying the annual estimates by the ratio of the total number
of days in the year (365 or 366) to the number of days for which 24-hour
PM2.5 data were available. For example, data were missing at all
Melbourne monitoring sites on 6 March 1998. As a result the health
outcomes for Melbourne in 1998 were initially calculated for 364 days.
The health outcomes were then adjusted by multiplying with the factor
365/364.
Whilst the USEPA risk analysis is based on a single year, the current
analysis is based on a three-year period. The annual health outcomes for
the three years of PM2.5 data for each city were averaged to provide
estimates of the average annual number of cases of each health endpoint
attributable to PM2.5.
Long-term health effects
The health outcomes for the long-term endpoints L1 to L3 in Table 1 were
estimated for each city by calculating the annual changes in the number
of cases for each health endpoint using Equation 1 for each year of data
provided. The annual changes in the number of cases (cases at current
levels – cases at background level) for each endpoint were calculated
using annual average PM2.5 concentrations, a constant background
concentration, the β coefficient derived from the endpoint’s dose-response
function, and the annual baseline incidence rate for the endpoint specific
to the city. The baseline incidence rates were first converted to annual
rates by multiplying the daily incidence rates by the total number of days
in the year.
8As for the short-term health outcomes, the annual health outcomes for
the three years of PM2.5 data were averaged to provide estimates of the
average annual number of cases of each health endpoint attributable to
PM2.5.
2.2.3 STATISTICAL UNCERTAINTY IN HEALTH EFFECTS
A 95% confidence interval has been calculated around the health effect
estimates based on the 95% confidence intervals provided with the dose-
response data.
2.2.4 SENSITIVITY ANALYSES
Two sensitivity analyses have been performed as part of this study to
determine the effect of different possible input values or different
assumptions on the health effect estimates. The results from both
sensitivity analyses are presented in Section 5 of the report.
Sensitivity to Background PM2.5
The sensitivity of the health effect estimates to different assumptions
about background PM2.5 levels has been investigated by repeating the
calculations using two alternative values for the background level. The
results from this analysis are presented in Section 5.2.2.
Sensitivity to Mathematical Form of the Dose-Response Relationship
A second sensitivity analysis has been undertaken to determine the effect
of using a different mathematical form for the dose-response relationship.
Instead of the exponential form of the dose-response relationship, a linear
form of the equation is considered in which the change in the number of
cases of a given health endpoint ∆y corresponding to a change in
concentration ∆x is represented by:
∆y = m ∆x [5]
Here m is the slope of the linear relationship, with units of health
outcomes per µg/m3.
The dose-response functions provided by the NEPC Project Team are
expressed as a percentage increase in health outcomes associated with a
10 µg/m3 increase in PM2.5 concentration, denoted z in Section 2.2.2.
Assuming that the percentage increase in health outcomes is relative to
the baseline health incidence y, the value of m to be used in Equation 5
for a given health endpoint was calculated according to
9m = (z/100) . y . 1/∆x [6]
Equation 6 was used to recalculate the health outcomes at current levels
of exposure for a number of health endpoints using the dose-response
data provided by the NEPC Project Team and a value for ∆x of 10 µg/m3.
2.3 Scenario Evaluation
A number of scenarios have been modelled in which the PM2.5
concentrations were scaled down to be at or below a specified level
(referred to as a ‘scenario’ level). The scenario levels are 35, 30, 25 and
20 µg/m3 for peak 24-hour PM2.5, and 10, 8 and 5 µg/m3 for annual
average PM2.5. The methods used to scale down the PM2.5 concentrations
are described in Section 2.3.1 below.
For each scenario, the reductions in PM2.5-associated health effects that
would result from scaling down the PM2.5 concentrations have been
assessed by re-computing the health effects (using the procedure in
Section 2.2.2) after the adjustment to the concentrations. These were
then compared to the health effects associated with current (unadjusted)
PM2.5 concentrations.
For the 24-hour scenario levels, the reductions in PM2.5-associated health
effects have been estimated for the short-term health endpoints in Table
1, S1 – S6. For the annual average scenario levels, the reductions in
PM2.5-associated health effects have been estimated for the long-term
health endpoints L1 – L3.
2.3.1 SIMULATING PM2.5 CONCENTRATIONS THAT ARE AT OR BELOW A
PROPOSED SCENARIO LEVEL
24-Hour Levels
To adjust daily 24-hour PM2.5 concentrations so that they are at or below a
24-hour scenario level (scld), a linear rollback procedure has been used.
The rollback procedure consists of the following steps:
1. For each city, determine the maximum 24-hour PM2.5 concentration
MAXd from the monitoring sites used in the exposure assessment
and for the entire three year period of data.
2. Compute a multiplication factor fd for each city with which all daily
PM2.5 concentrations are be adjusted in order to be at or below the
24-hour scenario level scld:
fd = (scld – x0) / (MAXd – x0)
where x0 is the background PM2.5 concentration.
103. If x_day represents the composite 24-hour PM2.5 concentration for a
city on a given day, the rolled-back concentration, denoted
x_dayadj, is given by:
x_dayadj = x0 + (x_day – x0) * fd
Only the above-background concentrations were adjusted using this
procedure. For each city, all daily 24-hour concentrations for the three
year period were adjusted using the same multiplication factor fd.
However, a different value of fd was determined for each city since the
concentration reductions required for each scenario depend on the current
air quality in each city. The values for the four cities ranged between 0.75
and 1.0 for the 24-hour scenario level of 35 µg/m3, and between 0.38 and
0.56 for the 24-hour scenario level of 20 µg/m3.
In the USEPA methodology the multiplication factor determined in Step 2
above is based on the highest monitor-specific 98th percentile
concentration, rather than the highest monitor-specific peak concentration
determined in Step 1. In the present study the peak concentration was
used, because the Consultancy Brief specified scenario levels that peak
PM2.5 values were to be reduced to. Furthermore, the USEPA risk analysis
is based on only a single year of data, rather than three. Since the
present analysis is based on a three-year period, the multiplication factor
for each city was based on the data for all three years.
Annual Levels
The procedure used to adjust annual average concentrations so that they
are at or below an annual average scenario level (scla) is similar to that
used for the 24-hour scenario levels, and consists of the following steps:
1. For each city, determine the maximum annual average PM2.5
concentration MAXa from the monitoring sites used in the exposure
assessment and for the three year period of data.
2. Compute a multiplication factor fa for each city with which the
annual average concentrations for the three years are be adjusted
in order to be at or below the annual scenario level scla:
fa = (scla – x0) / (MAXa – x0)
where x0 is the background PM2.5 concentration.
3. If x_ann represents the composite annual average PM2.5
concentration for a city for one year, the rolled-back annual
average concentration, denoted x_annadj, is given by:
x_annadj = x0 + (x_ann – x0) * fa
As for the 24-hour concentrations, only the above-background annual
average concentrations were adjusted using this procedure. Since the
11present analysis is based on a three-year period, rather than a single year
as in the USEPA risk analysis, the same multiplication factor fa was used
for all three composite annual average concentrations. As for the 24-hour
scenario levels, a different value of fa was determined for each city. The
values for the four cities ranged between 0.85 and 1.0 for the annual
average scenario level of 10 µg/m3, and between 0.031 and 0.050 for the
annual average scenario level of 5 µg/m3.
123. INPUT DATA
For the exposure assessment, current PM2.5 data from population-oriented
monitoring sites are required for Sydney, Melbourne, Brisbane and Perth.
Both 24-hour and annual average data are required. Estimates are also
needed of the size of the population exposed to PM2.5 living in each city.
In addition, for both parts of the health risk characterisation, the following
analysis inputs are required:
• estimates of background PM2.5 appropriate to each location;
• dose-response functions from epidemiological studies which provide
estimates of the relation between the health endpoints in Table 1 and
PM2.5 concentration;
• baseline health effects incidence rates corresponding to current levels
of PM2.5, for each health endpoint in Table 1, and for each city.
Section 3.1 describes the air quality information used in this study.
Section 3.2 presents the baseline health effect incidence rates for the
health endpoints in Table 1, for each city. The dose-response data are
presented in Section 3.3.
3.1 Air quality data
Daily 24-hour average and annual average PM2.5 concentrations
determined using gravimetric methods (TEOM and ANSTO sampler) for
Sydney, Brisbane and Perth were provided to EPA Victoria by the NEPC
Project Team. The data were obtained from the NSW Environment
Protection Authority, the Queensland Environmental Protection Agency
and the WA Department of Environmental Protection respectively. Data
were also available for Melbourne from the Victorian monitoring network.
Since this study is restricted to the metropolitan regions of Sydney,
Melbourne, Brisbane and Perth, additional PM2.5 data provided for the
Illawarra and Lower Hunter regions in New South Wales and Bunbury in
Western Australia have been excluded from the exposure assessment.
Table 3.1 summarises the data availability including a description of the
nature of each monitoring site from which data have been obtained. Any
data exclusions and modifications are discussed below.
Use of Data from Population-Oriented Monitoring Sites Only
The USEPA methodology requires that only monitoring data from
population-oriented monitors are included in the spatial averaging
procedures. All but one monitoring station listed in Table 3.1 satisfy this
criterion, and are therefore included in the study. The exception is the
Brisbane CBD monitoring station, which has been designated as ‘Peak’.
The NEPM process specifically excludes ‘Peak’ monitoring sites. The
13Brisbane CBD station is sited within the central business district of
Brisbane and the PM2.5 levels recorded there are not considered
representative of the levels to which the general population would be
exposed. Thus data from the Brisbane CBD monitoring station have been
excluded.
Table 3.1. PM2.5 monitoring data.
City Period Monitoring Description PM2.5
Station Method
Sydney 1999 - Liverpool Mixed residential / TEOM
2001 commercial
Lidcombe Mixed residential / TEOM
commercial
Woolooware Residential TEOM
Richmond Semi-rural / residential TEOM
Westmead Residential TEOM
Earlwood Residential TEOM
Melbourne 1998 - Footscray Residential / industrial TEOM
2000 Alphington Residential TEOM
Brighton Residential TEOM
Brisbane 1999 - Brisbane CBD Peak ANSTO
2001 Rocklea Residential/ light TEOM +
industrial ANSTO
Springwood Residential TEOM
Perth 1999 - Caversham Semi-rural TEOM
2001 Duncraig Residential TEOM
PM2.5 Instrumentation
For consistency, only PM2.5 data obtained using TEOM instrumentation
have been used in this study. TEOM data were provided for all
jurisdictions. As can be seen from Table 3.1, PM2.5 data collected using
ANSTO samplers were provided for the Brisbane CBD and Rocklea
monitoring stations in Brisbane. Since data from Brisbane CBD have
already been excluded because they are not considered representative of
general exposure, this affects only ANSTO sampler data collected at the
Rocklea monitoring station for which TEOM data are also available.
All states except Queensland have used the TEOM PM10 default settings in
their TEOMs to monitor PM2.5. A function was built in to the TEOMs by the
manufacturers in order to make PM10 readings match more closely with
the US Federal Reference method (HiVol). The function is y=1.03x + 3.0,
where x is the original measurement and y the adjusted concentration.
As a result, all TEOM data from Sydney, Melbourne and Perth used in this
study have been adjusted by default using the y=1.03x + 3.0 function.
The exception is the TEOM data from Queensland. Since the correlation
between PM2.5 TEOM data and the reference method (USEPA) is not
known, it is not certain how the default adjustment should be corrected.
However, to ensure consistency with the other states, the Rocklea and
14Springwood TEOM data used in this study have been adjusted using the
same function, y=1.03x + 3.0.
Data Influenced by Major Bushfires
Very high 24-hour PM2.5 concentrations were observed during bushfires in
Sydney (25-31 December 2001) and south-east Queensland (Rocklea
monitoring station, 7-13 October 2001).
To properly assess typical exposure experienced in Australian cities,
representative data are needed. The data influenced by these major fires
are clearly not representative of typical current levels. For this reason, a
second set of PM2.5 data have been created for Sydney and Brisbane in
which the data associated with major bushfires (Sydney 25-31 December
2001 and Brisbane 7-13 October 2001) have been excluded. The health
risks associated with current levels of exposure to PM2.5 have been
estimated for both sets of data for these two cities.
Using a simple scaling or “rollback” technique, the inclusion of high
readings from a rare event would result in unrealistically low scenario
concentrations. This would underestimate the general population
exposure in all scenarios. Hence the scenario evaluation using the
“rollback” technique has been performed only using the PM2.5 data sets in
which the data influenced by major bushfires have been excluded.
Where long term health end point calculations have been done both with
and without bushfire-affected data, annual averages were required for
both situations. The original annual average data provided by the NEPC
Project Team were derived from 1-hour averages; these constitute the
“with bushfire” annual average values. To estimate the annual average
after excluding data, since the original 1-hour data were not available, the
exclusion was performed on the 24-hour data, and an annual average was
then derived from the 24-hour averages. The true 1-hour-derived annual
average was then estimated by applying a small correction factor to
account for the difference in data capture rates. The factor was simply
derived from the ratio of the original (supplied) annual average to the
annual average obtained from 24-hour values (all data included).
3.2 Baseline Health Effects Incidence Data
The per-capita daily rates for all endpoints listed in Table 1 for all four
cities are summarised in Table 3.2.
The Sydney baseline incidence rates for endpoints S1-S3 and L1 were
provided to the NEPC Project Team by the Australian Bureau of Statistics,
and for S4 - S6 by NSW Health. The baseline data for endpoints L2 and
L3 for all cities were also provided to the NEPC Project Team by the
Australian Bureau of Statistics. For Melbourne, the mortality data were
15provided by ABS, and the hospital admissions data were provided by the
Victorian Department of Human Services. All data for Brisbane and Perth
were obtained by the NEPC Project Team from the relevant State health
authorities. For Brisbane, the relevant population is that of the ‘Brisbane
City’ Statistical Subdivision as defined by the Australian Bureau of
Statistics. For Perth the relevant population was assumed to be that of
the Perth Statistical Division. The source data are given in Appendix 1.
Table 3.2. Per-capita baseline incidence rates expressed as daily incidence per
100,000.
End- Description Age Sydney Melbourne Brisbane Perth
point group
Short Term
Mortality
S1 All cause All ages 1.65 1.85 1.98 1.62
S2 Respiratory All ages 0.14 0.15 0.19 0.16
S3 Cardiovascular All ages 0.72 0.81 0.92 0.66
Hospital
Admissions
S4 Asthma All ages 0.84 0.62 0.73 0.69
S5 Cardiovascular Elderly 16.93 15.63 17.37 17.60
disease
S6 COPD Elderly 3.37 1.28 2.35 2.98
Long Term
Mortality
L1 All cause All ages 1.65 1.85 1.98 1.62
L2 Lung cancer All ages 0.094 0.093 0.102 0.105
L3 Cardiopulmonary All ages 0.85 0.76 0.85 0.75
disease
3.3 Dose-Response Relationships
Table 3.3 summarises the dose-response information for each health
endpoint in Table 1. The data were provided by the NEPC Project Team.
The dose-response relationships are presented as a percentage increase
per 10 µg/m3 increase in PM2.5 concentration, together with a 95%
confidence interval.
The dose-response relationships have been used to derive a value of the
PM2.5 coefficient β with a 95% confidence interval for each endpoint,
assuming a log-linear form of the dose-response function (see Section
2.2.2).
16Table 3.3. Dose-response data for the health endpoints specified in Table 1.
End- Description Age %Increase β
point group per 10 µg/m3
increase in
PM2.5
Short Term
Mortality
S1 All cause All ages 2.3 0.0023
(1.3, 3.3) (0.0013, 0.0032)
S2 Respiratory All ages 8.6 0.0083
(5.2, 12.4) (0.0051, 0.0117)
S3 Cardiovascular All ages 1.04 0.0010
(0.15, 1.94) (0.0002, 0.0019)
Hospital Admissions
S4 Asthma All ages 2.6 0.0026
(1, 4.2) (0.0010, 0.0041)
S5 Cardiovascular disease Elderly 1.7 0.0017
(1, 2.4) (0.0010, 0.0024)
S6 Chronic obstructive Elderly 2.0 0.0020
pulmonary disease (0.4, 3.8) (0.0004, 0.0037)
Long Term
Mortality
L1 All cause All ages 6 0.0058
(2, 11) (0.0020, 0.0104)
L2 Lung cancer All ages 14 0.0131
(4, 23) (0.0039, 0.0207)
L3 Cardiopulmonary All ages 9 0.0086
disease (3, 16) (0.0030, 0.0148)
174. RESULTS
4.1 Sydney
4.1.1 SYDNEY EXPOSURE ASSESSMENT
A map displaying the physical boundaries of the Sydney Statistical
Division as defined by the Australian Bureau of Statistics is shown in
Figure E1a. The location of each relevant monitoring site as listed in
Table 3.1 is also indicated. Population data for the Sydney Statistical
Division are given in Table E1a.
Table E1a. Population of the Sydney Statistical Division, 2001.
Age Group Population
0-14 798,826
65+ 472,821
All ages 3,997,321
Severe bushfires led to unusually high PM2.5 levels at all Sydney
monitoring stations between 25 and 31 December 2001. Analyses are
presented both including and excluding the bushfire affected data.
Frequency graphs of the daily 24-hour PM2.5 data are presented in Figures
E1b(1) and E1b(2) for 1999, 2000 and 2001. Following the methodology
outlined in Section 2.1, the graphs display the composite PM2.5
concentrations, obtained by averaging the daily data from the Liverpool,
Lidmore, Woolooware, Richmond, Westmead and Earlwood monitoring
stations.
Figures E1c(1) and E1c(2) display the inverse cumulative frequency
distributions for 1999, 2000 and 2001, linking the PM2.5 concentration x
with the percentage of days on which the concentration was higher than
x.
Tables E1b-d summarise the results for 1999, 2000 and 2001
respectively. Shown in these tables are the maximum 24-hour average
PM2.5 concentrations at each monitoring site and the maximum composite
24-hour PM2.5 concentration for each year. Note that the maximum
composite PM2.5 concentration is not necessarily an average of the
maximum concentrations at the individual monitoring sites. This is
because the maximum concentrations at the monitoring sites were not
always all recorded on the same day of the year.
To give a further indication of the frequency distribution of the daily PM2.5
concentrations, the number of days per year on which the concentration
was higher than each of the 24-hour scenario levels (20, 25, 30 and 35
µg/m3) are also reported in Tables E1b-d.
Table E1e displays the 3-year overall maximum 24-hour average PM2.5
concentrations for 1999-2001, and the total number of days on which the
18concentration was higher than each 24-hour scenario level during this
period.
Table E1b. 24-Hour PM2.5 results for Sydney, 1999.
Liverpool Lidcombe Woolooware Richmond Westmead Earlwood Composite
Maximum 24-hour
25.4 26.2 23.2 33.1 25.3 27.6 25.1
PM2.5 (µg/m3)
# Days > 20 µg/m3 5 7 1 3 3 10 1
# Days > 25 µg/m3 1 1 0 1 1 4 1
# Days > 30 µg/m3 0 0 0 1 0 0 0
# Days > 35 µg/m3 0 0 0 0 0 0 0
Table E1c. 24-Hour PM2.5 results for Sydney, 2000.
Liverpool Lidcombe Woolooware Richmond Westmead Earlwood Composite
Maximum 24-hour
45.1 45.1 33.2 * * 35.4 37.6
PM2.5 (µg/m3)
# Days > 20 µg/m3 12 3 7 * * 6 6
# Days > 25 µg/m3 5 2 3 * * 3 3
# Days > 30 µg/m3 2 1 2 * * 2 2
# Days > 35 µg/m3 2 1 0 * * 1 1
(*) insufficient data (< 75% of the year) available
Table E1d(1). 24-Hour PM2.5 results for Sydney, 2001 (December 2001 bushfires excluded).
Liverpool Lidcombe Woolooware Richmond Westmead Earlwood Composite
Maximum 24-hour
24.4 24.8 23.7 * * 26.6 23.3
PM2.5 (µg/m3)
# Days > 20 µg/m3 9 2 7 * * 19 3
# Days > 25 µg/m3 0 0 0 * * 2 0
# Days > 30 µg/m3 0 0 0 * * 0 0
# Days > 35 µg/m3 0 0 0 * * 0 0
(*) insufficient data (< 75% of the year) available
Table E1d(2). 24-Hour PM2.5 results for Sydney, 2001 (December 2001 bushfires included).
Liverpool Lidcombe Woolooware Richmond Westmead Earlwood Composite
Maximum 24-hour
118.6 82.9 81.9 * * 81.7 93.7
PM2.5 (µg/m3)
# Days > 20 µg/m3 15 7 9 * * 26 10
# Days > 25 µg/m3 6 4 2 * * 8 7
# Days > 30 µg/m3 6 4 1 * * 6 7
# Days > 35 µg/m3 6 4 1 * * 5 6
(*) insufficient data (< 75% of the year) available
19Table E1e(1). 24-Hour PM2.5 results for Sydney, 1999-2001 (December 2001 bushfires excluded).
3 Year Period Liverpool Lidcombe Woolooware Richmond Westmead Earlwood Composite
Maximum 24-hour
45.1 45.1 33.2 * * 35.4 37.6
PM2.5 (µg/m3)
# Days > 20 µg/m3 26 12 15 * * 35 10
# Days > 25 µg/m3 6 3 3 * * 9 4
# Days > 30 µg/m3 2 1 2 * * 2 2
# Days > 35 µg/m3 2 1 0 * * 1 1
(*) insufficient data (< 75% of the year) available
Table E1e(2). 24-Hour PM2.5 results for Sydney, 1999-2001 (December 2001 bushfires included).
3 Year Period Liverpool Lidcombe Woolooware Richmond Westmead Earlwood Composite
Maximum 24-hour
118.6 82.9 81.9 * * 81.7 93.7
PM2.5 (µg/m3)
# Days > 20 µg/m3 32 17 17 * * 42 17
# Days > 25 µg/m3 12 7 5 * * 15 11
# Days > 30 µg/m3 8 5 3 * * 8 9
# Days > 35 µg/m3 8 5 1 * * 6 7
(*) insufficient data (< 75% of the year) available
The annual average PM2.5 concentrations derived from hourly data at each
monitoring site and the composite annual average concentrations are
shown in Tables E1f(1) and E1f(2).
The supplied annual averages included the bushfire-affected data, and are
shown in Table E1f(2).
To estimate the annual averages excluding the bushfire, daily averages
without the 25-31 December 2001 data were averaged. Then a correction
factor was applied to account for the difference between 1-hour derived
annual averages and 24-hour derived annual averages. The results are
shown in Table E1f(1).
Table E1f(1). Estimated annual average PM2.5 results for Sydney (Dec 2001 bushfire excluded)
Year Liverpool Lidcombe Woolooware Richmond Westmead Earlwood Composite
1999 9.7 10.0 8.1 6.7 9.9 10.2 9.1
2000 10.4 9.9 9.6 * * 10.3 10.1
2001 10.8 10.5 10.9 * * 10.7 10.4
Table E1f(2). Annual average PM2.5 results for Sydney (Dec 2001 bushfires included)
Year Liverpool Lidcombe Woolooware Richmond Westmead Earlwood Composite
1999 9.7 10.0 8.1 6.7 9.9 10.2 9.1
2000 10.4 9.9 9.6 * * 10.3 10.1
2001 11.8 11.1 11.1 * * 11.6 11.4
20Richmond
Westmead
Lidcombe
Earlwood
Liverpool
Woolooware
21Figure E1a. Map of the Sydney Statistical Division. The locations of the PM2.5 monitoring
stations are indicated with blue stars.
SYDNEY
24-hour PM2.5 Frequency Distribution
35%
1999
2000
30%
2001
25%
%Frequency
20%
15%
10%
5%
0%
2 4 6 8 10 12 14 16 18 20 22 24 26 28 30 32 34 36 >36
µg/m )
3
PM2.5 concentration (µ
Figure E1b(1). Frequency distribution of composite daily 24-hour PM2.5 concentrations in
Sydney for 1999, 2000 and 2001. Bushfire-affected data (25-31 December 2001) have
been excluded. The concentrations for the frequency distribution on the X-axis denote
concentration bins of X-2 to X µg/m3.
SYDNEY
24-hour PM2.5 Frequency Distribution
35%
1999
2000
30%
2001
25%
%Frequency
20%
15%
10%
5%
0%
2 4 6 8 10 12 14 16 18 20 22 24 26 28 30 32 34 36 >36
µg/m3)
PM2.5 concentration (µ
Figure E1b(2). Frequency distribution of composite daily 24-hour PM2.5 concentrations in
Sydney for 1999, 2000 and 2001. Bushfire-affected data (25-31 December 2001) have
been included. The concentrations for the frequency distribution on the X-axis denote
concentration bins of X-2 to X µg/m3.
22SYDNEY
%Days where 24-hour PM2.5 > x
100%
1999
2000
2001
80%
60%
%Days
40%
20%
0%
0 2 4 6 8 10 12 14 16 18 20 22 24 26 28 30 32 34 36
µg/m3)
x (µ
Figure E1c(1). Inverse cumulative frequency distribution (percentage of days above each
concentration level) of composite daily 24-hour PM2.5 concentrations in Sydney for 1999,
2000 and 2001. Bushfire-affected data (25-31 December 2001) have been excluded.
SYDNEY
%Days where 24-hour PM2.5 > x
100%
1999
2000
2001
80%
60%
%Days
40%
20%
0%
0 2 4 6 8 10 12 14 16 18 20 22 24 26 28 30 32 34 36
µg/m3)
x (µ
Figure E1c(2). Inverse cumulative frequency distribution (percentage of days above each
concentration level) of composite daily 24-hour PM2.5 concentrations in Sydney for 1999,
2000 and 2001. Bushfire-affected data (25-31 December 2001) have been included.
234.1.2 SYDNEY RISK ASSESSMENT
Table R1.1 lists the estimated health outcomes attributable to PM2.5
concentrations above the background level in the Sydney region. The
results are presented both as absolute values (number of cases per year)
and as a proportion of the usual baseline incidence. The ranges in
brackets represent uncertainty due to the 95% confidence interval on the
dose response relationship. The results are averages over the three-year
study period.
In the first part of the table, the major bushfire impact of 25-31
December 2001 has been excluded. The last two rows show the same
results with the bushfires included.
4.1.3 SYDNEY SCENARIO ASSESSMENT
Table S1.1 lists the results of re-running the risk analysis for Sydney with
modified concentrations as described in the methodology section. Results
are presented for 7 scenarios: 4 modifications to the 24-hour PM2.5
concentrations, and 3 modifications to the annual average PM2.5
concentrations.
The results are presented as the total number of health outcomes avoided
per year, averaged over the three-year study period. Figures S1.1 and
S1.2 present the same information graphically for the 24-hour and annual
average scenario levels respectively.
Data affected by the major bushfires of 25-31 December 2001 have been
excluded from this analysis.
24Table R1.1 - PM2.5 Risk Assessment Results - Annual Health Outcomes attributable to above-background PM2.5 - SYDNEY
Short Term Health Endpoint Long Term Health Endpoint
S1 S2 S3 S4 S5 S6 L1 L2 L3
Hospital Hospital Hospital
Mortality Mortality Mortality Mortality Mortality Mortality
Admissions Admissions Admissions
Cardio-
Cardiovascular
All cause Respiratory Cardiovascular Asthma COPD All cause Lung cancer pulmonary
disease
disease
Estimated cases 274 81 55 157 246 58 699 88 527
per year
95% conf. interval ( 156 - 389 ) ( 50 - 114 ) ( 8 - 101 ) ( 61 - 251 ) ( 146 - 346 ) ( 12 - 108 ) ( 240 - 1237 ) ( 27 - 136 ) ( 183 - 893 )
Estimated cases
as % of baseline 1.1% 4.0% 0.5% 1.3% 0.8% 1.0% 2.9% 6.4% 4.3%
rate
95% conf. interval ( 0.6% - 1.6% ) ( 2.5% - 5.6% ) ( 0.1% - 1.0% ) ( 0.5% - 2.0% ) ( 0.5% - 1.2% ) ( 0.2% - 1.9% ) ( 1.0% - 5.1% ) ( 2.0% - 9.9% ) ( 1.5% - 7.2% )
With bushfires:
Cases per year 290 85 58 167 262 61 743 93 560
As % of baseline 1.2% 4.2% 0.6% 1.4% 0.9% 1.1% 3.1% 6.8% 4.5%
NB: confidence intervals shown above are based on statistical uncertainty in the dose-response relationships.Table S1.1 - PM2.5 Scenario Assessment - Health Outcomes Avoided per year - SYDNEY
Short Term Health Endpoint Long Term Health Endpoint
S1 S2 S3 S4 S5 S6 L1 L2 L3
Hospital Hospital Hospital
Mortality Mortality Mortality Mortality Mortality Mortality
Admissions Admissions Admissions
Cardio-
Cardiovascular
All cause Respiratory Cardiovascular Asthma COPD All cause Lung cancer pulmonary
disease
€ disease
Scenario
Scenario: 24h PM2.5Figure S1.1 - PM2.5 Scenario Assessment - Health Outcomes Avoided per year - SYDNEY
200
180 Scenario: 24h PM2.5Figure S1.2 - PM2.5 Scenario Assessment - Health Outcomes Avoided per year -SYDNEY
800
700 Scenario: Annual PM2.54.2 Melbourne
4.2.1 MELBOURNE EXPOSURE ASSESSMENT
A map displaying the physical boundaries of the Melbourne Statistical
Division as defined by the Australian Bureau of Statistics is shown in
Figure E2a. The location of each relevant monitoring site as listed in
Table 3.1 is also indicated. Population data for the Melbourne Statistical
Division are given in Table E2a.
Table E2a. Population of the Melbourne Statistical Division, 2001.
Age Group Population
0-14 660,378
65+ 406,797
All ages 3,366,542
Frequency graphs of daily 24-hour PM2.5 data are presented in Figure E2b
for 1998, 1999 and 2000. As for Sydney, the graphs display the
composite PM2.5 concentrations, obtained by averaging the data obtained
at Footscray, Alphington and Brighton monitoring stations. The inverse
cumulative frequency distributions are displayed in Figure E2c.
The 24-hour average PM2.5 results for 1998, 1999, 2000 and the three
years combined are shown in Tables E2b-e respectively. The annual
average PM2.5 concentrations derived from hourly data at each monitoring
site and the composite annual average concentrations are shown in Table
E2f.
Table E2b. 24-Hour PM2.5 results for Melbourne, 1998.
Alphington Brighton Footscray Composite
Maximum 24-hour 34.0 31.0 35.7 33.2
PM2.5 (µg/m )
3
# Days > 20 µg/m
3
18 17 8 15
# Days > 25 µg/m
3
5 4 2 4
# Days > 30 µg/m
3
1 2 1 1
# Days > 35 µg/m
3
0 0 1 0
Table E2c. 24-Hour PM2.5 results for Melbourne, 1999.
Alphington Brighton Footscray Composite
Maximum 24-hour
24.5 30.5 22.5 24.9
PM2.5 (µg/m )
3
# Days > 20 µg/m
3
9 6 2 4
# Days > 25 µg/m
3
0 1 0 0
# Days > 30 µg/m
3
0 1 0 0
# Days > 35 µg/m
3
0 0 0 0Table E2d. 24-Hour PM2.5 results for Melbourne, 2000
Alphington Brighton Footscray Composite
Maximum 24-hour
43.9 29.9 * 30.8
PM2.5 (µg/m )
3
# Days > 20 µg/m
3
7 4 * 5
# Days > 25 µg/m
3
5 2 * 4
# Days > 30 µg/m
3
2 0 * 2
# Days > 35 µg/m
3
1 0 * 0
(*) insufficient data (< 75% of the year) available
Table E2e. 24-Hour PM2.5 results for Melbourne, 1998-2000
Alphington Brighton Footscray Composite
Maximum 24-hour
43.9 31.0 35.7 33.2
PM2.5 (µg/m )
3
# Days > 20 µg/m
3
34 27 10 24
# Days > 25 µg/m
3
10 7 2 8
# Days > 30 µg/m
3
3 3 1 3
# Days > 35 µg/m
3
1 0 1 0
Table E2f. Annual average PM2.5 results for Melbourne (µg/m )
3
Year Alphington Brighton Footscray Composite
1998 9.8 9.2 9.1 9.4
1999 9.5 8.9 8.6 9.0
2000 9.2 6.9 * 8.0
(*) insufficient data (< 75% of the year) available
30Alphington
Footscray
Brighton
Figure E2a. Map of the Melbourne Statistical Division. The locations of the PM2.5
monitoring stations are indicated with blue stars.
31MELBOURNE
24-hour PM2.5 Frequency Distribution
35%
1998
30%
1999
2000
25%
%Frequency
20%
15%
10%
5%
0%
2 4 6 8 10 12 14 16 18 20 22 24 26 28 30 32 34 36 >36
µg/m3)
PM2.5 concentration (µ
Figure E2b. Frequency distribution of composite daily 24-hour PM2.5 concentrations in
Melbourne for 1998, 1999 and 2000. The concentrations for the frequency distribution on
the X-axis denote concentration bins of X-2 to X µg/m3.
MELBOURNE
%Days where 24-hour PM2.5 > x
100%
1998
1999
2000
80%
60%
%Days
40%
20%
0%
0 2 4 6 8 10 12 14 16 18 20 22 24 26 28 30 32 34 36
µg/m )
3
x (µ
Figure E2c. Inverse cumulative frequency distribution (percentage of days above each
concentration level) of composite daily 24-hour PM2.5 concentrations in Melbourne for
1998, 1999 and 2000.
324.2.2 Melbourne Risk Assessment
Table R2.1 lists the estimated health outcomes attributable to above-
background PM2.5 in the Melbourne region, both as absolute values
(number of cases per year) and as a proportion of the usual baseline
incidence. The results are averages over the three-year study period.
4.2.3 Melbourne Scenario Assessment
Table S2.1 lists the results of re-running the risk analysis for Melbourne
with modified concentrations as described in the methodology section.
The results are presented as the total number of health outcomes avoided
per year, averaged over the three-year study period. Figures S2.1 and
S2.2 present the same information graphically for the 24-hour and annual
average scenario levels respectively.
33Table R2.1 - PM2.5 Risk Assessment Results -Annual Health Outcomes attributable to above-background PM2.5 - MELBOURNE
Short Term Health Endpoint Long Term Health Endpoint
S1 S2 S3 S4 S5 S6 L1 L2 L3
Hospital Hospital Hospital
Mortality Mortality Mortality Mortality Mortality Mortality
Admissions Admissions Admissions
Cardio-
Cardiovascular
All cause Respiratory Cardiovascular Asthma COPD All cause Lung cancer pulmonary
disease
disease
Estimated cases 207 60 41 78 157 15 524 58 316
per year
95% conf. interval ( 118 - 294 ) ( 37 - 83 ) ( 6 - 77 ) ( 30 - 124 ) ( 93 - 220 ) ( 3 - 28 ) ( 179 - 929 ) ( 18 - 91 ) ( 110 - 538 )
Estimate cases as 0.9% 3.2% 0.4% 1.0% 0.7% 0.8% 2.3% 5.1% 3.4%
% of baseline rate
95% conf. interval ( 0.5% - 1.3% ) ( 2.0% - 4.5% ) ( 0.1% - 0.8% ) ( 0.4% - 1.6% ) ( 0.4% - 0.9% ) ( 0.2% - 1.5% ) ( 0.8% - 4.1% ) ( 1.6% - 8.0% ) ( 1.2% - 5.8% )
NB: confidence intervals shown above are based on statistical uncertainty in the dose-response relationships.Table S2.1 - PM2.5 Scenario Assessment - Health Outcomes Avoided per year - MELBOURNE
Short Term Health Endpoint Long Term Health Endpoint
S1 S2 S3 S4 S5 S6 L1 L2 L3
Hospital Hospital Hospital
Mortality Mortality Mortality Mortality Mortality Mortality
Admissions Admissions Admissions
Cardio-
Cardiovascular
All cause Respiratory Cardiovascular Asthma COPD All cause Lung cancer pulmonary
disease
€ disease
Scenario
Scenario: 24h PM2.5Figure S2.1 - PM2.5 Scenario Assessment - Health Outcomes Avoided per year - MELBOURNE
140
Scenario: 24h PM2.5Figure S2.2 - PM2.5 Scenario Assessment - Health Outcomes Avoided per year - MELBOURNE
600
Scenario: Annual PM2.54.3 Brisbane
4.3.1 BRISBANE EXPOSURE ASSESSMENT
A map displaying the physical boundaries of the Brisbane Statistical
Division as defined by the Australian Bureau of Statistics is shown in
Figure E3a. The location of each relevant monitoring site as listed in
Table 3.1 is also indicated. Population data for the Brisbane Statistical
Division are given in Table E3a.
Table E3a. Population of the Brisbane Statistical Division, 2001.
Age Group Population
0-14 337,963
65+ 178,349
All ages 1,627,535
Frequency graphs of daily 24-hour PM2.5 data are presented in Figures
E3b(1) and E3b(2) for 1999, 2000 and 2001. As for the other cities, the
graphs display the composite PM2.5 concentrations, obtained by averaging
the TEOM data obtained at Rocklea and Springwood monitoring stations.
Note that the Brisbane TEOM data as originally provided was inconsistent
with all other Australian TEOM data, in that the standard USEPA correction
function (y=1.03x+3.0) had been removed from the TEOM instruments.
To make the data comparable with all other Australian data, the USEPA
function was applied. NB: The USEPA correction function was derived for
PM10, and there is no evidence that it applies to PM2.5; however most
TEOM users do not modify the function when setting up instruments to
measure PM2.5, and so until a more detailed study can be done, it is best
to retain the use of this function.
Bushfires (7-13 October 2001) gave rise to an extremely high 24-hour
PM2.5 concentration at Rocklea on 9 October 2001.
The inverse cumulative distributions for 1999, 2000 and 2001 are
displayed in Figures E3c(1) and E3c(2).
The 24-hour average PM2.5 results for 1999, 2000, 2001 and the three
years combined are shown in Tables E3b-e respectively. Results with and
without the bushfire data (7-13 October 2001) are provided.
Table E3b. 24-Hour PM2.5 results for Brisbane, 1999.
Rocklea Springwood Composite
Maximum 24-hour 17.9 26.0 22.0
PM2.5 (µg/m )
3
# Days > 20 µg/m
3
0 1 1
# Days > 25 µg/m
3
0 1 0
# Days > 30 µg/m
3
0 0 0
# Days > 35 µg/m
3
0 0 0Table E3c. 24-Hour PM2.5 results for Brisbane, 2000.
Rocklea Springwood Composite
Maximum 24-hour
41.5 37.5 37.6
PM2.5 (µg/m )
3
# Days > 20 µg/m
3
8 19 14
# Days > 25 µg/m
3
3 10 6
# Days > 30 µg/m
3
3 6 1
# Days > 35 µg/m
3
2 2 1
Table E3d(1). 24-Hour PM2.5 results for Brisbane, 2001 (October
2001 bushfires excluded)
Rocklea Springwood Composite
Maximum 24-hour
23.9 23.0 22.5
PM2.5 (µg/m )
3
# Days > 20 µg/m
3
4 6 3
# Days > 25 µg/m
3
0 0 0
# Days > 30 µg/m
3
0 0 0
# Days > 35 µg/m
3
0 0 0
Table E3d(2). 24-Hour PM2.5 results for Brisbane, 2001 (October
2001 bushfires included)
Rocklea Springwood Composite
Maximum 24-hour
97.8 23.0 58.7
PM2.5 (µg/m )
3
# Days > 20 µg/m
3
7 6 6
# Days > 25 µg/m
3
3 0 3
# Days > 30 µg/m
3
3 0 2
# Days > 35 µg/m
3
3 0 1
Table E3e(1). 24-Hour PM2.5 results for Brisbane, 1999-2001
(October 2001 bushfires excluded)
Rocklea Springwood Composite
Maximum 24-hour
41.5 37.5 37.6
PM2.5 (µg/m )
3
# Days > 20 µg/m
3
12 26 18
# Days > 25 µg/m
3
3 11 6
# Days > 30 µg/m
3
3 6 1
# Days > 35 µg/m
3
2 2 1
Table E3e(2). 24-Hour PM2.5 results for Brisbane, 1999-2001
(October 2001 bushfire included)
Rocklea Springwood Composite
Maximum 24-hour
97.8 37.5 58.7
PM2.5 (µg/m )
3
# Days > 20 µg/m
3
15 26 21
# Days > 25 µg/m
3
6 11 9
# Days > 30 µg/m
3
6 6 3
# Days > 35 µg/m
3
5 2 2
39The annual average PM2.5 concentrations derived from hourly data at each
monitoring site and the composite annual average concentrations are
shown in the following tables.
The supplied annual averages included all data (including the bushfire),
this information (corrected for the USEPA function, see Section 3.1) is
shown in Table E3f(2).
To estimate the annual averages excluding the bushfire, daily averages
without the 7-13 October 2001 data were averaged. Then a correction
factor was applied to account for the difference between 1-hour derived
annual averages and 24-hour derived annual averages. The results are
shown in Table E3f(1).
Table E3f(1). Estimated annual average PM2.5 results for Brisbane
(October 2001 bushfires excluded) (µg/m )
3
Year Rocklea Springwood Composite
1999 8.2 7.4 7.8
2000 8.9 9.6 9.2
2001 8.2 8.4 8.3
Table E3f(2). Annual average PM2.5 results for Brisbane
(October 2001 bushfires included) (µg/m )
3
Year Rocklea Springwood Composite
1999 8.2 7.4 7.8
2000 8.9 9.6 9.2
2001 8.7 8.5 8.6
40Rocklea
Springwood
Figure E3a. Map of the Brisbane Statistical Division. The locations of the PM2.5 monitoring
stations are indicated with blue stars.
41BRISBANE
24-hour PM2.5 Frequency Distribution
45%
1999
40% 2000
2001
35%
30%
%Frequency
25%
20%
15%
10%
5%
0%
2 4 6 8 10 12 14 16 18 20 22 24 26 28 30 32 34 36 >36
µg/m3)
PM2.5 concentration (µ
Figure E3b(1). Frequency distribution of composite daily 24-hour PM2.5 concentrations in
Brisbane for 1999, 2000 and 2001. The concentrations for the frequency distribution on
the X-axis denote concentration bins of X-2 to X µg/m3. Bushfire-affected data (7-13
October 2001) have been excluded.
BRISBANE
24-hour PM2.5 Frequency Distribution
45%
1999
40%
2000
2001
35%
30%
%Frequency
25%
20%
15%
10%
5%
0%
2 4 6 8 10 12 14 16 18 20 22 24 26 28 30 32 34 36 >36
µg/m )
3
PM2.5 concentration (µ
Figure E3b(2). Frequency distribution of composite daily 24-hour PM2.5 concentrations in
Brisbane for 1999, 2000 and 2001. The concentrations for the frequency distribution on
the X-axis denote concentration bins of X-2 to X µg/m3. Bushfire-affected data (7-13
October 2001) are included on this plot.
42BRISBANE
%Days where 24-hour PM2.5 > x
100%
1999
2000
2001
80%
60%
%Days
40%
20%
0%
0 2 4 6 8 10 12 14 16 18 20 22 24 26 28 30 32 34 36
µg/m )
3
x (µ
Figure E3c(1). Inverse cumulative frequency distribution (percentage of days above each
concentration level) of composite daily 24-hour PM2.5 concentrations in Brisbane for 1999,
2000 and 2001. Bushfire-affected data (7-13 October 2001) have been excluded.
BRISBANE
%Days where 24-hour PM2.5 > x
100%
1999
2000
2001
80%
60%
%Days
40%
20%
0%
0 2 4 6 8 10 12 14 16 18 20 22 24 26 28 30 32 34 36
µg/m3)
x (µ
Figure E3c(2). Inverse cumulative frequency distribution (percentage of days above each
concentration level) of composite daily 24-hour PM2.5 concentrations in Brisbane for 1999,
2000 and 2001. Bushfire-affected data (7-13 October 2001) are included.
434.3.2 Brisbane Risk Assessment
Table R3.1 lists the estimated health outcomes attributable to above-
background PM2.5 in the Brisbane region, both as absolute values (number
of cases per year) and as a proportion of the usual baseline incidence.
The results are averages over the three-year study period.
The results in the first part of the table show the health outcomes with the
effects of the 7-13 October 2001 bushfires excluded. The last two rows
show the same results with the bushfires included.
4.3.3 Brisbane Scenario Assessment
Table S3.1 lists the results of re-running the risk analysis for Brisbane
with modified concentrations as described in the methodology section.
Results are presented as the total number of health outcomes avoided per
year, averaged over the three-year study period. Figures S3.1 and S3.2
present the same information graphically for the 24-hour and annual
average scenario levels respectively.
Data affected by the major bushfires of 7-13 Oct 2001 have been
excluded from this analysis.
44Table R3.1 - PM2.5 Risk Assessment Results - Annual Health Outcomes attributable to above-background PM2.5 - BRISBANE
Short Term Health Endpoint Long Term Health Endpoint
S1 S2 S3 S4 S5 S6 L1 L2 L3
Hospital Hospital Hospital
Mortality Mortality Mortality Mortality Mortality Mortality
Admissions Admissions Admissions
Cardio-
Cardiovascular
All cause Respiratory Cardiovascular Asthma COPD All cause Lung cancer pulmonary
disease
disease
Estimated cases 97 32 20 40 69 11 247 28 156
per year
95% conf. interval ( 55 - 138 ) ( 20 - 45 ) ( 3 - 38 ) ( 16 - 64 ) ( 41 - 97 ) ( 2 - 21 ) ( 85 - 439 ) ( 9 - 44 ) ( 54 - 266 )
Estimated cases
as % of baseline 0.8% 2.9% 0.4% 0.9% 0.6% 0.7% 2.1% 4.7% 3.1%
rate
95% conf. interval ( 0.5% - 1.2% ) ( 1.8% - 4.1% ) ( 0.1% - 0.7% ) ( 0.4% - 1.5% ) ( 0.4% - 0.9% ) ( 0.1% - 1.3% ) ( 0.7% - 3.7% ) ( 1.4% - 7.2% ) ( 1.1% - 5.3% )
With Bushfires:
Cases per year 99 33 21 41 71 11 252 29 160
As % of baseline 0.8% 3.0% 0.4% 1.0% 0.6% 0.7% 2.1% 4.8% 3.2%
NB: confidence intervals shown above are based on statistical uncertainty in the dose-response relationships.You can also read