Evaluation of the Foot Center of Pressure Estimation from Pressure Insoles during Sidestep Cuts, Runs and Walks - MDPI
←
→
Page content transcription
If your browser does not render page correctly, please read the page content below
sensors
Communication
Evaluation of the Foot Center of Pressure Estimation from
Pressure Insoles during Sidestep Cuts, Runs and Walks
Pauline Morin 1, *, Antoine Muller 2 , Charles Pontonnier 1                           and Georges Dumont 1

                                          1   University Rennes, CNRS, Inria, IRISA-UMR 6074, 35000 Rennes, France; charles.pontonnier@ens-rennes.fr (C.P.);
                                              georges.dumont@ens-rennes.fr (G.D.)
                                          2   University Lyon, University Gustave Eiffel, University Claude Bernard Lyon 1, LBMC UMR_T 9406,
                                              69622 Lyon, France; antoine.muller@univ-lyon1.fr
                                          *   Correspondence: pauline.morin@ens-rennes.fr

                                          Abstract: Estimating the foot center of pressure (CoP) position by pressure insoles appears to be an
                                          interesting technical solution to perform motion analysis beyond the force platforms surface area. The
                                          aim of this study was to estimate the CoP position from Moticon® pressure insoles during sidestep
                                          cuts, runs and walks. The CoP positions assessed from force platform data and from pressure insole
                                          data were compared. One calibration trial performed on the force platforms was used to localize
                                          the insoles in the reference coordinate system. The most accurate results were obtained when the
                                          motion performed during the calibration trial was similar to the motion under study. In such a case,
                                          mean accuracy of CoP position have been evaluated to 15 ± 4 mm along anteroposterior (AP) axis
                                          and 8.5 ± 3 mm along mediolateral (ML) axis for sidestep cuts, 18 ± 5 mm along AP axis and
                                          7.3 ± 4 mm along ML axis for runs, 15 ± 6 mm along AP axis and 6.6 ± 3 mm along ML axis
                                          for walks. The accuracy of the CoP position assesment from pressure insole data increased with the
                                          vertical force applied to the pressure insole and with the number of pressure cells involved.
Citation: Morin, P.; Muller, A.;
Pontonnier, C.; Dumont, G.                Keywords: biomechanics; motion analysis; ground reaction forces; outside laboratory experiments;
Evaluation of the Foot Center of
                                          moticon
Pressure Estimation from Pressure
Insoles during Sidestep Cuts, Runs
and Walks. Sensors 2022, 22, 5628.
https://doi.org/10.3390/s22155628
                                          1. Introduction
Academic Editors: Yih-Kuen Jan,                 The study of human movement outside the laboratory is a major application issue
Chi-Wen Lung, Ben-Yi Liau and             for many sectors (sports, ergonomics, monitoring of physical activity, etc.). The center of
Manuel E. Hernandez                       pressure (CoP) position appears to be an interesting biomechanical quantity in the analysis
Received: 8 July 2022
                                          of movement. This quantity can be directly used to evaluate balance or reactivity in sports
Accepted: 24 July 2022                    performance [1–4]. It can also be used as an intermediate quantity to describe the foot–
Published: 27 July 2022                   ground contact [5]. It can be used as a driving quantity to estimate the reaction forces
                                          between the subject and the ground using inverse dynamics methods [6].
Publisher’s Note: MDPI stays neutral
                                                Force platforms are considered the gold standard for CoP position assessment [7–10].
with regard to jurisdictional claims in
                                          These devices reduce the ecological validity of the experiments while limiting the area of
published maps and institutional affil-
                                          motion to the dimensions of the force platform [11]. Estimating the CoP position using
iations.
                                          pressure insoles removes this limitation by providing more ecological experimental conditions
                                          at the cost of a limited impact on subject motion [12]. The evaluation of CoP position assesment
                                          from pressure insole data (piCoP) opens the door to applications where the magnitude of the
Copyright: © 2022 by the authors.         studied phenomenon is greater than the accuracy determined [13].
Licensee MDPI, Basel, Switzerland.              Several studies have evaluated the reliability and repetability of the piCoP position for
This article is an open access article    different pressure insole models. Moticon® insoles had strong reliability and demonstrated
distributed under the terms and           lower validity compared to Pedar-X® insoles [14]. A dependence of the piCoP position
conditions of the Creative Commons        accuracy to the vertical force applied to the insole has been demonstrated [15] by compar-
Attribution (CC BY) license (https://     ing piCoP to CoP position measured with the force platforms (fpCoP) for leg press and
creativecommons.org/licenses/by/          squat exercises.
4.0/).

Sensors 2022, 22, 5628. https://doi.org/10.3390/s22155628                                                        https://www.mdpi.com/journal/sensors
Sensors 2022, 22, 5628                                                                                            2 of 11

                              The accuracy of the CoP position evolution estimated by means of pressure insoles
                         was evaluated on gait [7–9]. Results on gait cannot be extended as results valid in a sport
                         environment, which is characterized by the variety and the dynamics of sport movements.
                         During sidestep cuts, acceleration along mediolateral axis causes the trajectory to change.
                         In contrast to straight-line movements, sidestep cuts are characterized by a significant shift
                         of the CoP along mediolateral axis [16].
                              In view of the use of pressure insoles in the inverse dynamics process, an evaluation
                         of the estimation of the ground reaction force and the estimation of the CoP position is
                         necessary. Recent studies presented methods to estimate ground reaction force from plantar
                         pressure, considering CoP as the force application point [17]. The artificial neural network
                         use involves a large amount of data [18].
                              The purpose of this study was to evaluate the accuracy of the CoP position evolution
                         estimated by means of Moticon® pressure insoles during sidestep cuts, runs and walks.
                         The piCoP and fpCoP were compared after synchronization and insole localization in
                         the reference coordinate system. The accuracy of the piCoP was studied as a dependent
                         variable of the kind of the motion performed during the calibration trial, the vertical
                         external forces estimated by pressure insoles and the number of pressure cells involved in
                         the piCoP computation considered as independent variables.

                         2. Materials and Methods
                         2.1. Experimental Procedure
                               The cohort was composed of 4 female and 10 male subjects (age: 29 ± 2 years old,
                         height: 1.8 ± 0.1 m, mass: 70 ± 10 kg). The inclusion criterion was to wear EU size 38, 39,
                         42 or 43 shoes, since two insole sizes were available (38–39 and 42–43 EU). Each subject
                         signed an informed consent form and a pseudonimization protocol was followed for data
                         storage. The experimental protocol was approved by the INRIA National Ethics Committee
                         (Comité Opérationnel d’Evaluation des Risques Légaux et Ethiques, 2021-06, 02/22/2021).
                               Whole body motion capture was performed by placing 46 reflective markers on
                         standardized anatomical landmarks according to the recommendations of the International
                         Society of Biomechanics [19,20]. Only markers placed on the feet were used for this study;
                         the full body kinematics were measured for further studies. Motion capture data were
                         recorded with a Qualisys optoelectronic motion capture system (200 Hz, 22 “12 Mpixels
                         OQUS 7+” cameras). Ground reaction forces and moments (GRF&M) were recorded with
                         two AMTI force platforms (2000 Hz). Underfoot pressure, CoP position, vertical force and
                         feet acceleration were recorded by Moticon® pressure insoles (OpenGo, 100 Hz, 16 pressure
                         cells covering 65% of the insole area with a 0.25 N · cm−2 resolution and a hysteresis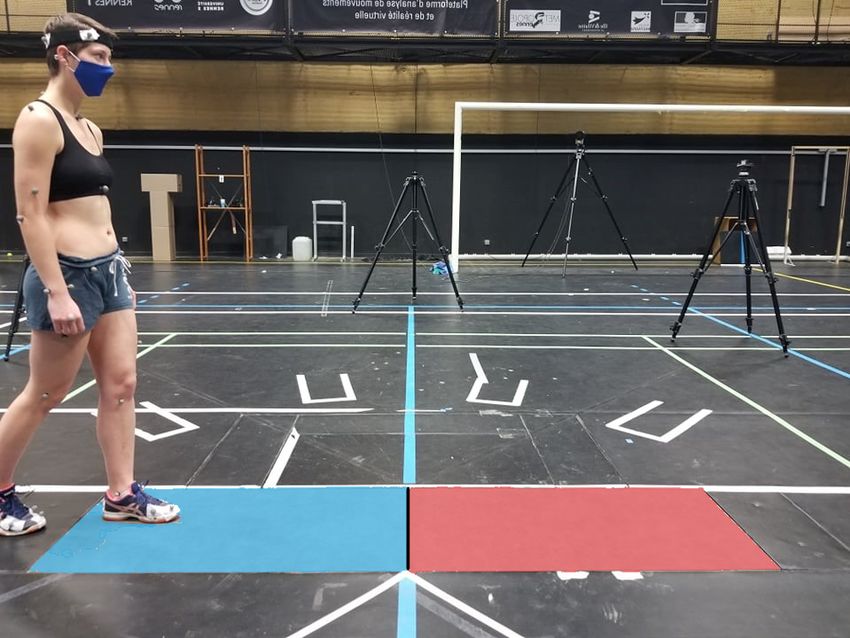
Sensors 2022, 22, 5628                                                                                                     3 of 11

                         Figure 1. Method overview to evaluate the piCoP accuracy. This process used motion capture data
                         (blue), pressure insole data (green) and force platform data (red). The localization used the processing
                         of one calibration trial. Evaluation was based on the comparison between the fpCoP and the piCoP
                         expressed in the reference coordinate system.

                         2.3. Synchronisation and Frame Selection
                              For the motion capture data, for each trial, an operator manually, and by visual control,
                         selected frames where both data were available for comparison, as shown in Figure 2c (feet
                         not outside the force platforms, as shown in Figure 2a, and not on the same platform, as
                         shown in Figure 2b).

                                      (a)                            (b)                             (c)
                         Figure 2. Photos of a walk trial: phase when the subject was out of the force platforms (a), when the
                         subject was in the double support phase on the same platform (b) and when the subject had each
                         foot on a separate platform (c). Phase (a,b) were rejected for the study. Phase (c) was selected for
                         the study.

                              To select the corresponding frames in the insole data, the foot acceleration computed from
                         the motion capture data (barycenter of the markers placed on the shoe shown in Figure 3) and
                         the acceleration provided by the IMU insole data were cross-correlated. The cross-correlation
                         between the two accelerations enabled to detect the motion cycle executed on the force
                         platforms in the insole data. To synchronize the selected motion cycle in the motion capture
                         data and the selected motion cycle in the insole data, the vertical ground reaction forces
                         measured from the force platforms and pressure insoles were cross-correlated.
Sensors 2022, 22, 5628                                                                                                  4 of 11

                         Figure 3. Shoe equipped with instrumented insoles and markers enabling the construction of the
                         foot reference frame.

                              Frames with foot–ground contact were selected from the synchronized data. Foot–
                         ground contact was considered when contact was simultaneously detected by the pressure
                         insole and by the force platform. Contact on the pressure insole was considered as ac-
                         tive when at least two pressure cells were activated. A pressure cell was considered as
                         active when the measured pressure was greater than 1.5 N · cm−2 , excluding low-intensity
                         pressure peaks (corresponding to the pressure measurement noise, defined empirically as
                         peaks of intensity less than 2 N · cm−2 and duration less than 0.03 s). Contact between the
                         foot and the force platform was considered as active when the force platform measured a
                         vertical force greater than 75 N (empirical value).

                         2.4. Localization
                                The motion capture reference frame was the optoelectronic reference coordinate system
                         (R0 ). Force platform data were expressed in R0 . The piCoP position expressed in the insole
                         coordinate sytem (pi piCoP) required localization in R0 for comparison. The transformation
                         matrix from the pressure insole reference frame to R0 , 0 Tpi was decomposed into two
                         successive transformation matrices:
                         –    Transformation matrix from the pressure insole reference frame to the foot reference
                              frame f Tpi ;
                         –    Transformation matrix from the foot reference frame to R0 : 0 Tf (t).
                               The matrix 0 Tf (t) was built from the markers position and the foot reference frame
                         shown in Figure 3.
                               The matrix f Tpi was considered as constant assuming small relative displacements be-
                         tween the insole, the foot and the markers. f Tpi was estimated by comparing the successive
                         fpCoP position expressed in R0 (0 fpCoP) and the successive piCoP position expressed in R0
                         (0 piCoP) during a valid sequence of foot–ground contact frames for each foot. The contact
                         sequence was selected from one trial designed as calibration trial. f Tpi was determined to
                         minimize the root mean square error (RMSE) between 0 piCoP and 0 fpCoP (Figure 4) [8,9].
                               0 T (t) was approximated as constant during the contact. The successive positions of the
                                  f
                         CoP were contained in the successive contact areas between the foot and the platform. These
                         contact areas resulted from the deformation of the shoe on the ground (the motion was
                         assumed to be slip-free). The overview of those surfaces was similar to the contact surface
                         when the entire foot was flat on the floor at the frame designed as t = tf . The successive
                         reference frames of the contact surfaces were approximated by the reference frame when
                         the entire foot was flat on the ground, 0 Tf (tf ). For each foot, 0 Tf (tf ) was computed as 0 Tf (t)
                         when the maximum of pressure cell detect pressure at t = tf .
Sensors 2022, 22, 5628                                                                                                     5 of 11

                                         (a)                          (b)
                         Figure 4. CoP trajectory comparison f Tpi as identity matrix (a) and f Tpi once calibrated (b) for a run
                         trial (right foot).

                         2.5. Comparison
                               The accuracy of piCoP was assessed by the RMSE between 0 piCoP and 0 fpCoP along
                         the anteroposterior (AP) and mediolateral (ML) axes in R0 . For each trial, RMSEs were
                         computed successively using each trial performed by the same subject as the calibration
                         trial (15 × 15 RMSE were computed for each subject).
                               The impact of the kind of motion executed during the calibration trial on the piCoP
                         position accuracy was studied. The motion executed during the studied trial was named
                         the trial motion (TM) (sidestep cuts, run or walk) and the motion executed during the
                         calibration trial was named the calibration trial motion (CTM). Regardless of the RMSE
                         obtained by using as calibration trial the studied trial and for each TM value, CTM were
                         tested as significant variables on RMSE (AP and ML component). For each pair of values
                         (TM; CTM), the normality distribution of the RMSEs were tested with a Shapiro–Wilk test
                         (3 × 3 tests). For each pair of values (TM; CTM), the different results were considered as
                         repeated measures. For each TM, the influence of the CTM was tested with a Friedman test.
                         Pairwise comparison completed the statistic study with a Durbin–Conover test.
                               The impact of the vertical force intensity and the impact of the number of activated
                         pressure cells on the piCoP accuracy was studied. At each frame, the piCoP absolute
                         error, the intensity of the vertical force captured by the pressure insole and the number of
                         activated cells were recorded. Focusing on the results obtained using the studied trial as a
                         calibration trial, the dependence between the piCoP absolute error and the vertical force
                         applied on the insole or the number of activated cells was studied. The vertical force was
                         grouped to fit 100 N force intervals. The piCoP absolute errors were plotted as a function
                         of the 100 N vertical force intervals. The dependence between the piCoP absolute error and
                         the number of activated cells was tested with a Friedman test.

                         3. Results
                               The average movement speed was 3.3 ± 0.4 m · s−1 for sidestep cuts, 3.9 ± 0.4 m · s−1
                         for runs and 1.6 ± 0.2 m · s−1 for walks. The range of the piCoP shift was evaluated on
                         average to be 137 mm along the AP axis and 50.7 mm along the ML axis for sidestep cuts,
                         150 mm along the AP axis and 24.4 mm along the ML axis for runs and 176 mm along the
                         AP axis and 39.5 mm along the ML axis for walks.
                               Regardless of the RMSE obtained by using the studied trial as the calibration trial,
                         the RMSE distribution is shown in Figure 5 for each (TM; CTM) value. For sidestep cuts
                         trials, the RMSE distribution is represented on the left part in Figure 5a (RMSE along AP
                         axis) and in Figure 5a (RMSE along ML axis). The boxplot color correspond to the CTM.
Sensors 2022, 22, 5628                                                                                            6 of 11

                         Regardless of the CTM, the RMSE was 15 ± 4 mm along the AP axis and 8.5 ± 3 mm
                         along the ML axis for sidestep cuts, 18 ± 5 mm along the AP axis and 7.3 ± 4 mm along
                         the ML axis for runs and 15 ± 6 mm along the AP axis and 6.6 ± 3 mm along the ML axis
                         for walks.
                              According to a Friedman test, the difference between the RMSE distribution according
                         to the CTM was statistically significant (p < 0.001) for each TM value, except along the
                         AP axis for walk trials (on the right part in Figure 5a). Along the ML axis, mean RMSEs
                         were consistently lower when CTM and TM were the same. Those pairwise comparison
                         are statistically signifiant according to the Durbin–Conover test.

                                               (a)                                             (b)
                         Figure 5. CoP position estimation RMSE between pressure insole and force platform: AP component
                         (a) and ML component (b). Pairwise comparison (Durbin-Conover) is indicated with “***” for
                         p < 0.001, “**” for p < 0.01, “*” for p < 0.05.

                              Focusing on the results obtained by using the studied trial as the calibration trial,
                         the mean RMSE was 13 ± 4 mm (9.5% of the mean piCoP shift along AP axis) along the AP
                         axis and 7.4 ± 3 mm (14% of the mean piCoP shift along ML axis) along the ML axis for
                         sidestep cuts, 16 ± 5 mm (11%) along the AP axis and 5.3 ± 2 mm (21%) along the ML axis
                         for runs and 12 ± 3 mm (6.8%) along the AP axis and 4.2 ± 1 mm (13%) along the ML axis
                         for walks.
                              For each frame, the piCoP absolute error is plotted in Figure 6 as a function of the
                         vertical force (grouped in 100 N intervals) captured by the pressure insole. For each force
                         interval, the mean number of activated pressure cells is plotted. The mean number of
                         activated cells was between 2 (the criterion for contact detection was to detect at least
                         2 activated cells) and 16 (number of cells on each insole). There were frames where all
                         pressure cells are activated. According to a Friedman test, the dependence of the piCoP
                         absolute error distribution to the number of activated cells was statistically significant
                         (p < 0.001) for the AP axis and for the ML axis. The accuracy of the piCoP increased with
                         the number of activated cells and with the vertical force captured by the pressure insole.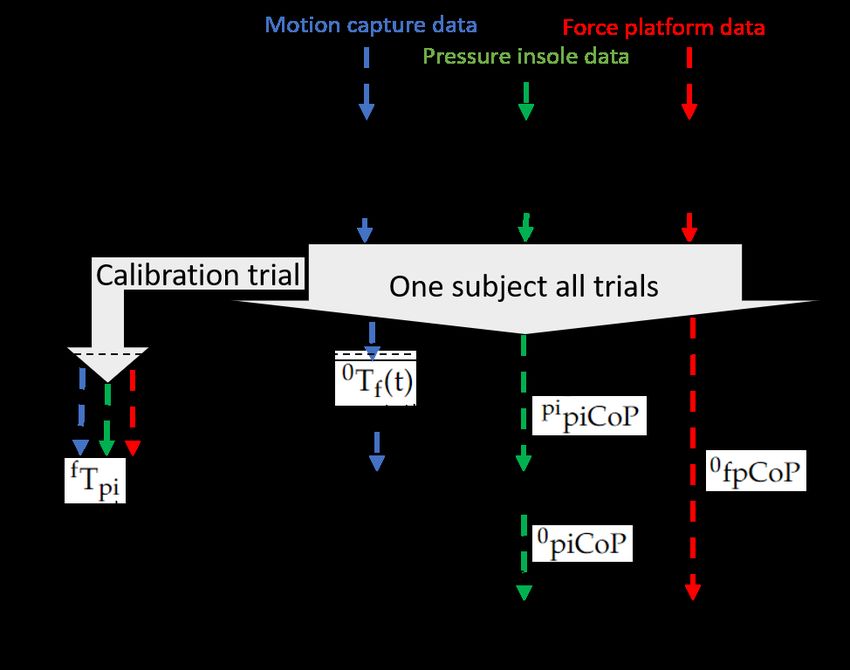
Sensors 2022, 22, 5628                                                                                              7 of 11

                         Figure 6. AP and ML component of the absolute error of piCoP as a function of the vertical force
                         measured by the pressure insoles. The vertical force were grouped to fit 100 N force intervals.
                         The mean absolute error piCoP is represented for each vertical force interval (yellow). The mean
                         number of activated pressure cell is represented for each force interval (red) on the right axis.
                         The number of data points (N) for each box is indicated at the top of the graph window.

                         4. Discussion
                              CoP positions estimated by the Moticon® pressure insoles were evaluated for sidestep
                         cuts, runs and walks. Accuracy depended on the vertical force applied to the insole and
                         the number of activated pressure cells.

                         4.1. Pressure Insole Accuracy
                               The piCoP assessment RMSE were consistent with the literature. Focusing on the walk
                         trials results obtained using the studied trial as the calibration trial, the method accuracy
                         was similar to other studies [9,23]. A similar study evaluated RMSE on gait to 43 ± 13 mm
                         for the AP component and 6.3 ± 3 mm for the ML component [9]. One study [15] evaluated
                         the RMSE to be 12 mm along the AP axis and 3.9 mm along the ML axis for the squat
                         and 12 mm along the AP axis and 4.5 mm along the ML axis for the leg press exercise.
                         The differences in motions and insole models (Pedar-X® in [15]) may explain these more
                         accurate results than in the present study. The Moticon® insoles showed lower validity
                         compared to Pedar-X® insoles [14].
                               The CTM had an impact on the accuracy of the piCoP estimated (Figure 5). The studied
                         motions had different GRF&M characteristics in term of range, frequency and component
                         preponderance. The study confirms that sidestep cuts admit a larger range of CoP shift
                         along ML axis than runs and walks [16]. Runs and sidestep cuts were more dynamic
                         and admitted larger range of vertical forces than walks. Therefore, it is recommended
                         that the CTM and TM are similar to maximize the accuracy of CoP estimation in the
                         experimental protocols.
                               The accuracy of the piCoP estimation increased with the number of activated cells
                         and with the vertical force applied on the insole (Figure 6). The greater the number of
                         activated cells involved in the CoP estimation, the less impact a pressure cell error had
                         on the estimation. The greater the vertical force applied to the insole, the less impact the
Sensors 2022, 22, 5628 8 of 11
noise from the pressure measurement had on the estimation. For high values of vertical
force applied on the insole, the mean accuracy of the piCoP estimation along the ML
axis, increased and the maximum error increased. These high values of vertical force
appeared during impact phases of dynamic movements (when the foot hits the ground
during sidestep cuts and runs). Those errors may be explained by a significant deformation
of the shoe and the insole or by the fact that the foot slips inside the shoe along the ML axis,
especially during sidestep cuts.
The studied motions (sidestep cut, run and walk) and the diversity of subjects mass
resulted in a larger range of vertical force values compared to a previous study [15].
The highest values in the present study were achieved during dynamic motions (sidestep
cut and run) by the heaviest subjects. This previous study demonstrated the dependence
of the accuracy of piCoP on the vertical force applied to the insoles. The present study
extends this result to a larger range of vertical force (0 N to 2500 N).
4.2. Perspectives of Use
The study evaluated the CoP position assessed from the Moticon® insoles. The RMSE
values obtained using the studied trial as the calibration trial can be considered as the
accuracy of the pressure insoles to estimate the CoP position in the pressure insole reference
frame. The Moticon® pressure insoles can be used to study any ativity involving a range of
CoP displacements larger than two centimeters. The confidence in the piCoP assesment
depends on the number of active pressure cells and the vertical force applied to the insole.
Depending on the application of piCoP assessment, a number of active pressure cells or a
vertical force threshold can be used to enhance the reliability of the piCoP estimation. In the
study, frames with low values of active pressure cells (and vertical force) corresponded to
frames at the beginning and the end of the contact sequence (heel strike and toe-off).
Pressure insoles can be used with an optoelectronic system to locate the position of
the CoP in R0 . This localization is a critical point [7–9]. By using a calibration trial different
from the one studied, a two-phase experimental protocol could be proposed: a calibration
step performed on a force platform followed by a capture trial without limitation to the
force platform area. Previous studies have investigated the following experimental protocol:
during calibration, the pressure insole was static on the force platforms and an operator
pressed on each pressure cell with a stick [7] to locate the pressure insole in the foot (or shoe)
reference frame. This method did not take into account the possible shoe deformations
related to the presence of the foot in it. The accuracy of this method may decrease with soft
shoes. The RMSEs admitted similar values for any TM. The piCoP estimation accuracy
does not depend on the TM. The Moticon® pressure insole can be used to study sidestep
cuts, runs and walks with the same accuracy or any displacement, including some of
those motions.
RMSEs along the ML axis were lower than along the AP axis. This study confirms that
the piCoP estimation is more accurate along the AP axis [10]. The piCoP estimation normed
by the average shift along the AP axis and shift along the ML axis of the piCoP trajectory
is more accurate along the ML axis. The interpretation of the pressure insoles’ accuracy
depends on the perspective of use. From the perspective of using it for CoP visualization of
motion [24], the piCoP estimation error along the ML axis has more impact than the piCoP
estimation error along the AP axis. As a method considering the CoP position as a driving
quantity to estimate GRF&M [6], the piCoP estimation error along the ML axis has less
impact than the piCoP estimation error along the AP axis.
4.3. Limitations and Perspectives
The impact of synchronization, especially for dynamic motions such as runs and
sidestep cuts, must be taken into account. A hardware solution for synchronization between
motion data and pressure insole data should be implemented.Sensors 2022, 22, 5628 9 of 11
The use of pressure insoles should be questioned due to the limited capture frequency
(100 Hz) for studies of phenomena of less than 0.1 s, including peaks [25], such as impulses
in sprint studies [26].
The results for high vertical forces values were limited. The vertical force interval
2300–2400 N included only one value. In this case, the statistical processing cannot be
considered as representative. A larger range of vertical force value should be captured to
test the pressure insole over their full operating range. This larger range can be obtained
during more dynamic motions, such as sprints or jumps.
The studied displacements admitted the AP axis as the main displacement direction.
The range of the piCoP shift along the AP axis was larger than the range of the piCoP shift
along the ML axis for any motion. No studied displacements admitted the ML axis as the
main displacement direction.
This study showed lower accuracy when a small number of cells were activated
and when a small vertical force was applied. Frames where a small number of cells was
activated coincided with frames when the vertical force was small. Further studies should
investigate if the accuracy of the piCoP estimation is dependent on the time phases of
the selected tasks. Further experiments should include specific motions to independently
question the impact on the piCoP accuracy of the number of activated cells and the vertical
force applied to the pressure insole (e.g., with an arabesque motion on the ball of the foot to
study high values of vertical force and low numbers of activated cells effects on accuracy,
or sitting with the feet flat on the floor to study how low values of vertical force and a high
number of activated cells affect accuracy).
The accuracy of the piCoP positions depends on the accuracy of measurement of the
insoles and the accuracy of the estimation of the related reference frame. The error of
the estimation of the reference frame of the insoles is minimized by using as a calibration
trial the trial under study, but this is not totally compensated. The markers placed on the
subject measure the shoe movement rather than the foot movement. During foot rolling,
the pressure insole and the shoe were deformed. The transformation matrix between the
foot and the insole was assumed to be constant over time and did not take this source of
error into account. Another source of error came from the foot model, considered as one
rigid solid. A two-solids foot model and using two associated transformation matrices
between the foot and the global reference frame should be investigated to reduce the foot
location error [27].
5. Conclusions
This study evaluated the accuracy and relevance of the CoP position evolution es-
timated by means of Moticon® pressure insoles during sidestep cuts, runs and walks.
Pressure insoles can replace force platforms to measure CoP positions with an accuracy
about 15 mm along the AP axis and about 8 mm along the ML axis. This accuracy increases
with the vertical force applied to the pressure insole and with the number of pressure
cells involved.
This study evaluated an upper limit of the pressure insoles accuracy in the pressure
insole coordinate system. This accuracy depends on the calibration trial used for the
localization of the insoles in the reference coordinate system. The most accurate results
were obtained when the motion performed during the calibration trial was similar to the
motion under study.
Author Contributions: Conceptualization, A.M., C.P. and G.D.; methodology, P.M., A.M., C.P. and
G.D.; software, P.M.; validation, A.M., C.P. and G.D.; formal analysis, P.M.; investigation, P.M.;
resources, C.P. and G.D.; data curation, P.M.; writing—original draft preparation, P.M.; writing—
review and editing, A.M., C.P. and G.D.; visualization, P.M.; supervision, A.M., C.P. and G.D.; project
administration, C.P. and G.D.; funding acquisition, C.P. and G.D. All authors have read and agreed to
the published version of the manuscript.
Funding: This research received no external funding.Sensors 2022, 22, 5628 10 of 11
Institutional Review Board Statement: The study was conducted in accordance with the Declaration
of Helsinki, and approved by the Institutional Review Board (or Ethics Committee) of the INRIA
National Ethics Committee (Comité 59 Opérationnel d’Evaluation des Risques Légaux et Ethiques,
2021-06, 02/22/2021).
Informed Consent Statement: Informed consent was obtained from all subjects involved in the
study. Written informed consent has been obtained from the patients to publish this paper.
Data Availability Statement: Not applicable.
Acknowledgments: The authors express their thanks to Louise Demestre for her help during the
experiments. This study is partially supported by the ANR within the framework of the PIA
EUR DIGISPORT project (ANR-18-EURE-0022). This work was partially supported by the French
government funding managed by the National Research Agency under the Investments for the Future
program (PIA) with the grant ANR-21-ESRE-0030 (CONTINUUM project).
Conflicts of Interest: The authors declare no conflict of interest. The funders had no role in the design
of the study; in the collection, analyses or interpretation of data; in the writing of the manuscript,
or in the decision to publish the results.
Abbreviations
The following abbreviations are used in this manuscript:
CoP Center of pressure
piCoP CoP position estimate from pressure insole data
fpCoP CoP position measured with force platform data
GRF&M Ground reaction forces and moments
IMU Inertial measurement unit
R0 Reference coordinate system
pi piCoP piCoP expressed in the pressure insole reference frame
0 fpCoP fpCoP expressed in R0
0 piCoP piCoP expressed in R0
RMSE Root mean square error
AP Anteroposterior
ML Mediolateral
TM Motion executed during the studied trial
CTM Motion executed during the calibration trial
References
1. Fu, F.; Zhang, Y.; Shao, S.; Ren, J.; Lake, M.; Gu, Y. Comparison of center of pressure trajectory characteristics in table tennis
during topspin forehand loop between superior and intermediate players. Int. J. Sport. Sci. Coach. 2016, 11, 559–565. [CrossRef]
2. Thompson, L.A.; Badache, M.; Cale, S.; Behera, L.; Zhang, N. Balance Performance as Observed by Center-of-Pressure Parameter
Characteristics in Male Soccer Athletes and Non-Athletes. Sports 2017, 5, 86. [CrossRef]
3. Song, Z.; Ou, J.; Shu, L.; Hu, G.; Wu, S.; Xu, X.; Chen, Z. Fall Risk Assessment for the Elderly Based on Weak Foot Features of
Wearable Plantar Pressure. IEEE Trans. Neural Syst. Rehabil. Eng. 2022, 30, 1060–1070. [CrossRef]
4. Navarro, E.; Mancebo, J.M.; Farazi, S.; del Olmo, M.; Luengo, D. Foot Insole Pressure Distribution during the Golf Swing in
Professionals and Amateur Players. Appl. Sci. 2022, 12, 358. [CrossRef]
5. Van Hulle, R.; Schwartz, C.; Denoël, V.; Croisier, J.L.; Forthomme, B.; Brüls, O. A foot/ground contact model for biomechanical
inverse dynamics analysis. J. Biomech. 2020, 100, 109412. [CrossRef] [PubMed]
6. Erdemir, A.; McLean, S.; Herzog, W.; van den Bogert, A.J. Model-based estimation of muscle forces exerted during movements.
Clin. Biomech. 2007, 22, 131–154. [CrossRef]
7. Fradet, L.; Siegel, J.; Dahl, M.; Alimusaj, M.; Wolf, S.I. Spatial synchronization of an insole pressure distribution system with a 3D
motion analysis system for center of pressure measurements. Med. Biol. Eng. Comput. 2009, 47, 85–92. [CrossRef] [PubMed]
8. Chesnin, K.J.; Selby-Silverstein, L.; Besser, M.P. Comparison of an in-shoe pressure measurement device to a force plate:
Concurrent validity of center of pressure measurements. Gait Posture 2000, 12, 128–133. [CrossRef]
9. Debbi, E.M.; Wolf, A.; Goryachev, Y.; Yizhar, Z.; Luger, E.; Debi, R.; Haim, A. In-shoe center of pressure: Indirect force plate vs.
direct insole measurement. Foot 2012, 22, 269–275. [CrossRef]
10. Stöggl, T.; Martiner, A. Validation of Moticon’s OpenGo sensor insoles during gait, jumps, balance and cross-country skiing
specific imitation movements. J. Sport. Sci. 2017, 35, 196–206. [CrossRef] [PubMed]
11. Yeadon, M.R.; Challis, J.H. The future of performance-related sports biomechanics research. J. Sport. Sci. 1994, 12, 3–32. [CrossRef]Sensors 2022, 22, 5628 11 of 11
12. Hilário, B.E.B.; Oliveira, M.L.d.; Barbosa, P.M.M.; Cunha, D.M.S.; Rigobello, G.d.S.; Mendes, J.F.; Nogueira, D.A.; Iunes, D.H.;
Carvalho, L.C. Analysis of the use of insoles in the dynamic stability of the lower limbs in recreational runners: An exploratory
study. Gait Posture 2022, 92, 435–441. [CrossRef]
13. Wilczyński, J.; Bieniek, K.B.; Margiel, K.; Sobolewski, P.; Wilczyński, I.; Zieliński, R. Correlations between variables of posture
and postural stability in children. Med. Stud. Med. 2022, 38, 6–13. [CrossRef]
14. Barratt, G.K.; Bellenger, C.; Robertson, E.Y.; Lane, J.; Crowther, R.G. Validation of Plantar Pressure and Reaction Force Measured
by Moticon Pressure Sensor Insoles on a Concept2 Rowing Ergometer. Sensors 2021, 21, 2418. [CrossRef] [PubMed]
15. Jönsson, M.; Munkhammar, T.; Norrbrand, L.; Berg, H.E. Foot centre of pressure and ground reaction force during quadriceps
resistance exercises; a comparison between force plates and a pressure insole system. J. Biomech. 2019, 87, 206–210. [CrossRef]
16. Sankey, S.P.; Robinson, M.A.; Vanrenterghem, J. Whole-body dynamic stability in side cutting: Implications for markers of lower
limb injury risk and change of direction performance. J. Biomech. 2020, 104, 109711. [CrossRef]
17. Honert, E.C.; Hoitz, F.; Blades, S.; Nigg, S.R.; Nigg, B.M. Estimating Running Ground Reaction Forces from Plantar Pressure
during Graded Running. Sensors 2022, 22, 3338. [CrossRef]
18. Choi, H.S.; Lee, C.H.; Shim, M.; Han, J.I.; Baek, Y.S. Design of an Artificial Neural Network Algorithm for a Low-Cost Insole
Sensor to Estimate the Ground Reaction Force (GRF) and Calibrate the Center of Pressure (CoP). Sensors 2018, 18, 4349. [CrossRef]
19. Wu, G.; Siegler, S.; Allard, P.; Kirtley, C.; Leardini, A.; Rosenbaum, D.; Whittle, M.; D’Lima, D.D.; Cristofolini, L.; Witte, H.; et al.
ISB recommendation on definitions of joint coordinate system of various joints for the reporting of human joint motion–part I:
Ankle, hip, and spine. International Society of Biomechanics. J. Biomech. 2002, 35, 543–548. [CrossRef]
20. Wu, G.; van der Helm, F.C.T.; Veeger, H.E.J.; Makhsous, M.; Van Roy, P.; Anglin, C.; Nagels, J.; Karduna, A.R.; McQuade, K.;
Wang, X.; et al. ISB recommendation on definitions of joint coordinate systems of various joints for the reporting of human joint
motion—Part II: shoulder, elbow, wrist and hand. J. Biomech. 2005, 38, 981–992. [CrossRef]
21. MoticonREGO AG. Sensor Insole Specification. Available online: https://moticon.com/wp-content/uploads/2021/09/
{OpenGo}-{Sensor}-{Insole}-{Specification}-{A4SQ}-{RGB}-{EN}-03.02.pdf (accessed on 28 June 2022).
22. Forrester, S.E. Selecting the number of trials in experimental biomechanics studies. Int. Biomech. 2015, 2, 62–72. [CrossRef]
23. Cordero, A.F.; Koopman, H.J.F.M.; Helm, F.C.T.v.d. Use of pressure insoles to calculate the complete ground reaction forces.
J. Biomech. 2004, 37, 1427–1432. [CrossRef] [PubMed]
24. Elvitigala, D.S.; Matthies, D.J.; David, L.; Weerasinghe, C.; Nanayakkara, S. GymSoles: Improving Squats and Dead-Lifts by
Visualizing the User’s Center of Pressure. In Proceedings of the 2019 CHI Conference on Human Factors in Computing Systems,
CHI’19, Scotland, UK, 4–9 May 2019; Association for Computing Machinery: New York, NY, USA, 2019; pp. 1–12. [CrossRef]
25. Hamill, J.; Caldwell, G.E.; Derrick, T.R. Reconstructing Digital Signals Using Shannon’s Sampling Theorem. J. Appl. Biomech.
1997, 13, 226–238. [CrossRef]
26. Kawamori, N.; Nosaka, K.; Newton, R. Relationships Between Ground Reaction Impulse and SprintAcceleration Performance in
Team Sport Athletes. J. Strength Cond. Res./Natl. Strength Cond. Assoc. 2012, 27, 568–573. [CrossRef] [PubMed]
27. Bruening, D.A.; Cooney, K.M.; Buczek, F.L. Analysis of a kinetic multi-segment foot model part II: Kinetics and clinical
implications. Gait Posture 2012, 35, 535–540. [CrossRef]You can also read