Evaluating Transportation Diversity - Multimodal Planning for Efficient and Equitable Communities
←
→
Page content transcription
If your browser does not render page correctly, please read the page content below
www.vtpi.org
Info@vtpi.org
250-508-5150
Evaluating Transportation Diversity
Multimodal Planning for Efficient and Equitable Communities
1 September 2021
By
Todd Litman
Victoria Transport Policy Institute
Abstract
Transportation diversity refers to the variety of mobility and accessibility options
available in a particular situation, including various modes, services and destinations. A
transport system must be diverse in order to serve diverse demands, including the
needs of people who cannot, should not or prefer not to drive. Multimodal planning that
increases transport system diversity tends to increase efficiency, equity and resilience,
and achieve various planning goals including congestion reduction, infrastructure
savings, affordability, improved mobility for non-drivers, traffic safety, increased public
fitness and health, environmental protection and support for strategic development
objectives. Conventional planning undervalues many of these benefits, resulting in less
diverse, more automobile-dependent communities than optimal. This report examines
consumer demands for non-auto travel options, the roles that various modes play in an
efficient and equitable transport system, transport diversity benefits, and methods for
determining optimal transport system diversity.
Originally published as:
“You Can Get There From Here: Evaluating Transportation Choice,”
Transportation Research Record 1756, TRB (www.trb.org), 2001, pp. 32-41.
Todd Alexander Litman 2001-2021
You are welcome and encouraged to copy, distribute, share and excerpt this document and its ideas, provided
the author is given attribution. Please send your corrections, comments and suggestions for improvement.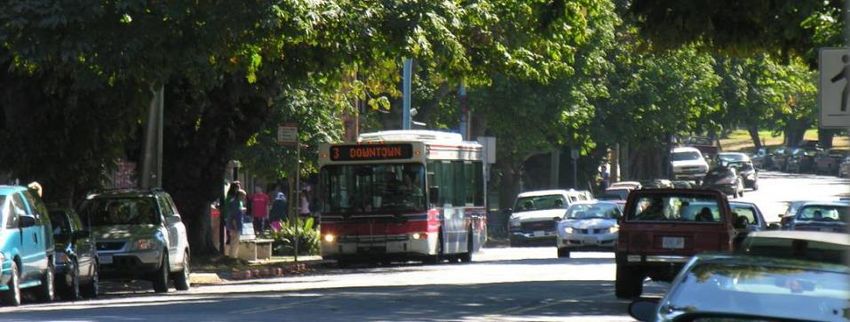
Evaluating Transportation Diversity – Multimodal Planning for Efficient and Equitable Communities
                                               Victoria Transport Policy Institute

Contents
Introduction ..................................................................................................................... 2
The Diversity of Travel Demands .................................................................................... 6
Transportation Diversity Benefits ..................................................................................... 8
   Congestion Reductions and Infrastructure Cost Savings ........................................................... 8
   Consumer Savings and Affordability ......................................................................................... 11
   Mobility for Non-Drivers ............................................................................................................. 12
   Traffic Safety ............................................................................................................................. 13
   Increased Public Fitness and Health ......................................................................................... 14
   Energy Conservation and Pollution Emission Reductions ........................................................ 15
   Strategic Development Goals ................................................................................................... 16
   Local Economic Development ................................................................................................... 17
   Summary ................................................................................................................................... 18
Multimodal Performance Indicators ............................................................................... 19
   Indicators by Mode .................................................................................................................... 19
   Aggregate Multimodal Indicators ............................................................................................... 21
   Transportation for Everyone Ratings ........................................................................................ 24
Optimal Transportation Diversity ................................................................................... 25
   Method 1: Market Principles ...................................................................................................... 25
   Method 2: Comprehensive Planning ......................................................................................... 26
   Method 3: Equity – A Fair Share for Non-drivers ...................................................................... 27
   Method 4: Equity – Optimal Urban Design ................................................................................ 30
   Method 5: Accessibility Indicators and Targets ......................................................................... 31
Reforms for More Multimodal Planning ......................................................................... 32
   Scope of Impacts....................................................................................................................... 32
   Analysis of Demand .................................................................................................................. 32
   Accessibility-Based Analysis ..................................................................................................... 32
   Transportation Performance Evaluation.................................................................................... 33
   Funding Practices ...................................................................................................................... 33
   Development Policies ................................................................................................................ 33
Conclusions .................................................................................................................. 34
References.................................................................................................................... 35

A motorist driving on a rural road stops to ask an old farmer for directions to a nearby town. The
farmer ponders the question and replies, “I’m afraid you can’t get there from here.”

This old joke is amusing because it contradicts what we know about transportation. Given
accurate directions and sufficient fuel a motorist can reach nearly any location on a public road.
But if the visitor were walking, the situation might not be so funny. Rather than suggesting that
the destination is generally inaccessible, it could mean, “You can’t get there, at least not the way
you are traveling.” It is tragic rather than comic if some groups of people have inferior
transportation options.

                                                                       1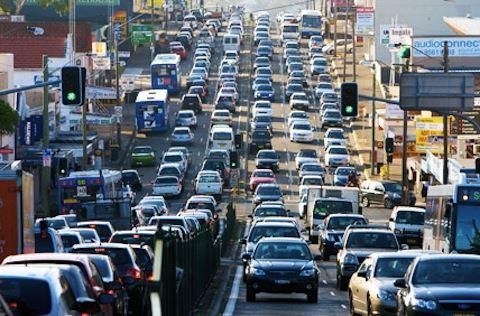
Evaluating Transportation Diversity – Multimodal Planning for Efficient and Equitable Communities
                                    Victoria Transport Policy Institute

“Variety is the Spice of Life”

Introduction
To be efficient and fair, a transportation system must be diverse or multimodal, in order to serve
diverse demands. This lets travellers choose the best option for each trip: walking and cycling for
local travel, public transit for longer urban trips, and automobiles when they are truly most
efficient overall, considering all impacts. A diverse transportation system ensures that
everybody, including non-drivers, have viable transport options and receive their fair share of
public investments in transportation facilities and services.

Transportation diversity declined during much of the last century due to automobile-oriented
planning which invested transportation resources (money and land) primarily in roads and
parking facilities, with little support for alternatives such as walking, bicycling and public transit.
This created automobile-dependent communities that favor driving over other travel modes.
This can create problems for both individuals and communities.

Many people cannot, should not or prefer not to drive. Without suitable options, non-drivers
lack independent mobility, which deprives them of economic and social opportunities, and
forces motorists to chauffeur non-driving family members and friends. Automobile dependency
forces many lower-income households to spend more than affordable on transportation, and
exacerbates traffic problems including congestion, accidents and pollution. Multimodal planning
can reduce these problems.

Of course, it is not feasible to provide every travel option everywhere, but more comprehensive
and multimodal planning can create more diverse transportation systems that respond to
currently unmet consumer demands, and the results can benefit everybody. Contrary to critic’s
claims, multimodal planning is not anti-car: a multimodal transportation system includes a
significant amount of automobile travel, as opposed to “car-free” planning which severely limits
driving. Table 1 compares approaches.

Table 1             Automobile-Dependent, Multimodal and Car-Free Compared
                         Auto-Dependent                     Multi-Modal                    Car-Free
                     Motor vehicle mobility:       Multimodal mobility and
Planning priority    speed and distance            accessibility                  Non-auto accessibility.
                     Automobile. Other modes       Walking, cycling, transit,     Walking, cycling, public
                     are considered inefficient,   ridesharing, automobile and    transit, taxi and mobility
Mobility Options     to be avoided.                mobility substitutes           substitutes.
Land use             Dispersed. Development        Most development is            All development is compact
development          along highways                compact and mixed.             and mixed around transit.
Vehicle parking      Abundant and usually free.    Moderate and often priced.     Very limited.
Vehicle              High. Over 500 vehicles       Moderate. 200-500 vehicles     Low. Less than 200 vehicles
ownership            per 1,000 residents.          per 1,000 residents.           per 1,000 residents.
Automobile
mode share           More than 80%                 20-80%                         Less than 20%
Automobile-dependent, multimodal and car-free communities differ in many ways.

                                                     2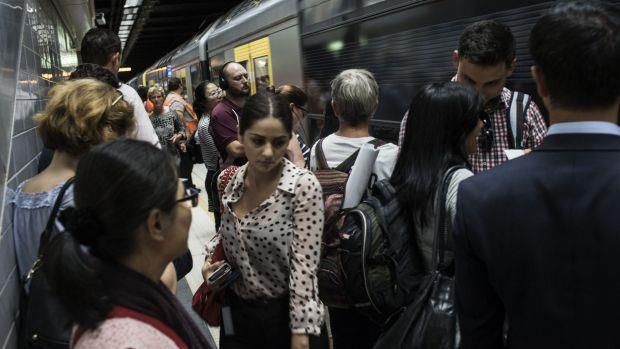
Evaluating Transportation Diversity – Multimodal Planning for Efficient and Equitable Communities
                                   Victoria Transport Policy Institute

Key Terms and Concepts
Transportation diversity (also called multimodalism, or we say that travellers have options or choices)
refers to the availability of various travel modes and services, which can include walking, cycling,
ridesharing (car- and vanpooling), taxi and ridehailing (such as Uber and Lyft) services, various forms
of public transportation (bus, train, ferry, commercial air travel), plus mobility substitutes such as
telework (telecommunications which substitutes for physical travel, such as telecommuting, Internet
shopping and e-medicine) and delivery services (mail, courier, and deliveries by local shops and
restaurants). To complement these mobility options communities need compact development and
well connected transport networks, so most homes and worksites are located within convenient
walking distance of most commonly-used services (shops, restaurants, schools, parks, healthcare,
etc.), providing good non-automobile accessibility. As a result, people who live or work in such areas
tend to own fewer cars, drive less and rely more on alternative modes. Such communities are called
urban villages, Transit-Oriented Development (TOD), Smart Growth, New Urbanist or location-
efficient development, depending on context.

Multimodal planning is the process for creating a diverse transportation system, in contrast to
automobile-oriented planning which favors automobile travel to the detriment of other modes,
which creates automobile-dependent communities. Multimodal planning applies comprehensive
analysis of travel demands and impacts, which tends to increase investments in walking, cycling and
public transit, and justify Transportation Demand Management programs. Multimodal planning also
integrates transportation and land use development policies, and corrects system gaps, such as poor
pedestrian and bicyclist access to public transport stops.

Resilience refers to a system’s ability to accommodate unpredictable changes, including sudden and
extreme conditions. Option value refers to the benefits that people may place on having options
available for possible future use. Transportation diversity tends to increase resilience which provides
option value to people who may want a mode or service in the future.

These factors can be evaluated based on inputs, outputs and outcomes, as illustrated below. For
example, multimodal planning tends to increase the amount of money and road space devoted to
active modes, which increases the quantity and quality of sidewalks, paths and bikelanes, which
often increase walking and bicycling trips, and reduces automobile travel.

Inputs, Outputs and Outcomes

                Inputs                        Outputs                           Outcomes
            (transport policies,             (Quantity and
                                                                              (How and how much
             investments and                quality of roads,
                                                                               people travel, and
              regulations that              parking facilities,
                                                                               associated inpacts
              affect transport               sidewalks and
                                                                             such as transportation
                  system                      paths, public
                                                                                expenditures and
               development)                 transit services,
                                                                                   accidents)
                                                  etc.)

Transportation diversity can be evaluated based on inputs, such as investments in various modes,
output, such as the quantity and quality of facilities and services, or outcomes, such as how and how
much people travel by different modes.

                                                     3
Evaluating Transportation Diversity – Multimodal Planning for Efficient and Equitable Communities
                                  Victoria Transport Policy Institute

Automobile-oriented planning evaluates transportation system performance based on vehicle
travel speeds, and so favors driving over slower modes in planning decisions such as funding and
road space allocation. For example, evaluating transport system performance based on roadway
level-of-service, justifies road expansions to reduce congestion delays, but ignores the tendency
of wider roads and heavier traffic to degrade walking and cycling conditions, and since most
public transit trips include walking links, this reduces transit access. Similarly, conventional
planning requires generous parking supply for motorist convenience, although this results in
more dispersed development which is difficult to access without a car. More comprehensive
analysis tends to justify more diverse transportation investments.

There are many possible ways to evaluate transportation diversity. A narrow perspective only
considers the degree that a particular option achieves a particular objective, such as whether a
sidewalk improvement solves parking problems or whether a new transit service reduces traffic
congestion on a particular corridor. A more comprehensive perspective considers a broader
range of impacts, and the potential for network effects, and so considers whether particular
sidewalk improvements and public transit service expansions can together help create a more
multimodal community where residents own fewer cars, drive less and rely more on alternative
modes, and how this can provide multiple economic, social and environmental benefits. More
comprehensive analysis reflects current planning practices.

A new paradigm is expanding the range of impacts and options considered in transportation
planning, which supports more multimodal planning. The new paradigm recognizes that mobility
is not usually an end in itself, rather, the ultimate goal of most transportation is access to
desired services and activities (school, work, shopping, healthcare, recreation, etc.), and so
recognizes the important roles that walking, cycling and public transit can play in an efficient
and equitable transport system, and it expands planning goals to include affordability, safety,
mobility for non-drivers, and public fitness and health.

                                                        Multimodal planning is a type of transportation
Figure 1 TDM Strategies                                 demand management (TDM) that changes travel
                                                        behavior to increase transport system efficiency.
                                                        It supports and is supported by other TDM
                                                        strategies such as commute trip reduction
                                                        programs and Smart Growth development
                                                        policies. These strategies tend to be synergistic:
                                                        they become more effective if implemented
                                                        together. For example, since most public transit
                                                        trips include walking links, pedestrian
                                                        improvements can help increase transit ridership
                                                        and associated benefits, and become even more
                                                        effective if implemented with supportive land
                                                        use policies such as efficient parking pricing. As a
                                                        result, multimodal planning should be evaluated
                                                        as an integrated program rather than as
Multimodal planning is a type of TDM strategy.          individual components.

                                                   4
Evaluating Transportation Diversity – Multimodal Planning for Efficient and Equitable Communities
Victoria Transport Policy Institute
More comprehensive and multimodal planning tends to increase investments in walking,
cycling, and public transit because they tend to be more space-efficient, energy efficient,
affordable, inclusive, healthy, and less polluting than automobile travel. Even motorists who do
not use these modes can benefit from reduced traffic and parking congestion, accident risk,
chauffeuring burdens and pollution. Current trends are increasing their importance due to:
A growing number of people who cannot or should not drive due to physical, financial or
legal constraints, who need efficient alternatives.
Concerns about transportation affordability.
Increasing concerns about sedentary living health problems, and the value of walking and
bicycling for fitness and health.
Traffic safety policies designed to reduce high risk (young, old, impaired and distracted)
driving, and the need to provide suitable mobility options for these groups.
Desires to address specific planning problems, such as traffic and parking congestion,
excessive energy consumption and pollution emissions.
Goals to create more compact, attractive and less polluted communities.
To their credit, many decision-makers support walking, cycling, public transit and Smart Growth
polices more than is justified by conventional planning analysis: they realize intuitively that
diverse transport systems provide important economic, social and environmental benefits that
conventional analysis undervalues. However, more comprehensive evaluation of these impacts
can lead to better policy and planning decisions. This report is intended to provide practical
guidance for more comprehensive and multimodal transportation planning analysis.
This report explores multimodal planning concepts, investigates travel demands for alternative
modes, discusses benefits provided by transportation diversity and practical ways to evaluate
these impacts, investigates barriers to increased transport diversity, evaluates criticisms of
multimodal planning, and discusses examples. This report should be of interest to policy makers,
practitioners (planners, engineers and economists), and multimodal planning advocates.
Multimodal Planning Principles
1. Recognize all travel demands, including by people who cannot, should not or prefer not to drive.
2. Count every trip. Consider all travel, including short trips, active modes, and recreational travel in
travel surveys and data analysis.
3. Recognize the important roles that walking, bicycling and public transport play in an efficient and
equitable transportation system.
4. Apply comprehensive analysis that considers all benefits and costs.
5. Apply least cost planning, which invests resources in the most cost effective option, including
alternative modes and demand management strategies, considering all impacts.
6. Use transportation demand management to encourage use of efficient mobility options.
7. Integrate transportation and land use planning to create accessible, multimodal communities.
8. Reduce or eliminate requirements and encourage efficient parking management.
5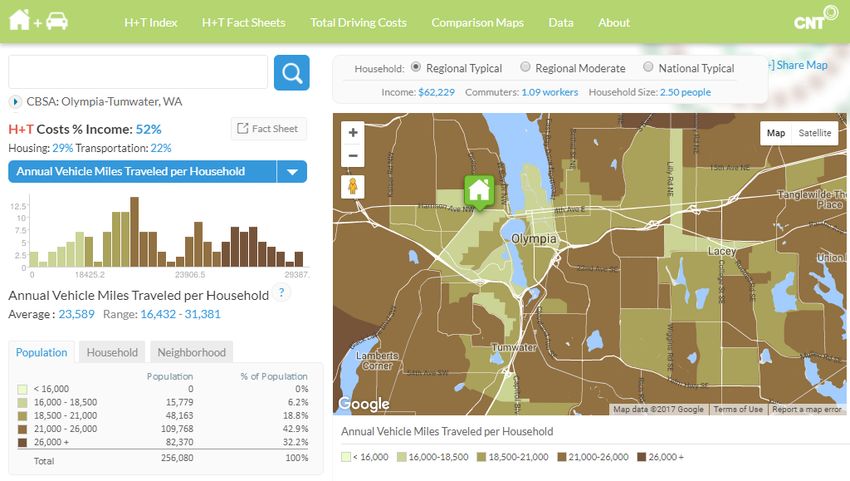
Evaluating Transportation Diversity – Multimodal Planning for Efficient and Equitable Communities
Victoria Transport Policy Institute
The Diversity of Travel Demands
Travel demand refers to the type and amount of travel that people would choose in a particular
situation, such as the number of vehicle miles or transit trips they would take. Since planning
looks toward the future, it should consider the travel options that people would like to use, and
how public resources (money and road space) should be invested to meet those demands. For
example, a community could have a high automobile mode share – most trips are made by car –
yet residents could demand multimodal planning because they want to drive less and rely more
on alternatives. Travel that does not currently occur, but would if conditions changed is called
latent demand. Multimodal transportation planning often involves identifying and serving latent
demands for new types of facilities and services. Failing to consider latent demand can create
self-fulfilling prophecies, in which current high levels of automobile mode share justify
automobile-oriented transportation planning, which perpetuates automobile dependency.
Conventional travel data, based on census data and travel surveys, often undercount active
travel (walking and cycling) trips, which underestimates their demand. Older travel surveys only
count peak-period trips between traffic analysis zones (TAZs), which ignores short trips (those
within a TAZ), non-commute trips, recreational travel, travel by children and a major portion of
active transport (walking and cycling) trips. For example, a bike-bus-walk trip is often coded
simply as a “bus” trip, and an auto commuter who parks at the edge of town and walks ten
blocks to work is coded as a “driver”, the walking and bicycling links are ignored. These older
surveys often indicate that 85-95% of trips are by automobile, suggesting that other modes are
unimportant, but more comprehensive surveys indicate that active travel is three to six times
more common than conventional surveys indicate (Forsyth, Krizek and Agrawal 2010), so if
statistics only indicate that 5% of trips are active, the actual amount is probably 10-30%. Before-
and-after surveys often find significant increases in walking, cycling and public transit travel
after their conditions improve, indicating significant latent demand (FHWA 2015).
In a typical community 20-40% of travellers cannot, should not or prefer not to drive, and so
have non-automobile travel demands, as listed below. Failing to serve these demands can have
negative consequences, including less independence, reduced economic and social
opportunities, excessive transportation costs, reduced physical fitness and health, reduced
enjoyment, plus increased chauffeuring burdens and traffic problems. As a result, even people
who do not use a particular non-automobile mode may demand improvements to that mode if
it reduces their chauffeuring or traffic problems.
Table 2 Examples of Non-Automobile Travel Demands (Brumbaugh 2021; Rogers 2016)
Users Non-users
Youths, 12-24 years old (15-25% of population).
Seniors who do not or should not drive (5-15%).
Adults unable to drive due to disability (3-5%).
Drivers who want to avoid
Low-income households burdened by vehicle costs (20-40%).
chauffeuring burdens.
People impaired or distracted by alcohol, drugs or devices.
Residents who want to reduce traffic
Visitors who lack a vehicle or driver’s license. and parking congestion, accidents and
People who want to walk or bike for enjoyment and health. pollution emissions.
In a typical community, 20-40% of travellers cannot, should not, or prefer not to drive. Most people benefit
from the availability of non-auto modes in their community.
6
Evaluating Transportation Diversity – Multimodal Planning for Efficient and Equitable Communities
                                     Victoria Transport Policy Institute

Table 3 illustrates the modes that various types of travellers consider essential or useful. For
example, affluent motorists rely primarily on driving, but also walk (at least between parked cars
and destinations), and use taxis and carsharing. People who lack a driver’s license (youths,
foreign visitors, etc.), have disabilities, are impaired by alcohol or drugs, have low incomes, or
enjoy exercise rely on other modes to various degrees.

Table 3          Typical Uses of Various Modes
                                         Lack Driver’s   People with    Alc./Drug     Low       Enjoy
        Modes            Motorists         License       Disabilities   Impaired    Income     Exercise
Walk                       SU                  E              E             SU          E         E
Bicycle                                       SU           Varies                      SU         E
Public transit                                 E              E            E            E
Automobile driver            E                               SU                        SU
Auto passenger                                 E             SU            E            E
Taxi                        SU                SU             SU            E           SU
Carsharing                  SU                                                         SU
Universal design                                              E                        SU         SU
Telework                                      SU             SU                        SU
Delivery services                             SU             SU                        SU
Different types of travellers use different modes. (SU = Sometimes useful; E = Essential)

Of course, people’s needs, abilities and preferences vary significantly, both between people and
for individuals over time. Many motorists use alternative modes out of choice, and non-drivers’
use of a particular mode, such as bicycling or telework, can vary depending on many factors.
These variations justify multimodal planning in order to serve these diverse and changing travel
demands.

This analysis indicates that each mode can play important and unique roles in an efficient and
equitable transportation system. An automobile-dependent transportation system is inefficient
and unfair because it results in automobile trips that would be cheaper overall made by other
modes, and it deprives non-drivers of independent mobility.

                                                     7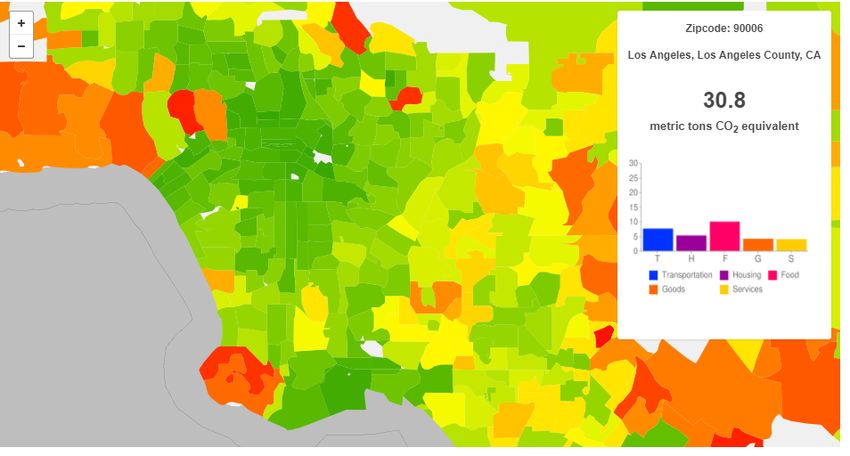
Evaluating Transportation Diversity – Multimodal Planning for Efficient and Equitable Communities
                                  Victoria Transport Policy Institute

Transportation Diversity Benefits
This section describes various benefits provided by a more diverse, less automobile-dependent
transportation system.

Congestion Reductions and Infrastructure Cost Savings
Automobile travel is space intensive. Figure 2 compares road space needs of various modes.

Figure 2        Space Required to Transport 40 People (www.tobinbennett.com)

                                                                                             Automobile
                                                                                             travel requires
                                                                                             far more road
                                                                                             space than other
                                                                                             modes, and so
                                                                                             causes more
                                                                                             traffic
                                                                                             congestion.

Vehicle travel also requires parking at each destination. Figure 3 compares the road and parking
space requirements for commuting by various modes: automobiles require many times more
space than walking, cycling and public transit.

Figure 3        Space Required By Travel Mode1

                                                                                      Automobile travel
                                                                                      requires far more
                                                                                      space for travel
                                                                                      and parking than
                                                                                      other modes.

1
 Transport Land Requirements Spreadsheet (www.vtpi.org/Transport_Land.xls), based on Eric Bruun and
Vukan Vuchic (1995), “The Time-Area Concept: Development, Meaning and Applications,” Transportation
Research Record 1499, TRB (www.trb.org), pp. 95-104; at https://trid.trb.org/view.aspx?id=452722.

                                                   8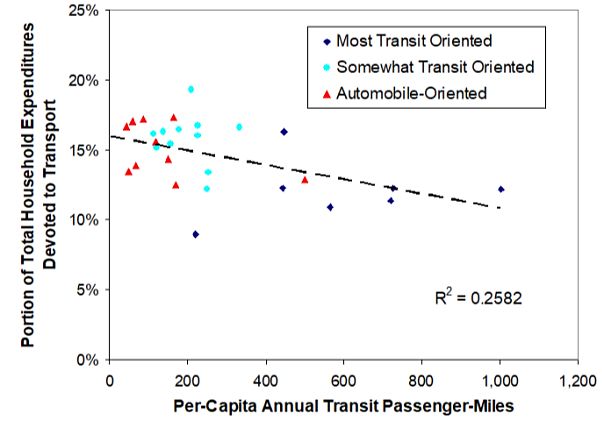
Evaluating Transportation Diversity – Multimodal Planning for Efficient and Equitable Communities
                                                   Victoria Transport Policy Institute

As a result, walking, cycling and public transit help reduce traffic and parking congestion in the
short run, and over the long run can help reduce road and parking facility costs. There is debate
concerning these impacts (Bouf and Hensher 2007; Litman 2014a). Critics sometimes argue that
because transit only carries a small portion of total travel it can do little to reduce congestion,
but on the most congested, such as urban highways and downtown arterials, alternative modes
can carry a significant portion of peak-period travel and provide significant congestion
reductions (Nelson\Nygaard 2006), as illustrated in Figure 4.

Figure 4                         Regional, Central City and CBD Mode Shares (Pisarski 2006)
                     80%
                     70%
                                                                                             Region
Transit Mode Share

                     60%                                                                     Central City
                     50%                                                                     CBD
                     40%
                     30%
                     20%
                     10%
                     0%

Although transit is typically just 1-3% of total regional mode share, it represents a larger portion of urban
commuting (typically 5-10%) and an even greater share of peak-period travel to major activity centers
such as central business districts (CBDs) and campuses (typically 10-50%).

These impacts can be difficult to measure because congestion maintains a self-limiting
equilibrium: it increases until delays cause some travelers to reduce their peak-period vehicle
trips. The quality of travel options affects this equilibrium. If alternatives to driving are
inefficient or uncomfortable, delays must become severe before travellers shift modes, but if
alternative are attractive, less congestion is needed to cause shifts. Congestion does not
disappear, but is less severe than would occur without these alternatives.

Congestion can be measured in various ways that give very different conclusions about the
nature of this cost and the effectiveness of various solutions (Litman 2014a; Wallis and Lupton
2013). Indicators such as roadway Level-of-Service and the Travel Time Index measure
congestion intensity, the degree that traffic speeds decline during peak periods. Measured this
way, alternative modes only reduce congestion if they reduce motorists’ delay. More
comprehensive indicators, such as per capita congestion costs or commute duration, also
account for the congestion avoided by travellers who choose alternative modes or shorter
commutes. For example, compact, multi-modal cities such as New York, Boston and
Philadelphia tend to have more intense congestion (greater peak-period speed reductions), but
lower congestion costs (fewer annual hours of delay per capita) due to lower auto mode shares
and short trip lengths, which reduces congestion exposure (the amount residents drive during

                                                                    9
Evaluating Transportation Diversity – Multimodal Planning for Efficient and Equitable Communities
Victoria Transport Policy Institute
peak periods). More dispersed, automobile-oriented cities such as Houston, Atlanta and Detroit
tend to have less intense congestion but greater congestion costs.
Empirical evidence indicates that residents of more multimodal communities experience less
traffic congestion than in more sprawled, automobile-dependent areas. A major study in
Phoenix, Arizona found less intense congestion, and less congestion experienced by residents of
more compact, multimodal neighborhoods than in lower-density, automobile-dependent areas
(Kuzmyak 2012). Hamilton and Wichman (2016) used a unique fine-grained traffic dataset to
measure the Washington DC Capital Bikeshare program’s congestion impacts. They found that
bikeshare stations reduced congestion by 4% or more compared with what would otherwise
occur, with the greatest reductions in the most congested areas. Because transit riders tend to
travel on congested urban corridors, they usually have much larger congestion reduction
impacts than their mode share. For example, although only 11% of Los Angeles commuters use
transit, when a strike halted transit service for five weeks, average highway congestion delay
increased 47%, with 11% to 38% increases in regional congestion costs (Anderson 2013).
10Evaluating Transportation Diversity – Multimodal Planning for Efficient and Equitable Communities
Victoria Transport Policy Institute
Consumer Savings and Affordability
Walking, cycling and public transit are much cheaper than automobile travel, providing savings
and affordability (savings to lower-income households). Automobiles sometimes impose large
unexpected costs for repairs, crashes or traffic citations that can be particularly burdensome to
lower-income motorists (Weinstein Agrawal, et al. 2011). Residents of compact, multimodal
communities spend much less on transportation than in sprawled, automobile dependent areas
(CTOD and CNT 2006; Ewing and Hamidi 2014), as illustrated in figures 5 and 6. Households in
transit-oriented neighborhoods often spend less than 10% of their budgets on transportation,
compared with more than 20% in sprawled, automobile-dependent areas (Litman 2005).
Figure 5 Household Transport Spending Versus Compactness (Grammenos 2016)
Households in compact, multimodal regions
spend a far smaller portion of their budgets
on transportation than in sprawled,
automobile-dependent regions such as
Phoenix and Detroit.
Much greater differences are found when
these impacts are evaluated at a finer
geographic scale. Residents of compact,
multimodal neighborhoods typically spend
half as much on transportation as in
sprawled, automobile-dependent areas,
and have better fallback options when they
are unable to drive.
Potential saving are even larger than these surveys indicate since many households spend more
on vehicles than necessary, for example, owning expensive vehicles for status sake, or additional
vehicles for recreation. Transportation diversity also increases economic resilience by providing
savings opportunities for responding to financial stresses such as reduced income or a vehicle
failure, an option that is not feasible in automobile-dependent areas. This helps explain why
housing foreclosure rates are much lower in more multimodal communities (NRDC 2010).
Figure 6 Household Transport Spending Versus Transit Use (Litman 2005)
The portion of household budgets
devoted to transportation (automobiles
and transit) tends to decline with
increased transit ridership, and is much
lower in transit-oriented than in
automobile-dependent urban regions.
11Evaluating Transportation Diversity – Multimodal Planning for Efficient and Equitable Communities
Victoria Transport Policy Institute
Mobility for Non-Drivers
As previously described, 20-40% of residents in typical communities cannot or should not drive
due to age, poverty, disability or impairment. Without suitable travel options:
Non-drivers lack independent mobility. They have fewer opportunities to travel when and
where they want, and so may have difficulty accessing basic services and activities. This
reduces their economic opportunities, and conversely, the pool of potential employees
available to businesses. It also reduces their recreational activities, reducing their physical
and mental health.
Non-drivers receive less than their fair share of transportation investments. Approximately
$700 is spent on roads and $1,000-3,000 on parking subsidies per capita, compared with
$100-200 for transit subsidies and $20-50 for pedestrian and cycling facilities. This is unfair
to non-drivers and since automobile travel tends to increase with income, it is regressive,
forcing lower-income households to subsidize the transport costs of wealthier neighbors.
Motorists must chauffeur non-drivers. In automobile-dependent communities this
represents a major portion of total travel (Litman 2015). In the U.S., at least 6.9% of total
personal trips, 15% of morning peak trips, and 9.4% of afternoon peak trips are for
chauffeuring (McGuckin 2009).
Higher-risk people drive even if they should, and want to, use alternatives. Many traffic
safety strategies, such as graduated licenses, senior driving tests, anti-impaired and anti-
distracted driving campaigns are intended to reduce high risk driving. Their effectiveness
depends, in part, on these groups having viable alternatives to driving.
More compact, multimodal communities increase economic mobility, that is, the chance
that a child who grows up in a lower-income household will be more economically
prosperous as an adult (Ewing, et al. 2017; Talen and Koschinsky 2013). More diverse
transport options help them access economic opportunities such as school and work
(Stanley, et al. 2010).
Figure 7 Upward Mobility Versus Neighborhood Accessibility (Ewing, et al. 2016)
Economic mobility (the chance that
children born in poverty become
economically successful as adults) is
greater for households living in more
accessible, multimodal communities.
This probably reflects ways that
multimodal transportation increases
non-drivers’ economic opportunities.
12Evaluating Transportation Diversity – Multimodal Planning for Efficient and Equitable Communities
Victoria Transport Policy Institute
Traffic Safety
An extensive body of research using various data sets and methods indicates that traffic casualty
rates (deaths and injuries) tend to decline with more compact and multimodal urban
development (Duduta, Adriazola-Steil and Hidalgo 2013; Welle, et al. 2015). Per capita traffic
crash rates tend to decline with more compact and mixed development, smaller block sizes,
increased street connections, narrower streets, better pedestrian and cycling facilities, better
crosswalks, roundabouts and more traffic calming (Ewing and Dumbaugh 2009; Garrick and
Marshall 2011). Ewing and Hamidi (2014) found that more compact U.S. urban areas had slightly
higher crash rates but much lower traffic fatality rates than sprawled areas: each 10% increase
in their compact community index is associated with a 0.4% increase in total crashes, and a
13.8% reduction in traffic fatalities.
Traffic fatality rates tend to decline with increased transit ridership (Stimpson, et al. 2014).
Figure 8 illustrates the relationship between transit trips and traffic fatality rates for U.S. cities.
Higher-transit-ridership regions (more than 50 annual transit trips per capita) have about half
the average traffic fatality rates as low-transit-ridership cities (less than 20 annual trips per
capita). This represents a small increase in transit mode share, from about 1.5% up to about 4%,
but is associated with large reductions in traffic fatality rates. This suggest that many of the
factors that encourage transit travel, such as more compact development, improved walking
conditions, and reduced parking supply, also tend to reduce traffic fatality rates.
Figure 8 Transit Travel Versus Traffic Deaths in U.S. Cities (Litman 2016)
20
Traffic Fatalities Per 100,000 Residents
18
As transit travel
16 increases, per capita
14 traffic fatality rates
tend to decline. Cities
12 where residents
10 average more than
50 annual transit
8 trips have about half
6 the average traffic
fatality rates as cities
4
where residents
2 R² = 0.2676 average fewer than
20 annual transit
0
trips.
0 50 100 150 200 250
Annual Transit Trips Per Capita
As active travel (walking and cycling) increases in a community, total per capita traffic casualty
rates, and per-mile pedestrian and cyclist crash rates tend to decline, an effect sometimes called
safety in numbers (Jacobsen 2003; Myers, et al. 2013). This probably results from a combination
of less total vehicle travel, less higher-risk (youth, senior, impaired, etc.) driving, slower traffic
speeds, and more caution by drivers in compact, multimodal communities.
13Evaluating Transportation Diversity – Multimodal Planning for Efficient and Equitable Communities
Victoria Transport Policy Institute
Increased Public Fitness and Health
To maintain basic fitness and health, experts recommend that people spend at least 22 daily
minutes (150 minutes a week) in moderate physical activity, such as fast walking or cycling (CDC
2008). Although there are many possible ways to exercise, organized sports or fitness training
require special time and expenditures, and can be challenging for people who are overweight
and sedentary. For many people, particularly those with the greatest risks, neighborhood
walking and cycling are among the most practical way to achieve fitness targets.
An extensive body of research indicates that living in a more multimodal community increases
the portion of residents who are physically active and fit (Ewing and Hamidi 2014). Controlling
for other factors Frank, et al. (2006) found that a 5% increase in a walkability index is associated
with a 32.1% increase in active transport, a 0.23 point reduction in body mass index, a 6.5% VMT
reduction, and reduced per capita air emissions. Improving walking and cycling conditions,
improving public transit services, more connected roadway networks, more compact and mixed
development, improved access to parks and recreational facilities, and programs that promote
active transport tend to increase public fitness and health (CPSTF 2017).
Most public transit trips include walking links so physical activity tends to increase with transit
travel. Lachapelle, et al. (2011) found that transit commuters average 5 to 10 more minutes of
moderate-intensity physical activity, and walked more to services and destinations than
nonusers. Melbourne, Australia residents who use public transit average 41 daily minutes of
walking or cycling for transport, five times more than the 8 minutes averaged by residents who
travel only by automobile (BusVic 2010).
Ewing and Hamidi (2014) found that every doubling in their Compact Community index life
expectancy increases about 4%. For the average American with a life expectancy of 78 years,
this translates into a three-year difference in life expectancy between people in a less compact
versus a more compact county.
Frederick, Riggs and Gilderbloom (2017) analyzed the relationships between commute mode
share (the portion of commuters who do not drive an automobile, which ranges from 11% to
36%) as an indicator of transportation system diversity, and twelve public health and quality of
life indicators for various mid-size U.S. cities and counties. The results indicate that, after
adjusting for various demographic factors, there is significant positive relationship between
more modal diversity and positive public health outcomes including healthier behaviors
reported in the Gallup/Healthway’s Well-Being Index, more leisure quality reported by Sperling’s
Cities Ranked and Rated, more access to exercise reported by the Environmental Systems
Research Institute, less sedentary living and obesity reported in the Center for Disease Control’s
Diabetes Interactive Atlas, more Years of Potential Life Lost (an indicator of longevity and overall
health), and higher birth weights (an indicator of infant health) reported by the National Center
for Health Statistics. These relationships are stronger than many other sociological,
geographical, and economic indicators including density, latitude, race, education and income,
suggesting that living in a more multimodal community provides significant health benefits.
Many of the health benefits found to be associated with urban density may actually reflect
those areas’ transportation diversity, which suggests that policies that improve walking, cycling
and public transit can provide health benefits in cities, suburbs and small towns.
14Evaluating Transportation Diversity – Multimodal Planning for Efficient and Equitable Communities
Victoria Transport Policy Institute
Energy Conservation and Pollution Emission Reductions
Walking and cycling require minimal energy. They are fueled by food, which many people
overconsume for pleasure, so burning these calories is a benefit rather than a cost. Many public
transit vehicles consume fossil fuels and produce emissions, but less than automobiles per
passenger-mile, and by stimulating more compact, multimodal development, public transit
tends to reduce per capita vehicle travel which leverages additional energy savings and emission
reductions (Gallivan, et al. 2015; ICF 2010). Figure 9 compares lifecycle greenhouse gas
emissions for various modes, taking into account embodied energy to produce vehicles, plus
direct and indirect fuel emissions. Walking and cycling emissions are too small to count.
Figure 9 Lifecycle Carbon Intensity By Mode (http://shrinkthatfootprint.com)
Energy consumption and pollution
emission rates vary by mode and
vehicle type.
Walking and cycling emissions are
too small to count. Local transit
services have low to moderate
emission rates, but by providing a
catalyst for more compact,
multimodal communities where
residents reduce their total travel,
transit investments can leverage
large reductions in per capita
energy consumption and emissions.
Carbon dioxide equivalent grams per passenger kilometre (g CO2e/pkm)
More compact, multimodal development reduces per capita energy consumption and pollution
emissions by reducing vehicle travel and building energy use (Decker, et al. 2017; Litman 2011;
Meyer 2013). Figure 10 illustrates these impacts.
Figure 10 Household Energy Consumption (http://coolclimate.berkeley.edu/maps)
This map produced by the
Cool Climate Calculator
illustrates average
annual household carbon
footprint by zip code in
the Los Angeles region.
More central locations
tend to have lower
emissions (dark green)
due largely to less driving
and more use of
alternative modes.
15Evaluating Transportation Diversity – Multimodal Planning for Efficient and Equitable Communities
Victoria Transport Policy Institute
Strategic Development Goals
Many communities have strategic goals to create more compact communities in order to reduce
land consumption and therefore preserve openspace, reduce public infrastructure and service
costs, and to create more accessible, less automobile-dependent communities (Ewing and
Hamidi 2014; Litman 2017). These are sometimes called livability objectives.
Openspace includes farmlands and undeveloped lands such as forests, shorelines, parks and
wilderness areas, which provide various economic, social and environmental benefits including
agricultural production, tourism, recreation, cultural activities, water and air quality, wildlife
habitat and beauty (Jacob and Lopez 2009; Tagliafierro, et al. 2013).
More compact development reduces the costs of providing public infrastructure and services
such as roads, utilities, emergency services and school transportation. Figure 11 shows how
density reduces per capita lane-miles which road construction and operating costs, stormwater
management costs, and environmental impacts. More compact development provides similar
reductions in parking facility needs. Analysis by Burchell and Mukherji (2003) indicates that
modest increases in development density typically reduce road lane-miles about 10%, public
service costs 10%, housing development costs 8%, providing capital cost saving that average of
$13,000 per dwelling unit or $550 annually. A study for West Des Moines, Iowa calculates that,
to accommodate 9,275 new housing units, compact development designed to maximize
neighborhood walkability would generate $11.2 million ($417 annual per capita) net fiscal gains
(incremental tax revenue minus incremental costs), about 50% more than the $7.5 million ($243
annual per capita) generated by the lowest density scenario (SGA and RCLCO 2015).
Figure 11 Urban Density Versus Roadway Supply (FHWA 2012, Table HM72)
As urban densities increase, roadway
supply declines. U.S. cities with less than
1,000 residents per square mile
(approximately 1.6 residents per acre)
have nearly three times as much land
devoted to roads than denser cities with
more than 4,000 residents per square
mile (approximately 6 residents per
hectare). This reduces per capita road
construction and operating costs,
hydrologic and stormwater
management costs, and environmental
impacts.
(Each dot represents a U.S. urban
region.)
Multimodal transportation planning both supports and is supported by compact development,
particularly strategies such as more efficient parking management, improving space-efficient
modes (walking, cycling, public transit, etc.), and transit-oriented development.
16Evaluating Transportation Diversity – Multimodal Planning for Efficient and Equitable Communities
Victoria Transport Policy Institute
Local Economic Development
More multimodal transportation can support local economic development in several ways
(Angel and Blei 2015; Decker, et al. 2017):
It expands the pool of lower-wage workers available to employers, many of whom are
limited in their ability to drive and so must rely on alternative modes, at least occasionally.
It increases agglomeration efficiencies, which tend to increase productivity and incomes
(Melo, Graham and Noland 2009). Hsieh and Moretti (2015) estimate that allowing more
infill development in highly productive U.S. cities could increase national economic output
by 13%.
It reduces the costs of providing public infrastructure and services, parking subsidy costs to
businesses, and various economic costs such as productivity from disabilities caused by
traffic accidents and illnesses caused by sedentary living.
It reduces the amount of money that residents spend on vehicles and fuel, expenditures that
provide relatively little local economic productivity and employment per dollar. As a result,
reducing vehicle expenditures tends to increase local economic activity.
It lets households build long-term wealth by shifting spending from vehicles to real estate.
For example, a household in a multimodal neighborhood that spends $20,000 annually on
mortgage payments and $5,000 on vehicles, after a decade typically accrues $100,000 more
equity than if they spend $15,000 on mortgage and $10,000 on vehicles in an automobile-
dependent area.
It supports industries including tourism, recreation and retail which are stimulated by more
walkable, bikeable and attractive communities.
At both state and regional scales, per capita GDP tends to decline with vehicle-miles traveled
(VMT) and increases with per capita transit ridership (Kooshian and Winkelman 2011) (Figure
12). This probably reflects the efficiencies of compact land use development and the
transportation system efficiencies that result from a more multimodal transportation system.
Figure 12 Per Capita GDP and VMT For U.S. States (BTS 2006 and BEA 2006)
$50,000
Per Capita Annual GDP (2004)
$40,000
Per capita economic
$30,000
productivity increases
as vehicle travel
declines. (Each dot is a
$20,000
U.S. state.)
R² = 0.3546
$10,000
$0
0 5,000 10,000 15,000 20,000
Annual Per Capita Vehicle Miles Traveled (VMT)
17Evaluating Transportation Diversity – Multimodal Planning for Efficient and Equitable Communities
Victoria Transport Policy Institute
Summary
Compared with automobile travel, other modes can provide various savings and benefits, as
summarized in Table 4. Depending on the audience, walking, cycling and public transit can be
called space-efficient, affordable, inclusive, healthy, green or sustainable modes. Not every non-
auto mode improvement provides all of these benefits, but most provide several.
Table 4 Multimodal Transportation Benefits
Typical Impacts of Non-Auto Modes Benefits
Space-efficient. Non-auto modes require less Less traffic and parking congestion, and therefore
space per passenger-mile. lower road and parking costs.
Non-auto modes cost less than driving. Increases affordability and economic resilience.
Inclusive. Non-auto modes serve people who lack Improves mobility options for people who cannot
a vehicle or driver’s license. drive. Reduces chauffeuring burdens.
Increases safety. Public transit has very low crash
casualty rates. Walking and cycling impose Reduces traffic casualty (injuries and deaths) rates,
minimal risk on other road users. including risks to motorists.
Improves public fitness and health, provides
Non-auto modes are healthy and enjoyable to use. enjoyment, and supports industries such as tourism.
Non-auto modes are energy efficient and low Reduces energy consumption and resulting
polluting economic and environmental costs.
Reduces per capita land consumption, public
Multimodal planning supports strategic planning infrastructure costs, and improves overall
goals such as more compact development. accessibility.
Non-auto modes reduce fuel imports, expand
worker pools, provide agglomeration efficiencies, Increases local economic development
reduce infrastructure costs and support industries. (employment, productivity, tax revenues)
Compared with automobile travel, walking, cycling and public transport can provide many benefits.
Even people who do not currently walk, bicycle or use public transit can benefit from living in a
community that accommodates these modes if they reduce traffic and parking congestion,
accident risk, chauffeuring burdens, and pollution emissions, and non-users might need these
modes in the future, called option value (DfT 2003; ITF 2017). This is not to suggest that walking,
cycling and public transit can serve all trips and driving should be eliminated, but it does suggest
that everybody can benefit from multimodal planning which allows each mode to serve the trips
for which they are best suited.
18Evaluating Transportation Diversity – Multimodal Planning for Efficient and Equitable Communities
Victoria Transport Policy Institute
Multimodal Performance Indicators
This section describes methods that can be used to evaluate the degree that a transportation system
is multimodal and the benefits of improving transport diversity.
Performance indicators are metrics suitable for evaluating conditions and measuring progress
(or the lack thereof) toward goals. Most commonly-used transportation performance indicators,
such as roadway Level-of-Service (LOS) ratings and distance-based traffic accident rates (traffic
crashes per 100 million vehicle miles), evaluate transportation system performance based on
automobile travel conditions, with little consideration of other modes. This favors automobile-
oriented improvements and undervalues improvements to other modes. In recent years,
professional organizations have developed multimodal performance indicators suitable for
multimodal planning (Brozen, et al. 2014; De Oña, et al. 2016; FDOT 2012; NYDOT 2012).
Indicators by Mode
Walkability
Walkability refers to the overall quality of the pedestrian environment. Dowling and Associates
(2008-2010) describe walking Level-of-Service (LOS) indicators. Semler, et al. (2016) describe
how to choose and implement such indicators. Seiff and Weissman (2016) describe the process
for collecting these data in typical communities. The Walkability Level of Service Website
(www.levelofservice.com) provides information on methods for evaluating pedestrian LOS.
Performance indicators include:
Portion of roads with suitable sidewalks, crosswalks and paths.
Conditions of sidewalks, crosswalks and paths (pedestrian LOS).
Roadway widths and traffic volumes (and therefore the ease of crossing roads).
Pedestrian amenities such as benches, trees and awnings.
Pedestrian information including wayfinding signage.
Universal Design
Universal Design (also called barrier-free design) refers to facilities that accommodate people
with diverse abilities and needs, including wheelchairs users, people who walk with difficulty or
have visual disabilities, and pedestrians pushing strollers or handcarts. The term Universal
Design is preferred to handicapped access because these design requirements can benefit many
users, not just those with disabilities.
Several planning and professional organizations publish Universal Design guidelines and
standards, including the U.S. Access Board (www.access-board.gov) and Access Exchange
International (www.globalride-sf.org).
Performance indicators include:
Portion of roads with suitable sidewalks, crosswalks and paths, and the portion of those facilities
that meet universal design standards.
Portion of transportation services that meet universal design standards.
Enforcement of universal design standards.
19Evaluating Transportation Diversity – Multimodal Planning for Efficient and Equitable Communities
Victoria Transport Policy Institute
Bicycling
Dowling and Associates (2008-2010) describe bicycling Level-of-Service indicators. Semler, et al.
(2016) and Seiff and Weissman (2016) describe how to choose and implement such indicators.
Performance indicators include:
Portion of roads with suitable bike lanes and paths.
Conditions of roads, bikelanes and paths (bicycling LOS).
Roadway traffic volumes (and therefore the ease of riding on or crossing).
Amenities such as bicycle parking.
Enforcement of traffic laws that protect cyclists.
Cycling information including wayfinding signage.
Public Transit
Public transit includes various vehicles and services (demand response, bus, train, ferries, etc.)
that provide motorized transport to the general public. This includes local services within a
community, and interregional services that connect distant communities. Various publications
provide guidelines for evaluating transit service quality (Kittelson & Associates 2017; TRB 2010).
The Local Index of Transit Availability (LITA) rates transit service availability within urban areas,
taking into account demographic and geographic factors (Rood 1999). Transit service can be
assessed with respect to specific mobility needs, such as welfare-to-work (Tomer, et al. 2011).
Performance indicators include:
Service availability (portion of homes, worksites and services located within a ten-minute walk of
transit services).
Service hours.
Service frequency (number of transit vehicles per hour).
Service reliability (on schedule performance).
Comfort (e.g., crowding and cleanliness of shelters and vehicles).
Service speeds compared with driving.
Personal security while walking, waiting and riding on transit.
Quality of pedestrian access to transit stops and stations.
Fares relative to users’ income.
Taxi
Taxi services provide chauffeured automobile travel to the general public. Ridehailing services
such as Uber and Lyft are a variation. Taxi services are often regulated, in part to maintain
service quality (Linton 2016).
Performance indicators include:
Average response time for various conditions and locations.
Number of taxis per capita, or per non-driver in an area.
Ridehailing services availability.
Price for an average trip relative to users’ income.
Comfort, safety, reliability, and courtesy of service.
Number of taxis able to carry people with disabilities (i.e., wheelchair users).
Number of problems reported by users.
20You can also read