EVALUATING THE IMPACT OF COVID-19 ON NSW SCHOOLS
←
→
Page content transcription
If your browser does not render page correctly, please read the page content below
2 0 2 0 RE PORT TO THE
N SW DEP ARTM ENT OF E DUC ATION

EVALUATING THE IMPACT OF
COVID-19 ON NSW SCHOOLS

LAUREATE PROFESSOR JENNY GORE · DR LEANNE FRAY ·
DR DREW MILLER · ASSOCIATE PROFESSOR JESS HARRIS
WITH MRS WENDY TAGGART

December 2020
Acknowledgements
We acknowledge the support provided in the preparation of this report by the incredible team of casual research
assistants who visited schools in 2019 and 2020. We would also like to extend our sincere thanks to the excellent
team of research project officers, research assistants and administrative staff who work behind the scenes at the
Teachers and Teaching Research Centre and whose work supports projects such as this. We are most grateful to
the school leaders, teachers and students who participated in this project.

Our gratitude is extended to the Paul Ramsay Foundation for funding the project that sits behind these analyses,
which generated rigorous comparative data from 2019 and Term 1 2020. We are most grateful to the NSW
Department of Education for supporting and funding the Term 4 2020 data collection during such a challenging
year. Finally, we acknowledge the University of Newcastle for its ongoing support of our research programs. All
three institutions share deep commitments to excellence and equity, which are the driving concerns of the
Teachers and Teaching Research Centre.

This work is licensed under the Creative Commons Attribution-NonCommercial-NoDerivatives 4.0 International
License. To view a copy of this license, visit https://creativecommons.org/licenses/by-nc-nd/4.0/ or send a letter
to Creative Commons, PO Box 1866, Mountain View, CA 94042, USA.

ISBN: 978-0-7259-0255-1

For any queries about this work, please contact teachers-and-teaching@newcastle.edu.au

Evaluating the impact of COVID-19 on NSW schools i|P a g e
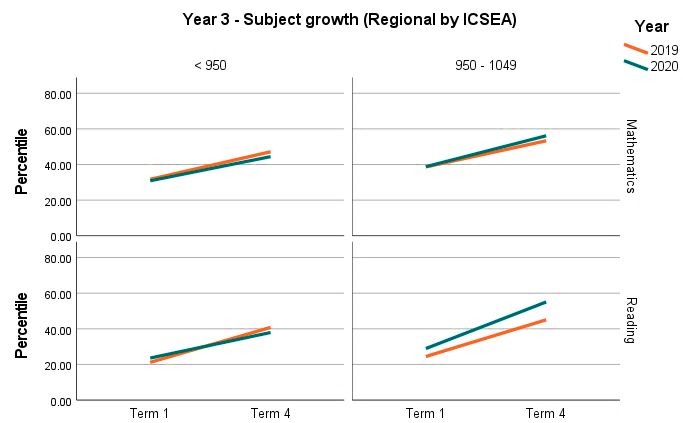
Table of Contents
Acknowledgements ......................................................................................................................................... i
List of Tables .................................................................................................................................................. iii
List of Figures ................................................................................................................................................. iii
Executive Summary ........................................................................................................................................ v
1 Research Background ........................................................................................................................... 10
2 Methodology ........................................................................................................................................ 13
 2.1 Sample ..................................................................................................................................... 13
 2.2 Student data ............................................................................................................................ 14
 2.2.1 Progressive Achievement Tests and student surveys ..................................................... 14
 2.3 Teacher data ............................................................................................................................ 15
 2.3.1 Teacher surveys ............................................................................................................... 15
 2.3.2 Teacher interviews .......................................................................................................... 15
 2.4 Analysis .................................................................................................................................... 16
 2.4.1 Student outcomes ........................................................................................................... 16
 2.4.2 Teacher outcomes ........................................................................................................... 18
 2.4.3 Interview data ................................................................................................................. 18
 2.5 Interpretation of tables and figures......................................................................................... 18
 2.5.1 Student Progressive Achievement Test (PAT) tables ...................................................... 19
 2.5.2 Student Progressive Achievement Test (PAT) figures ..................................................... 19
3 Findings ................................................................................................................................................. 20
 3.1 Impact on student achievement .............................................................................................. 20
 3.1.1 Student achievement ...................................................................................................... 20
 3.1.2 Instructional volume........................................................................................................ 40
 3.1.3 Impact on student achievement – perceptions of teachers and school leaders ............ 40
 3.2 Student perceptions of school ................................................................................................. 46
 3.3 Impact on student well-being .................................................................................................. 54
 3.3.1 During learning from home ............................................................................................. 54
 3.3.2 Upon return to school ..................................................................................................... 55
 3.4 Impact on teachers .................................................................................................................. 58
 3.4.1 Teacher morale................................................................................................................ 61
 3.4.2 Teacher efficacy............................................................................................................... 64
4 Discussion ............................................................................................................................................. 66
 4.1 The importance of context ...................................................................................................... 66
 4.2 Predicted versus actual impact on student learning ............................................................... 67
 4.3 Heightened concern for student well-being ............................................................................ 69
 4.4 Teachers, the un/sung heroes? ............................................................................................... 70
5 Significance ........................................................................................................................................... 72
References .................................................................................................................................................... 73
Appendix A. Student Survey extract ............................................................................................................. 79
Appendix B. Teacher Survey extract ............................................................................................................. 80

Evaluating the impact of COVID-19 on NSW schools ii | P a g e
List of Tables
Table 1 Year 3 significant differences in mathematics and reading achievement (2019-2020) by ICSEA ...........................vii
Table 2 Data collection (2019-2020) ................................................................................................................................... 13
Table 3 Sample characteristics (2019-2020) ....................................................................................................................... 14
Table 4 Location of 2020 interview schools and participants............................................................................................. 15
Table 5 Sociodemographic characteristics of schools in interview sample ........................................................................ 16
Table 6 Matched sample characteristics (2019-2020) ........................................................................................................ 17
Table 7 Year 3 student achievement in mathematics and reading (2019-2020) by ICSEA ................................................. 20
Table 8 Year 3 student achievement in mathematics and reading, (2019-2020) ............................................................... 22
Table 9 Year 3 student achievement in mathematics and reading (2019-2020) by ICSEA ................................................. 24
Table 10 Year 4 student achievement in mathematics and reading (2019-2020) .............................................................. 27
Table 11 Year 4 student achievement in mathematics and reading (2019-2020) by ICSEA ............................................... 29
Table 12 Student achievement by subject and location (2019-2020) ................................................................................ 30
Table 13 Year 3 and 4 student achievement in mathematics and reading (2019-2020) by location ................................. 32
Table 14 Year 3 and 4 regional student achievement in mathematics and reading (2019-2020) by ICSEA ....................... 34
Table 15 Year 3 and 4 regional student achievement in mathematics and reading (2019-2020) by ICSEA ....................... 35
Table 16 Indigenous student achievement in mathematics and reading (2019-2020) ...................................................... 38
Table 17 Instructional volume (hours per week) in literacy, reading and numeracy (2019-2020)..................................... 40
Table 18 Quality of School Life and School Learning Culture (2019-2020) ......................................................................... 47
Table 19 Year 3 Quality of school life and school learning culture (2019-2020) ................................................................ 48
Table 20 Year 4 Quality of school life and school learning culture (2019-2020) ................................................................ 50
Table 21 Whole sample Quality of school life and school learning culture (2019-2020) ................................................... 52
Table 22 Teacher survey sampling and descriptive statistics (2019-2020)......................................................................... 59
Table 23 Teacher efficacy, teacher morale and appraisal (2019-2020) .............................................................................. 60

List of Figures
Figure 1 Year 3 student achievement in mathematics and reading (2019-2020)............................................................... 23
Figure 2 Year 3 student achievement in mathematics and reading (2019-2020)............................................................... 25
Figure 3 Year 4 student achievement in mathematics and reading (2019-2020)............................................................... 28
Figure 4 Year 4 student achievement in mathematics and reading (2019-2020) by ICSEA ................................................ 30
Figure 5 Year 3 student achievement in mathematics and reading (2019-2020) by location ............................................ 33
Figure 6 Year 4 Student achievement in mathematics and reading (2019-2020) by location............................................ 33
Figure 7 Year 3 regional student achievement in mathematics and reading (2019-2020) by ICSEA .................................. 36
Figure 8 Year 4 regional student achievement in mathematics and reading (2019-2020) by ICSEA .................................. 36
Figure 9 Year 3 Indigenous student achievement in mathematics and reading (2019-2020) ............................................ 39
Figure 10 Year 4 Indigenous student achievement in mathematics and reading (2019-2020) .......................................... 39
Figure 11 Year 3 Quality of school life and school learning culture (2019-2020) ............................................................... 49

Evaluating the impact of COVID-19 on NSW schools iii | P a g e

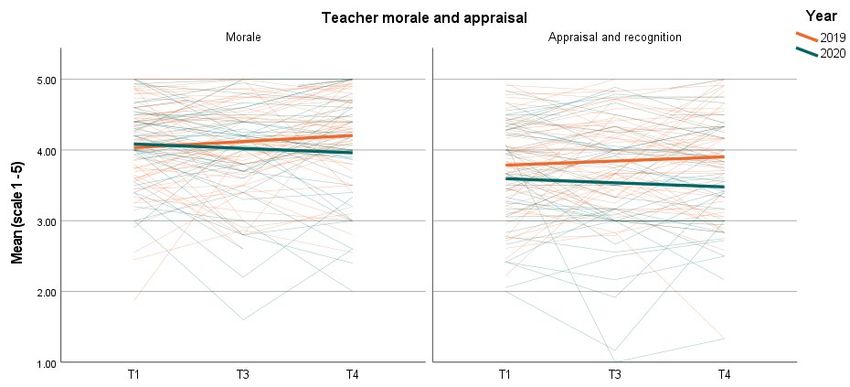
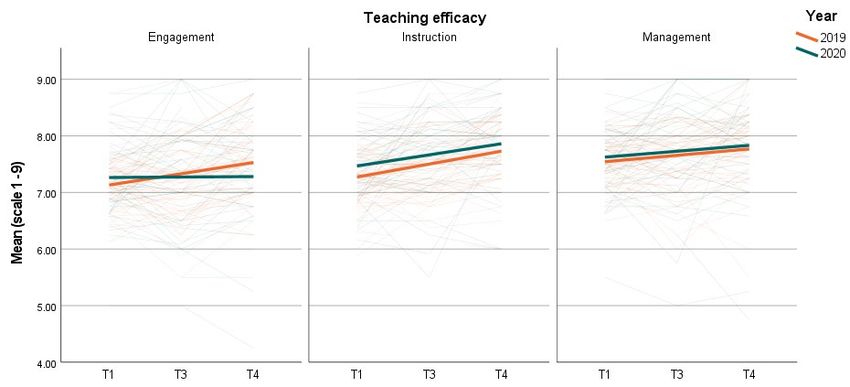
Figure 12 Year 4 Quality of school life and school learning culture (2019-2020) ............................................................... 51
Figure 13 Whole sample Quality of school life and school learning culture (2019-2020) .................................................. 53
Figure 14 Teacher efficacy (2019-2020) ............................................................................................................................. 61
Figure 15 Teacher morale and appraisal (2019-2020) ........................................................................................................ 61

Evaluating the impact of COVID-19 on NSW schools iv | P a g e

Executive Summary

This report focuses on the impact of the COVID-19 pandemic on students and teachers in NSW government
primary schools. In 2020, schools in 190 systems around the globe moved to a period of learning from home due
to the pandemic. These school closures represent unprecedented disruption to teaching and learning for billions
of students. Speculation about the impact of COVID-19 and learning from home on student academic
achievement has been widespread, relying heavily on evidence from previous crisis situations. As a result, we’ve
seen school systems and governments draw on estimations based on modelling from international, short-term,
small-scale disruptions to schooling caused by dramatic events, such as natural disasters and school shootings.
However, the size and scale of disruption caused by COVID-19 is truly unprecedented and cannot be directly
compared with these earlier accounts. To date, there has been little empirical evidence of what actually
happened to student achievement during the closedown period.

Our study is one of the earliest globally to contribute important first-hand evidence by:
 1. examining the effects on students (achievement in mathematics and reading, attitudes to schooling,
 and well-being) of the COVID-19 pandemic; and
 2. investigating changes to teacher efficacy and morale during the COVID-19 pandemic.

The focus of our research was Stage 2 (Year 3 and Year 4) students and teachers, using comparable data from a
split cohort randomised controlled trial conducted in 2019 and 2020 on the effects of Quality Teaching Rounds
professional development, as part of the Building Capacity for Quality Teaching in Australian Schools project being
conducted by the Teachers and Teaching Research Centre.

The study
Data were collected in 62 NSW schools during Term 1 1 (weeks 2 – 10) and Term 4 (weeks 2 – 9) in 2019 and 51
schools during Term 1 (weeks 3 – 8) in 2020, as part of our randomised controlled trial. When COVID-19 struck,
and the intervention planned for Term 2 was no longer possible, we approached the NSW Department about
collecting the same data in Term 4 (weeks 1 – 5) 2020 in order to examine the impact of the pandemic on a range
of outcomes for students and teachers, including student learning. In June 2020, the Department agreed to fund
the study. The serendipity of timing, given Australia’s relatively successful control of the outbreak compared to
many other parts of the world, has enabled us to provide this unique data set and comprehensive set of analyses
in a timely fashion.

1
 School terms in NSW government schools are typically 10 weeks

Evaluating the impact of COVID-19 on NSW schools v|P a g e
To assess growth in student achievement, we used Progressive Achievement Tests (PATs) (ACER). PATs have been
rigorously tested and are widely used in Australian schools, and internationally, to monitor students’ skills,
understandings, and growth over time. This form of testing is one of the few validated standardised measures for
assessing student achievement in a single school year available in Australia. To address student attitudes towards
school, we employed a student survey, using items from the Quality of School Life instrument (Ainley & Bourke,
1992). Items from the Aspirations Longitudinal Study survey (Gore et al., 2015) were added to examine views on
school learning culture. In total, we gathered data from 2156 Year 3 and 4 students who participated in the study
in 2020 and 2738 Year 3 and 4 students from the control group in 2019.

We conducted preliminary analyses using all of the data (full report available on request, Gore et al., 2020).
However, to guard against cohort effects, or different starting points in student achievement, we drew on a more
robust sample of matched classes within schools (to account for in-school variance) from 2019 and 2020. That is,
we matched a subset of schools on both baseline achievement and the socio-demographic variable of school
ICSEA. Separate samples were created for Year 3 and Year 4 students given their different growth trajectories.
Mathematics and reading achievement are highly correlated in Years 3 and 4, while science achievement is much
more variable; hence, for the purpose of obtaining the closest match for baseline achievement, science was
dropped from this analysis. This process produced a total sample of 3030 students (1584 in 2019, and 1446 in
2020).

Teachers (123 in 2019, 239 in 2020) also completed surveys in Terms 1, 2, 3 and 4 in 2019 and Terms 1, 3 and 4 in
2020. The surveys included items on teacher engagement, teacher efficacy, collective morale, sense of appraisal
and recognition, and the amount of instructional time teachers devoted to each of the learning areas assessed
(mathematics and reading). In addition, a representative sample of twelve teachers and six school leaders took
part in semi-structured telephone interviews to provide contextual qualitative perspectives on their experiences
during the period of learning from home and upon students’ return to school. Participants came from a range of
locations and levels of socio-educational advantage; the interviews took place during September and October
2020.

Findings
Student achievement
Our main finding is that, on average, there were no significant differences in student achievement growth
between 2019 and 2020, as measured by PATs in mathematics or reading. Indeed, achievement growth (in
mathematics and reading) for the 2020 cohort of students was at least equivalent to that of the 2019 cohort.
Most students learned and achieved during 2020. They did not go backwards or experience learning ‘loss’.

Evaluating the impact of COVID-19 on NSW schools vi | P a g e
However, this remarkable headline result masks a more complex picture when the data were analysed by school-
level advantage (ICSEA), Year level, school location and for sub-samples of Indigenous students and those in
regional areas.

Student achievement by subgroups
When examined by Year level and ICSEA, Year 3 students in the least advantaged schools (ICSEA
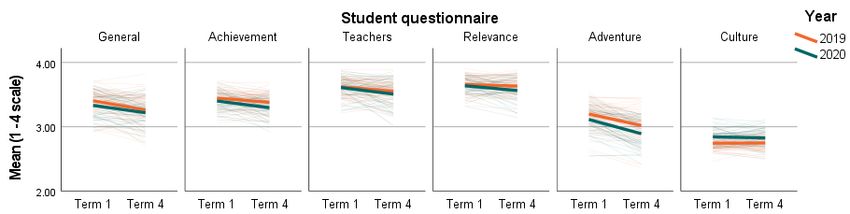
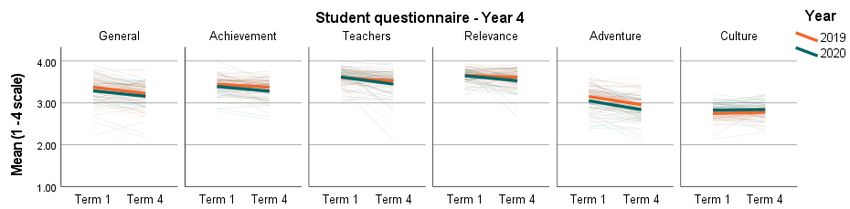
extracurricular activities because of the pandemic created additional time in the classroom, which helped
teachers support students who they felt had fallen behind in their learning.

Impact on student and teacher well-being and morale
While the disruption to schooling had minimal impact on student achievement, there were profound negative
effects on the well-being of many students and teachers.

Student well-being
Teachers and school leaders reported that during the learning from home period, student well-being was
substantially impacted by high levels of anxiety in the broader community and within households. Many teachers
shared stories of families who struggled with periods of lockdown and of how the challenges in supporting
student learning were exacerbated by stress within the family home. The need for students and parents to adapt
to new ways of teaching and learning was an additional source of anxiety, particularly for those families with
limited digital literacy and/or access to the necessary technology to support learning from home.

Upon returning to school, students displayed serious signs of stress, anxiety and frustration. Many teachers also
reported a decline in student behaviour and social interaction after the period of learning from home. The
reduced curriculum in schools, with a relatively narrow focus on literacy and numeracy, was described as
intensifying student stress, leading to fatigue, mental anguish and behavioural issues for some students.

Teacher well-being
The survey results illustrate that teachers’ morale and belief in their capacity to engage their students in learning
declined significantly over the 2020 school year – a pattern that was not evident for the 2019 teachers. The rapid
shift from schooling-as-usual to learning from home meant an exponential increase in the workloads of teachers
and school leaders. A particular challenge was the requirement to provide multiple forms of teaching, including:
synchronous and asynchronous online lesson delivery; the creation of paper-based resources to support the
needs of students and families who lacked adequate access to the internet or computers; and face-to-face
delivery for the children of essential workers.

The related increase in workload impacted substantially on teacher morale and many reported feelings of
inadequacy at not being able to deliver high quality lessons for all students. Additional stress related to student
welfare concerns. For many teachers, the inability to check in as regularly as usual with their most vulnerable
students increased their own stress and anxiety, grounded in increasing concern for student welfare. This period
of insurmountable stress and exhaustion led some teachers to consider leaving the teaching profession.

Evaluating the impact of COVID-19 on NSW schools viii | P a g e
Summary
Despite vast speculation about learning loss as a consequence of COVID-19 and the associated disruptions to
schooling, we found no significant negative effects on student achievement growth, on average. There were
important differences related to levels of disadvantage, but only for Year 3 student achievement in mathematics.
Students in the lower ICSEA schools did not achieve the same growth in 2020 as they did in 2019, while students
in the middle ICSEA band achieved greater growth in 2020. This pattern applied to Year 3 students only. In short,
students in disadvantaged schools (ICSEA >950) and younger students (Year 3) showed varying effects of COVID-
19 on their academic achievement in mathematics relative to their 2019 counterparts. Our analysis found minimal
or no differences in reading achievement, or in the achievement of Year 4 students. Similarly, there were no
significant differences in achievement growth between 2019 and 2020 for the Indigenous students in our sample.
The additional growth in reading for regional students in mid-ICSEA schools could be a function of sample size.

These results provide powerful evidence at odds with the often loud but unsubstantiated claims of ‘loss of
learning’ circulating in the Australian media and other public domain outlets.

However, the disruption to schooling and shift to new modes of teaching and learning did increase the stress felt
by students, families, teachers and school leaders. The return to school and subsequent narrowing of the
curriculum may have assisted in maintaining academic achievement levels, but might have been a factor in
students’ negative feelings about the relevance of school and in teachers’ morale and self-efficacy, especially in
terms of engaging their students.

Despite these broad trends, our data also highlight great variability among schools, families and students which is
borne out in both the qualitative and quantitative evidence in this report. There are students and teachers who
thrived and schools that soared. For a host of reasons that we explore in a discussion at the end of this report,
many others suffered. Even so, the overall result of minimal difference in student achievement growth is a
testament to the valiant efforts of teachers, leaders, and families, and the supports put in place both locally and
centrally.

Our findings offer some comfort to parents, teachers and system leaders who have rightly worried about learning
loss. They also offer a firm foundation for identifying where extra support is needed; namely, to assist student
learning in low ICSEA schools, especially among the 2020 Year 3 cohort, and to address both teacher and student
well-being. School systems elsewhere in Australia and around the world may find this report helpful in
establishing a solid empirical basis for investigating what happened to students and teachers during COVID-19, in
their own contexts.

Evaluating the impact of COVID-19 on NSW schools ix | P a g e
1 Research Background
The COVID-19 pandemic led to unprecedented disruption to schooling in more than 190 education systems
globally, impacting more than 90% of the world’s school students (Psacharopoulos et al., 2020; UNESCO, 2020a;
United Nations, 2020b). In late-March 2020, throughout Australia, parents were urged to keep their children at
home, resulting in a swift and dramatic shift from face-to-face learning to flexible and remote delivery of
education. In New South Wales government schools, ‘learning from home’ continued for two months for most
students, except for the children of essential workers who continued to attend school. Upon return to face-to-
face teaching, many schools also closed intermittently for deep cleaning after students or teachers returned
positive COVID-19 tests. In addition, extensive restrictions to usual school practices were mandated (NSW
Department of Education, 2020b), including the cancellation of school excursions, assemblies, sporting activities
and large gatherings (Australian Government Department of Health, 2020).

This widespread disruption to traditional teaching has raised concerns, globally, that student learning has been
substantially negatively impacted as teachers, school leaders and students navigated online education (Burgess &
Sievertsen, 2020; Hampshire, 2020; Joseph & Fahey, 2020). While the shift to online schooling was promoted as a
key way to support continuous learning in such crisis conditions (Baytiyeh, 2019), schools and teachers were
required to implement online learning in a matter of days, developing their knowledge and skills for teaching in
remote and flexible contexts with minimal professional development (Clinton 2020) and, arguably, at
unreasonable speed (Norman, 2020; Potts Rosevear, 2020). At the same time, students faced a range of
environmental barriers and enablers to learning. These included varying levels of parental supervision, and
differing access to the internet and devices required to sustain their learning (Burgess & Sievertsen, 2020; CIRES &
Mitchell Institute, 2020; Engzell et al., 2020). Of particular concern was how to support already vulnerable and
disadvantaged students trying to ‘learn from home’ (Gulosino & Miron, 2017).

This ‘quarantine recess’ (Hinson et al., 2007) from traditional schooling generated substantial negative
commentary about short-term and long-term effects on student outcomes and well-being, as well as the morale,
self-efficacy and skills of teachers. While some commentators argued that a significant break from schooling does
not necessarily have long term effects on student learning outcomes (Hattie, 2020), others invoked evidence that
such breaks may result in student regression in basic skills and learning (Ofsted, 2020), increased disengagement,
and higher levels of student attrition (Brown et al., 2020). Indeed, recent reports predict that this period of school
closure and shift to online learning could lead to poorer educational outcomes for almost 50% of Australian
students (Brown et al., 2020; Finkel, 2020), and not just in the short term (United Nations, 2020b).

However, to date, there remains limited robust empirical evidence about the extent to which students have been
affected by the system-wide movement to online and remote learning. This is understandable, given the recent

Evaluating the impact of COVID-19 on NSW schools 10 | P a g e
moratorium in Australia on NAPLAN – Australia’s major annual source of comparative achievement data. Other
forms of testing have been implemented, at the school and state level, but their validity and reliability have not
been established, especially when there are no directly comparable data from the start of the school year or
previous cohorts.

Empirical evidence of the actual impact of the pandemic on student learning around the world has also been
scarce, with just a handful of studies emerging in November and December 2020, none peer reviewed.
Ofsted (2020a, 2020b) reported, after visiting and talking with staff at 380 schools, that children of all ages in the
United Kingdom lost some learning and basic skills. In the United States, Dorn et al. (2020) reported that
elementary school students beginning the 2020-21 school year in the United States were starting school, on
average, three months behind in mathematics and one and a half months behind in reading compared with
earlier cohorts (Dorn et al. 2020). A study using national standardised test data collected just prior to and just
after an eight-week period of closedown in the Netherlands concluded that students lost one fifth of a year’s
learning, having made little or no progress while learning from home (Engzell et al. 2020). In Australia, modelling
by the Grattan Institute (Sonnemann and Goss 2020), predicted a learning loss of one month from a two month
period of school disruption for the most disadvantaged students. In December, the NSW Department of Education
reported results from Check-in assessments in reading and numeracy conducted in schools during the end of
Term 3 and beginning of Term 4. Over 62,000 Year 3 students (or 88% of all Year 3) from 1,439 schools
participated. Results indicated that while Year 3 students were on their expected trajectory for numeracy, they
were 3-4 months behind their expected trajectory in reading (NSW Department of Education, 2020a).

To date, estimation and speculation have been the main drivers of debate and policy, while valid inference
requires data from before and after school closedown and a relevant comparison group (Engzell et al., 2020). Our
study provides a comprehensive analysis of comparable data drawn from students in 2019 and 2020. In so doing,
we offer insights for policy and practice by demonstrating, for this cohort at least, what actually happened during
the widespread disruption to schooling-as-usual.

Rigorous empirical evidence is critical as a responsible basis for strategic action to address the effects of the
quarantine recess on students and teachers. Without such evidence, school systems globally are relying on a small
body of literature that focuses primarily on internal school and system crises such as school shootings (Thompson
et al., 2017) and environmental disasters including fires, hurricanes, earthquakes, and tornadoes. Much of this
research focuses on individual school closures (Alvarez, 2010; Convery et al., 2010; Ho et al., 2012; Trethowan &
Nursey, 2015) rather than the recent system-wide transition to online learning, an unprecedented occurrence.
While the extant literature provides an important context for understanding the effects of crises and disasters on
school leaders, teachers, students and the broader school community, it is severely limited in its capacity to

Evaluating the impact of COVID-19 on NSW schools 11 | P a g e
inform schools and school systems in the transition back from learning at home following a system-wide period of
school closure.

When the global impacts of the COVID-19 pandemic were beginning to become apparent, UNESCO (2020b)
released a report outlining how the pandemic could be used to improve schooling and make education systems
more inclusive; to “build back better” (para. 10). Despite this worthy manifesto, prior research on schooling
following natural or other disasters suggests that such disruptions tend to exacerbate and highlight existing
inequities rather than generate insights that repair them (Carr-Chellman et al., 2008; Ezaki, 2018). The design of
our study allows for fine-grained analysis of outcomes in relation to school-level dis/advantage. Specifically, we
draw on comparable student achievement data from the school year prior to COVID-19 to examine the effects of
this rapid system-wide change on student learning outcomes.

We did not set out to study the effects of COVID-19. Instead, we were in the middle of a randomised controlled
trial (RCT) on the effects of Quality Teaching Rounds professional development, split across 2019 and 2020
cohorts. The Australian school year starts in late January and concludes in late December, which aligns annual
student achievement testing with the calendar year – unlike in many other countries in which the school year
starts around August. Serendipitously, when COVID-19 struck, we had collected pre- and post-intervention data
for 2019 and pre-intervention data from 2020 for most schools in the second cohort. The late March closedown of
schools in NSW meant we missed out on data collection in a small number of schools. The upside was that data
collected just prior to the shutdown was comparable with data from the 2019 control group of schools.

Fortuitously, given the relatively low number of COVID-19 cases in Australia (at the time of writing 28,762 cases
and 909 deaths), schools in NSW re-opened in plenty of time for follow-up data collection which commenced in
late October and concluded in early December. Just when the worldwide crisis was worsening and schools were
still shut down or shutting down in many parts of the world, we were able to re-purpose our 2020 baseline data
and go back into schools to investigate effects of the pandemic on student learning.

Evaluating the impact of COVID-19 on NSW schools 12 | P a g e
2 Methodology
In 2019, baseline (Term 1, weeks 2 – 10) and follow-up (Term 4, weeks 2 – 9) data were collected from 62 public
schools for the Building Capacity for Quality Teaching in Australian Schools project. This group of schools formed
the control group for a randomised controlled trial (RCT) examining the effects of a form of professional
development, Quality Teaching Rounds (QTR), on student achievement (Gore et al., 2021; Miller et al., 2019). In
2020, equivalent data for a second cohort of 51 schools were collected in Term 1 (weeks 3 – 8) as a part of the
same RCT (which had to be postponed because of COVID-19) and gathered again at the end of the 2020 school
year (Term 4, weeks 1 – 5) (Table 2). In all instances, PATs and student surveys were administered by research
assistants. The analysis is anchored in these data which take the form of student achievement tests (Progressive
Achievement Tests [PATs] in mathematics, reading and science), student surveys and teacher surveys, as outlined
below. Comparison of these datasets generated important insights into the effects of COVID-19 on students and
teachers. Interviews were added for a subset of the 2020 teacher cohort to shed light on their experiences and
perceptions of what happened to and for their students.

Table 2 Data collection (2019-2020)

 Term 1 Term 2 Term 3 Term 4
 (Jan – Apr) (Apr – Jul) (Jul – Sep) (Oct – Dec)
 Teachers
 2019 Survey Survey Survey Survey
 2020 Survey Survey, Interviews Survey
 Students
 2019 Survey, PATs Survey, PATs
 2020 Survey, PATs Survey, PATs

Note. Teacher surveys were not conducted in Term 2, 2020 while ethics approval was being sought for this
project, which was funded in June 2020 (University of Newcastle HREC: H-2020-0242; SERAP: 2020241).

2.1 Sample
Students and teachers from 51 schools participated in the study during 2020. These data were compared with
data collected from 62 public schools in 2019 for the Building Capacity for Quality Teaching in Australian Schools
project. Schools that participated in 2019 were primarily located in major cities (n = 35), and regional areas (inner
regional, n = 21; outer regional, n = 5). One school was in a very remote area. A similar pattern characterised
schools that participated in 2020, with most in major cities (n = 40), and a smaller group in regional areas (inner
regional, n = 10; outer regional, n = 1). There were no schools from remote or very remote communities in the
2020 sample (Table 3).

Evaluating the impact of COVID-19 on NSW schools 13 | P a g e
Table 3 Sample characteristics (2019-2020)
Characteristics Total Year 3 Year 4
 2019 2020 2019 2020 2019 2020
Schools, n 62 51 57 44 56 48
ICSEA, mean (SD) 995 (82) 1007 (76) 987 (80) 999 (72) 991 (79) 1009 (77)
 ICSEA < 950, n (%) 19 (31) 10 (20) 19 (33) 9 (20) 18 (32) 9 (19)
 ICSEA 950 - 1049, n (%) 29 (47) 25 (49) 27 (47) 24 (55) 27 (48) 23 (48)
 ICSEA 1050+, n (%) 14 (23) 16 (31) 11 (19) 11 (25) 11 (20) 16 (33)
Rural, n (%) 27 (44) 11 (22) 27 (47) 11 (25) 24 (42) 10 (20)
 Major Cities 35 (56) 40 (78) 30 (53) 33 (75) 32 (57) 38 (79)
 Inner Regional 21 (34) 10 (20) 21 (37) 10 (23) 18 (32) 9 (19)
 Outer Regional 5 (8) 1 (2) 5 (9) 1 (2) 5 (9) 1 (2)
 Remote 0 (0) 0 (0) 0 (0) 0 (0) 0 (0) 0 (0)
 Very Remote 1 (2) 0 (0) 1 (2) 0 (0) 1 (2) 0 (0)
Students, n 2738 2156 1332 1016 1406 1140
Age – years, mean (SD) 9.7 (0.7) 9.7 (0.7) 9.2 (0.4) 9.1 (0.5) 10.1 (0.4) 10.1 (0.4)
Female, n (%) 1354 (50) 1073 (50) 657 (49) 510 (50) 697 (50) 563 (50)
Indigenous, n (%) 185 (7) 132 (6) 111 (8) 74 (7) 74 (5) 58 (5)
LBOTE, n (%) 666 (24) 522 (24) 306 (23) 248 (24) 360 (26) 274 (24)
Teachers, n 239 123
Experience – years, mean (SD) 12.0 (9.6) 10.3 (8.34)
Qualifications – Masters, % 32 (15) 16 (13)
Qualifications – Bachelor, % 164 (76) 98 (79)
Qualifications – Diploma, % 19 (8) 6 (5)

2.2 Student data

2.2.1 Progressive Achievement Tests and student surveys
Students completed Progressive Achievement Tests (PATs) in mathematics, reading and science (Australian
Council of Educational Research [ACER], 2011) in Term 1 and Term 4, 2020. Students also completed surveys
addressing attitudes to school, using items from the Quality of School Life instrument (Ainley & Bourke, 1992),
and views on school learning culture, using items from the Aspirations Longitudinal Study survey (Gore et al.,
2015). The same data were collected from students in Term 1 and Term 4, 2019.

Slightly more students completed achievement tests in 2019 (n = 2738) than in 2020 (n = 2156). The mean age of
students in both 2019 and 2020 was 9.7 years and there were equal proportions of female participants (50%) and
students from language backgrounds other than English (LBOTE) (24%) in both samples. Slightly more Indigenous
students participated in 2019 (7%) than in 2020 (6%) (Table 3). Students for whom the schools received NSW
Department of Education funding for significant identified learning difficulties were excluded from the analysis,
but not from the class activities associated with the research.

Evaluating the impact of COVID-19 on NSW schools 14 | P a g e
2.3 Teacher data

2.3.1 Teacher surveys
The teacher survey included questions on teacher efficacy (Tschannen-Moran & Hoy, 2001), collective morale and
sense of appraisal and recognition (Hart et al., 2000) and instructional time (in mathematics, reading and science).
Surveys administered at multiple time points during 2019 (Terms 1, 2, 3 and 4) were compared with surveys from
2020 (Terms 1, 3 and 4). In addition, teachers and school leaders were invited to take part in semi-structured
telephone interviews. A representative sample of those who volunteered, based on school location and ICSEA,
was selected to participate in the interviews which were conducted during September and October 2020.

There were more teachers who took part in the study in 2019 (n = 239) than in 2020 (n = 123). Their average years
of teaching experience was 12.0 years in 2019 compared with 10.3 in 2020. A slightly higher proportion of
teachers who participated in 2019 held a Master’s qualification (15%) compared to 2020 (13%). A higher
proportion of teachers in the 2020 sample held a Bachelor’s qualification (79%) compared with teachers in the
2019 sample (76%) (Table 3).

2.3.2 Teacher interviews
In order to gain a deeper understanding of the nature and effects of changes to teaching and learning caused by
the pandemic, telephone interviews were conducted during September and October 2020 with teachers (n = 12)
and school leaders (n = 6) from 13 schools. There were slightly more schools in regional areas (n = 7; inner
regional, n = 4; outer regional, n = 3) than in major cities (n = 6) (Table 4).

Table 4 Location of 2020 interview schools and participants

 Major city Inner-regional Outer-regional Total
 Schools 6 4 3 13
 Principals 3 2 1 6
 Teachers 5 4 3 12

The ICSEA of these schools ranged from just over 800 (least advantaged school) to around 1140 (most
advantaged). The percentage of students in interview schools with a language background other than English
(LBOTE) ranged from 0% (Schools 2 and 4) to more than 95% (School 5). Aboriginal and Torres Strait Islander
student enrolment ranged from 1% in School 5 to around 60% in School 1. The number of classroom teachers in
schools ranged from 3 (School 4) to 41 (School 13), and student enrolments ranged from just under 30 (School 4)
to around 750 (School 13) (Table 5).

Evaluating the impact of COVID-19 on NSW schools 15 | P a g e
Table 5 Sociodemographic characteristics of schools in interview sample
 ICSEA 2 Language Aboriginal or Number of 2019 Enrolment
 Background (%) Torres Strait teachers (2019)
 Islander
 Students (%)
 School 1 low
Classes within schools were ranked using the class level mean of the combined mathematics and reading
percentile score at baseline (rounded to the nearest integer). Classes were ranked (ascending) by ICSEA and
baseline achievement within ICSEA categories (low =
Cohen's (1988) d was used to determine effect sizes (d = (Mchange2020 – Mchange2019) / σ pooled), where
Mchange is the change in mean score for each group relative to their baseline value and σ is the pooled
unconditional standard deviation. Ninety-five per cent confidence intervals (95% CIs) of the effect size were
computed using the compute.es function (AC Del Re, 2013) in R version 3.4.4 (R Core Team, 2019). This function
computes confidence intervals using the variance in d derived by the Hedges and Olkin (1985) formula.

Given widespread concern for less advantaged students, subgroup analysis was conducted to investigate if
student outcomes differed across cohorts among ICSEA bands (low =
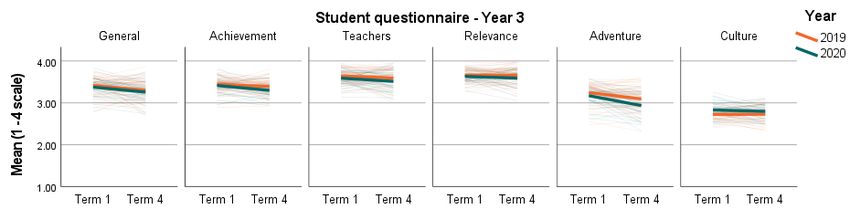
2.5.1 Student Progressive Achievement Test (PAT) tables
When viewing the PAT tables, the main columns to consider are the two on the right. Only those cells in the far-
right column with an asterisk indicate a significant difference between the 2019 and 2020 cohorts. The second
from the right column indicates the direction of the difference. Any effect size starting with a negative (e.g. -0.12)
indicates lower results for the 2020 cohort. Significant effects without a negative indicate greater growth for the
2020 cohort. Using standards adopted by the Education Endowment Foundation (EEF) (2018), effect sizes
between 0.05 and 0.09 are equivalent to one month difference in growth while effect sizes between 0.10 and
0.18 indicate two months’ difference.

2.5.2 Student Progressive Achievement Test (PAT) figures
When viewing the PAT figures, the bold coloured lines indicate the trend for each cohort, showing the change
from Term 1 to Term 4. The fine lines represent the different schools (or in some cases, students – for Indigenous
students and students in regional schools) and highlight the variability underpinning the overall trend.

Evaluating the impact of COVID-19 on NSW schools 19 | P a g e
3 Findings
3.1 Impact on student achievement
Findings are reported using linear mixed models. Instructional volume (average time per week dedicated to each
subject) is included, followed by extracts from teacher and school leader interviews detailing their perceptions of
effects on student achievement.

3.1.1 Student achievement
For the Year 3 and Year 4 cohorts overall, no differences in student achievement growth were recorded between
2019 and 2020. However, a more complex picture emerged when taking ICSEA into account. In reporting findings,
all Year 3 results are provided followed by Year 4 results. For each cohort, growth in student achievement is
reported by subject (mathematics and reading) and school ICSEA. In each instance, an overview table precedes
tables and figures with detail of the statistical analyses conducted.

3.1.1.1 Year 3 student achievement in Mathematics and Reading
A summary of Year 3 student achievement in mathematics and reading by ICSEA is displayed in Table 7. Full
details supporting these results are available in Tables 8 and 9 and Figures 1 and 2. Students in low ICSEA schools
showed two months’ less growth in 2020 and those in the mid ICSEA schools showed two months’ additional
growth.

Table 7 Year 3 student achievement in mathematics and reading (2019-2020) by ICSEA

 ICSEA Mathematics Reading
 Low - 2 months
 Mid + 2 months
 High
 Whole sample

Note. Blank cells denote no significant difference between the 2019 and 2020 cohorts

Evaluating the impact of COVID-19 on NSW schools 20 | P a g e
Key points
Mathematics
 • No significant differences between the 2019 and 2020 cohorts (Table 7, Figure 1)
 • Students in low ICSEA schools (ICESA
Table 8 Year 3 student achievement in mathematics and reading (2019-2020)
Outcome n Baseline Ceiling Retest n (miss) Mean change from Adjusted mean Adjusted effect size d P
 mean (95% CI) n (%) % baseline (95% CI) difference (95% CI)a (95% CI)a
Year 3
Mathematics
2020 670 39.68 (36.4, 42.97) 0 (0) 91 608 (62) 17.20* (15.84, 18.56) 1.65 (-0.21, 3.52) 0.06 (-0.01, 0.13) 0.082
2019 757 40.23 (37.02, 43.44) 5 (0.6) 92 693 (64) 15.55* (14.27, 16.82) Reference Reference
Reading
2020 664 30.45 (26.94, 33.97) 3 (0.4) 91 605 (59) 22.67* (21.1, 24.24) 1.15 (-1, 3.29) 0.04 (-0.03, 0.11) 0.295
2019 765 29.26 (25.84, 32.68) 0 (0) 91 698 (67) 21.52* (20.06, 22.98) Reference Reference
Note. CI = Confidence Interval. Significance at p < 0.05.

Evaluating the impact of COVID-19 on NSW schools 22 | P a g e
Figure 1 Year 3 student achievement in mathematics and reading (2019-2020)

Evaluating the impact of COVID-19 on NSW schools 23 | P a g e
Table 9 Year 3 student achievement in mathematics and reading (2019-2020) by ICSEA
Outcome n Baseline Ceiling Retest n (miss) Mean change from Adjusted mean Adjusted effect size d P
 mean (95% CI) n (%) % baseline (95% CI) difference (95% CI)a (95% CI)a

Year 3
Mathematics
ICSEA
Figure 2 Year 3 student achievement in mathematics and reading (2019-2020)

Evaluating the impact of COVID-19 on NSW schools 25 | P a g e
3.1.1.2 Year 4 student achievement in Mathematics and Reading
There were no differences in student achievement growth recorded between the 2019 and 2020 cohorts when
examined by the whole cohort or by school ICSEA. Full tables and figures supporting these outcomes are available
in Tables 10 and 11 and Figures 3 and 4.

 Key points
 Mathematics
 • No significant differences between the 2019 and 2020 cohorts (Table 10, Figure 3)
 • No significant differences between the 2019 and 2020 cohorts by school ICSEA (Table 11, Figure 4)
 Reading
 • No significant differences between the 2019 and 2020 cohorts (Table 10, Figure 3)
 • No significant differences between the 2019 and 2020 cohorts by school ICSEA (Table 11, Figure 4)

Evaluating the impact of COVID-19 on NSW schools 26 | P a g e
Table 10 Year 4 student achievement in mathematics and reading (2019-2020)
Outcome n Baseline Ceiling Retest n (miss) Mean change from Adjusted mean Adjusted effect size d P
 mean (95% CI) n (%) % baseline (95% CI) difference (95% CI)a (95% CI)a
Year 4
Mathematics
2020 730 43.19 (39.57, 46.82) 7 (0.9) 91 662 (68) 10.62* (9.41, 11.83) -0.15 (-1.84, 1.53) -0.01 (-0.07, 0.06) 0.857
2019 768 42.63 (39.03, 46.23) 6 (0.7) 92 706 (62) 10.78* (9.61, 11.95) Reference Reference
Reading
Year 4
2020 722 37.61 (34.01, 41.2) 2 (0.3) 89 645 (77) 10.53* (9.08, 11.98) 1.8 (-0.18, 3.79) 0.07 (-0.01, 0.14) 0.075
2019 793 38.19 (34.66, 41.71) 2 (0.2) 94 742 (51) 8.73* (7.38, 10.09) Reference Reference
Note. CI = Confidence Interval. Significance at p < 0.05.

Evaluating the impact of COVID-19 on NSW schools 27 | P a g e
.

Figure 3 Year 4 student achievement in mathematics and reading (2019-2020)

Evaluating the impact of COVID-19 on NSW schools 28 | P a g e
Table 11 Year 4 student achievement in mathematics and reading (2019-2020) by ICSEA
Outcome n Baseline Ceiling Retest n (miss) Mean change from Adjusted mean Adjusted effect size d P
 mean (95% CI) n (%) % baseline (95% CI) difference (95% CI)a (95% CI)a

Year 4
Mathematics
ICSEA
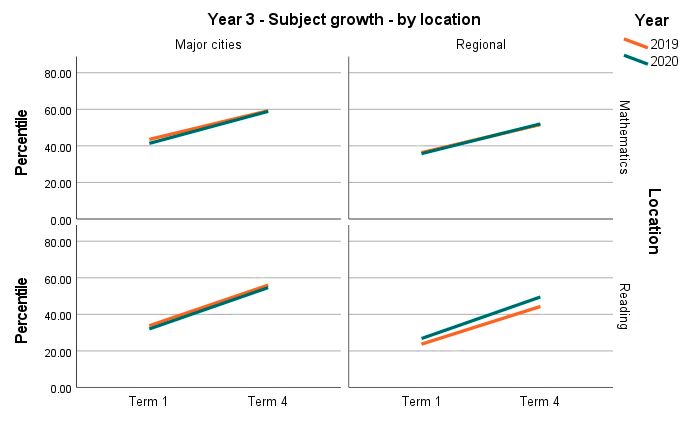
Figure 4 Year 4 student achievement in mathematics and reading (2019-2020) by ICSEA

3.1.1.3 Student achievement by location
A summary of achievement growth in mathematics and reading for students in regional locations and major
cities 4 is displayed in Table 12. Students in major cities demonstrated one-month’s additional growth (d = 0.08;
95% CI = 0.00, 0.17; p = 0.047) in reading (Table 13, Figures 5 and 6). There were no significant differences in
mathematics (Table 13, Figures 5 and 6). Due to the relatively small samples used in this analysis, and the fact that
‘regional’ was defined as outside major cities, these results should be interpreted with caution.

Table 12 Student achievement by subject and location (2019-2020)

 Year Location Mathematics Reading

 3 Major cities

 Regional

 4 Major cities + 1 month

 Regional
Note. Blank cells denote no significant difference between the 2019 and 2020 cohorts

4
 School location was classified using the Australian Statistical Geography Standard (ASGS) Remoteness Structure
(2020).

Evaluating the impact of COVID-19 on NSW schools 30 | P a g e
Key points
 Reading
 • No significant differences between the 2019 and 2020 cohorts, Year 3 students (Table 13, Figure 5)
 • Year 4 students in major cities showed one month more growth in 2020 than the equivalent 2019
 cohort (d = 0.08; 95% CI = 0.00, 0.17; p = 0.047) 5 (Table 13, Figure 6)
 Mathematics
 • No significant differences between the 2019 and 2020 cohorts, Year 3 students (Table 13, Figure 5)
 • No significant differences between the 2019 and 2020 cohorts, Year 4 students (Table 13, Figure 6)

5
 While this result is significant using a traditional p value of
Table 13 Year 3 and 4 student achievement in mathematics and reading (2019-2020) by location
 Outcome n Baseline Ceiling Retest n (miss) Mean change from Adjusted mean Adjusted effect P
 mean (95% CI) a n (%) % baseline (95% CI) a difference (95% CI) a size d (95% CI) a
 Year 3
 Mathematics
 Major cities
 2020 481 58.90 (55.06, 62.74) 0 (0) 93 447 (34) 17.53* (15.9, 19.16) 1.86 (-0.52, 4.24) 0.07 (-0.02, 0.15) 0.125
 2019 431 59.22 (54.97, 63.47) 4 (0.9) 92 395 (36) 15.67* (13.94, 17.4) Reference Reference
 Regional
 2020 189 35.77 (30.05, 41.48) 0 (0) 85 161 (28) 16.27* (13.74, 18.79) 0.87 (-2.26, 4.01) 0.03 (-0.09, 0.16) 0.585
 2019 326 36.31 (31.76, 40.86) 1 (0.3) 91 298 (28) 15.39* (13.53, 17.25) Reference Reference
 Reading
 Major cities
 2020 484 32.04 (27.82, 36.26) 2 (0.4) 94 454 (30) 22.63* (20.79, 24.47) 0.43 (-2.25, 3.11) 0.01 (-0.07, 0.10) 0.753
 2019 438 33.81 (29.15, 38.47) 0 (0) 92 405 (33) 22.20* (20.26, 24.15) Reference Reference
 Regional
 2020 180 26.80 (21.40, 32.21) 1 (0.5) 84 151 (29) 22.73* (19.68, 25.78) 2.14 (-1.63, 5.90) 0.08 (-0.06, 0.21) 0.265
 2019 327 23.74 (19.52, 27.95) 0 (0) 90 293 (34) 20.59* (18.39, 22.80) Reference Reference
 Year 4
 Mathematics
 Major cities
 2020 626 45.55 (41.61, 49.48) 7 (1.1) 91 568 (58) 10.48* (9.17, 11.79) -0.36 (-2.26, 1.54) -0.01 (-0.09, 0.06) 0.710
 2019 548 46.31 (41.89, 50.74) 6 (1.1) 93 511 (37) 10.84* (9.46, 12.22) Reference Reference
 Regional
 2020 104 33.19 (26.36, 40.02) 0 (0) 90 94 (10) 11.50* (8.30, 14.71) 0.90 (-3.00, 4.80) 0.04 (-0.12, 0.20) 0.649
 2019 220 36.64 (31.76, 41.52) 0 (0) 89 195 (25) 10.60* (8.38, 12.82) Reference Reference
 Reading
 Major cities
 2020 621 39.41 (35.44, 43.38) 2 (0.3) 89 554 (67) 11.10* (9.51, 12.7) 2.32 (0.03, 4.61) 0.08 (0.00, 0.17) 0.047*
 2019 559 42.17 (37.72, 46.61) 2 (0.4) 94 524 (35) 8.78* (7.14, 10.43) Reference Reference
 Regional
 2020 101 30.72 (24.15, 37.28) 0 (0) 90 91 (10) 7.17* (3.58, 10.76) -1.46 (-5.73, 2.81) -0.06 (-0.22, 0.11) 0.502
 2019 234 31.89 (27.40, 36.38) 0 (0) 93 218 (16) 8.63* (6.31, 10.95) Reference Reference
Note. CI = Confidence Interval. Significance at p < 0.05.

Evaluating the impact of COVID-19 on NSW schools 32 | P a g e
Figure 5 Year 3 student achievement in mathematics and reading (2019-2020) by location

Figure 6 Year 4 Student achievement in mathematics and reading (2019-2020) by location

3.1.1.4 Regional student achievement by ICSEA
A summary of achievement growth in mathematics and reading for students in regional locations by ICSEA is
displayed in Table 14. Year 3 students in mid-ICSEA schools demonstrated three months’ additional growth (d =
0.20; 95% CI = 0.02, 0.38; p = 0.033) in reading (Table 15, Figure 7). There were no significant differences in

Evaluating the impact of COVID-19 on NSW schools 33 | P a g e
mathematics (Table 15, Figures 7 and 8). It should be noted that while there were no significant differences (p <
0.05) at baseline between year groups when evaluated by ICSEA grouping, school location was not included in the
matching procedure. This explains the slight differences observed at baseline for the regional cohorts.

Table 14 Year 3 and 4 regional student achievement in mathematics and reading (2019-2020) by ICSEA

 Year ICSEA Mathematics Reading

 3 Low

 Mid + 3 months

 4 Low

 Mid

Note. Blank cells denote no significant difference between the 2019 and 2020 cohorts. There were no high ICSEA
schools in regional areas in the matched sample.

 Key points
 Reading
 • Year 3 students in mid-ICSEA schools (950-1050) showed three months’ additional growth in 2020
 than the equivalent 2019 cohort (d = 0.20; 95% CI = 0.02, 0.38; p = 0.033) 6 (Table 15, Figure 7)
 • No significant differences between the 2019 and 2020 cohorts, Year 4 students (Table 15, Figure 8)
 Mathematics
 • No significant differences between the 2019 and 2020 cohorts, Year 3 students (Table 15, Figure 7)
 • No significant differences between the 2019 and 2020 cohorts, Year 4 students (Table 15, Figure 8)

6
 While this result is significant using a traditional p value of
Table 15 Year 3 and 4 regional student achievement in mathematics and reading (2019-2020) by ICSEA
Outcome n Baseline Ceiling Retest n (miss) Mean change from Adjusted mean Adjusted effect P
 mean (95% CI) a n (%) % baseline (95% CI) a difference (95% CI) a size d (95% CI) a
Year 3 - Regional by ICSEA
Mathematics
Figure 7 Year 3 regional student achievement in mathematics and reading (2019-2020) by ICSEA

Figure 8 Year 4 regional student achievement in mathematics and reading (2019-2020) by ICSEA

Evaluating the impact of COVID-19 on NSW schools 36 | P a g e
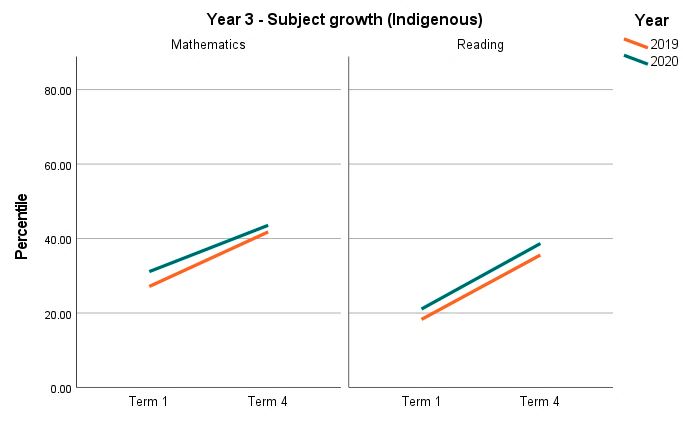
3.1.1.5 Indigenous student achievement
For the Indigenous students in the sample, no differences in achievement growth were recorded between the
2019 and 2020 cohorts, by subject (Table 16, Figures 9 and 10). Due to the relatively small samples used in this
analysis we were unable to analyse Indigenous student achievement by school ICSEA. For this reason, these
results should be interpreted with caution.

 Key points
 Reading
 • No significant differences between the 2019 and 2020 cohorts, Year 3 students (Table 16, Figure 9)
 • No significant differences between the 2019 and 2020 cohorts, Year 4 students (Table 16, Figure 10)
 Mathematics
 • No significant differences between the 2019 and 2020 cohorts, Year 3 students (Table 16, Figure 9)
 • No significant differences between the 2019 and 2020 cohorts, Year 4 students (Table 16, Figure 10)

Evaluating the impact of COVID-19 on NSW schools 37 | P a g e
Table 16 Indigenous student achievement in mathematics and reading (2019-2020)
Outcome n Baseline Ceiling Retest n (miss) Mean change from Adjusted mean Adjusted effect size d P
 mean (95% CI) n (%) % baseline (95% CI) difference (95% CI)a (95% CI)a
Year 3
Indigenous
Mathematics
2020 58 31.13 (23.97, 38.30) 0 (0) 78 45 (13) 12.43* (7.39, 17.47) -2.21 (-8.88, 4.45) -0.09 (-0.36, 0.18) 0.512
2019 69 27.14 (20.47, 33.82) 0 (0) 88 61 (8) 14.65* (10.28, 19.01) Reference Reference
Reading
2020 59 38.67 (31.73, 45.60) 0 (0) 78 46 (13) 17.58* (12.16, 23.01) 0.28 (-6.92, 7.47) 0.01 (-0.28, 0.31) 0.939
2019 69 35.59 (29.30, 41.88) 0 (0) 90 62 (7) 17.30* (12.58, 22.03) Reference Reference
Year 4
Indigenous
Mathematics
2020 37 28.69 (19.93, 37.44) 0 (0) 81 30 (7) 15.32* (10.96, 19.69) 1.65 (-4.77, 8.06) 0.07 (-0.20, 0.33) 0.610
2019 30 29.42 (20.20, 38.65) 0 (0) 87 26 (4) 13.68* (8.98, 18.38) Reference Reference
Reading
2020 36 39.77 (31.80, 47.74) 0 (0) 81 29 (7) 14.05* (8.50, 19.60) 4.80 (-3.21, 12.81) 0.20 (-0.13, 0.53) 0.235
2019 31 36.44 (27.99, 44.90) 0 (0) 87 27 (4) 9.25* (3.48, 15.02) Reference Reference
Note. CI = Confidence Interval. Significance at p < 0.05.

Evaluating the impact of COVID-19 on NSW schools 38 | P a g e
You can also read