Evaluating the Efficiency of some Wastewater Treatment Plants in Najaf Governorate
←
→
Page content transcription
If your browser does not render page correctly, please read the page content below

IOP Conference Series: Materials Science and Engineering

PAPER • OPEN ACCESS

Evaluating the Efficiency of some Wastewater Treatment Plants in Najaf
Governorate
To cite this article: Rana Hassan Naji et al 2021 IOP Conf. Ser.: Mater. Sci. Eng. 1145 012053

View the article online for updates and enhancements.

                               This content was downloaded from IP address 46.4.80.155 on 27/09/2021 at 00:20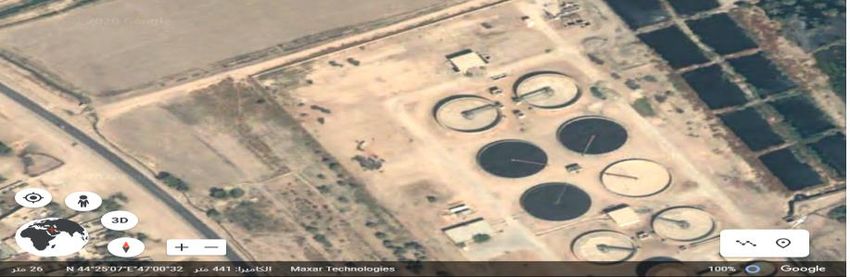
ICCMES 2021                                                                                                              IOP Publishing
 IOP Conf. Series: Materials Science and Engineering              1145 (2021) 012053           doi:10.1088/1757-899X/1145/1/012053

Evaluating the fficiency of some astewater reatment lants
in Najaf Governorate
                     Rana Hassan Naji1, Basim H. Khudair Al-Obaidi2, Mohammed Sadeq Salman3
                     1
                      M.Sc. student College of Engineering-University of Baghdad, Baghdad, Iraq.
                     2
                      Assistant Professor in college of Engineering-University of Baghdad, Baghdad, Iraq.
                     3
                      Assistant Professor in College of Environmental Engineering of Baghdad, Baghdad, Iraq
                     r.naji1901m@coeng.uobaghdad.edu.iq

                     Abstract. Although there are many wastewater treatment plants, we still suffer from many
                     problems resulting from a lack of experience or technical operating problems. In this research, the
                     service's efficiency is evaluated according to the design laws required for small factories in the
                     province of Najaf, which works with filtering technology through point filtration, the old project in
                     the Al-Baraka plant, and the second works. Within the biological treatment mbbr + activated
                     sludge, which is a biomass technology where samples were taken from both plants and annual
                     values of the pollutant rate after treatment in the old Al-Baraka plant project COD 64 mg /L and the
                     demand for biochemical oxygen (79) mg /L, the total suspended matter TSS 60 mg / L, PO4
                     phosphate 2.67 mg / L, NH3 11.46 mg / L, while Turbo 4 BIO results were as follows: 15 mg / L
                     and 28, 83 mg / L, 2.6 mg / L and 6.173 mg / L each who are they. BOD, COD, TSS, PO4, and
                     NH3 respectively, the results were the removal efficiency of the old brake project as follows: BOD
                     78%, COD 60%, TSS 60, PO4 63% compared to the Bio- Shaft project, the removal is done as
                     follows: BOD8 9%, TSS, COD 60% PO4 60%, NH3 53%. Through the previous results, we
                     conclude that the outputs of both stations are within the standards and permissible limits of the
                     Iraqi specifications, but the Turbo 4Bio plant showed higher efficiency in terms of removal, and the
                     reason may be that the old project needs periodic maintenance

                     Keywords: Station performance evaluation, Mbbr, trickling flitter

1. Introduction
The increasing rate of urban and industrial population growth that our planet has faced over the past 100
years has resulted in a remarkable increase in environmental pollution that has negatively affected the
quality of water, air, and soil. In this context, wastewater treatment has become one of the most important
environmental issues as long as it reduces natural water sources' pollution only [1,2]. The results of water
quality analysis refer to sanitation and groundwater networks with sewage and industrial water; However,
many cities and towns are healthy. There is still a great shortage in the number of treatment plants and the
lack of performance, operation, and optimal investment for existing projects. These are among the most
prominent challenges and problems faced by the sector. Sanitation in Iraq [3] The efficiency of the

               Content from this work may be used under the terms of the Creative Commons Attribution 3.0 licence. Any further distribution
               of this work must maintain attribution to the author(s) and the title of the work, journal citation and DOI.
 Published under licence by IOP Publishing Ltd                          1
ICCMES 2021 IOP Publishing
IOP Conf. Series: Materials Science and Engineering 1145 (2021) 012053 doi:10.1088/1757-899X/1145/1/012053
wastewater treatment plant is closely related to the efficiency of the treatment units, evidenced by the
specifications of the water subjected to treatment in these units, hence the importance of the monitoring
process [4].
Secondary treatment is carried out with biological membranes using natural ventilation of biological filters
(intermittent filters). While the biological filters are in operation, the bacteria on the heavy water
contaminants remain fixed in the filter package. It will likely cause air to flow to the fillings. This
phenomenon appears in the filter layers, and this phenomenon is called (exfoliation). Note, the effect of
hypoxia is usually due a few hours before this happens, with no losses in biological cells, while bacterial
growth produces the largest number of bacteria, the fastest, and the droppers (food). Real estate bacterial
biomass by vibration, either as agglomerates or sludge after sedimentation tank. The original filters do not
clean well and have a high reception from the primary tank, mould dimensions in sedimentation, and
removal effectiveness (BOD). And they are obtaining a result of pneumatic causes, which may lead to
problems related to the performance of the filter and the service life of high-ranking filters if good
humidification is a sign of the sufficient flow rate that passes through the filter housing. The filter gaskets
require an ideal wetting rate (1.2 - 1.6 m3 / m2) for the flat area of the filter per hour, and the initial design
to maintain this required ratio is a continuous circulation system that uses two rotating pumps.
The wastewater treatment plant project was implemented in (2011) by the Lebanese company (F&B) and
through the American treatment system (BIOSHAFT TURBO REACTOR). It was commissioned in
(2014) by the company, and the Sanitation Directorate operated the Najaf project. 2015) includes physical
and biological treatment as well as final sedimentation and sterilization processes. The plant's highest
design flow rate is (50,000 m3 / day), and the final flow characteristics are 10 mg / L of BOD, 10 mg / L
of TSS, and 40 mg / L of (COD). The wastewater is first pumped to the primary treatment (physical
treatment) via a conveyor line connected to the main pumping station of the project, which receives water
from the pumping stations located in the neighbourhoods of Kufa connected to the network and the
conveyor. Lines of the city of Kufa. Primary treatment is done by screening heavy water (wastewater) to
remove large objects and suspended metals that may cause a breakdown of the rotating equipment. Sand
and oils are removed by equipment and sinks to remove sand and oils. The sifted water enters the two-
trough aeration basins. The suspended bacterial agglomeration grows to analyze and process organic
matter (BOD), (COD), ammonia, and phosphates. Then, the water is conveyed to the bio shaft ponds to be
further treated, and the treated water is transported to the final sedimentation ponds. So that the sludge is
deposited and returned to the aeration basin fully and continuously, and the treated water is conveyed to
the chlorine mixing channel, then it is left in the river via the transmission line, with a diameter of 1 meter
and a length of 600 meters of its advantage for an elegantly simple BioShaft system. Less than (1) one
kilogram per kilogram of BOD is required compared to a minimum (2.5) kilograms of oxygen required for
conventional systems. The Bio-Shaft system nearly eliminates the production of sludge and uses minimal
electromechanical components among its applications. Bio-Shaft USA 41571 Corning Place # 106 Morita,
California 92562, USA [5]. Herein lies the importance of this research in finding the two plants' treatment
efficiency by conducting laboratory measurements and analySIS for several indicators: COD, BOD, TSS,
PO4, NH3, and evaluating the final flow quality according to the Iraqi standard design specifications.
2. Materials and Methods
2.1 Case Study discerption: Al-Barakia area, which contains two wastewater treatment plants, is located
in Najaf, southeast of Kufa Governorate, on the Euphrates River (Shatt al-Kufa) on the coordinates (N 44
25 11, 40 00 32) "in Form No. 1 to (Palmer, 2004) which Located 175 km south of Baghdad, the first
station of the old Al-Barakia project serves an area of 50 thousand square meters represented in the
2ICCMES 2021 IOP Publishing
IOP Conf. Series: Materials Science and Engineering 1145 (2021) 012053 doi:10.1088/1757-899X/1145/1/012053
districts of Kufa, Maysan, Saad, and Wafa July 17 Canada, the university and other neighbourhoods of
Najaf, where the old project works with a flow of 28 thousand cubic meters per day. The Bio Shift project
for heavy water treatment in Kufa serves 100% of the population. [6-10] The water treatment project in
Kufa is designed to receive 200,000 inhabitants, and the final runoff characteristics are 10 mg / L of BOD,
10 mg / L of (TSS), and 40 mg / L of (COD). Sewage treatment plant project The project was
implemented in (2011) by the Lebanese company (F&B), a second by the American System for Treatment
(BIOSHAFT TURBO REACTOR)) and it was commissioned in (2014) by the company and the Sewerage
Directorate In Najaf operated the project. 2015) includes physical and biological treatment as well as final
sedimentation and sterilization processes in figure 1. The highest design flow rate for the station (50,000
m3 / day).
Figure 1. Albarakia WWTP within Najaf map.
The Old Al Braqia Project: The factory is a diagonal filter that serves about 140,000 people with a
design capacity of 28,000 m3 / day and consists of the following facilities as shown in Figure 2, which is
located after the main gate where there are two channels, each of which contains two types of rough and
soft screens that are designed to prevent the entry of particles To the following parts of the plant to prevent
damage and blockage. The next unit is the gravel chamber used to remove sand and gravel from the
wastewater by gravity. Its purpose is to protect the later parts from clogging and reduce the load on
sedimentation basins.
inflow
outflow
prima tricklin secon
screen Grit
ry g dery cl
chmber
Figure 2. plan of trickling filter plant
Primary sedimentation tanks (PST) represent the pretreatment stage. In these units, the sludge is
precipitated, separated from the wastewater, and then drawn from these ponds to other treatment units.
The pool water treatment plant contains two rotating hydraulic maximum PST stations. The loading is
45m3 / m2 today, and each tank is 31.6m in diameter, and the first secondary treatment unit is a biological
drip filter (TF). It represents the most important part of the plant. It is responsible for removing dissolved
organic matter by microorganisms that form biofilm on the packing material surfaces in TF. There 4
treatment units assembled in the Barqa water treatment plant with a maximum organic load of 1 kg BOD /
3ICCMES 2021 IOP Publishing
IOP Conf. Series: Materials Science and Engineering 1145 (2021) 012053 doi:10.1088/1757-899X/1145/1/012053
m3, and the area of each filter is 908 m 2. [11] The next unit of secondary treatment is a secondary
sedimentation tank (SST). In this unit, activated sludge from biofilm formation settles in the sediments.
Activated sludge is returned to primary sedimentation basins to increase removal efficiency. The factory
contains 2 muddy glasses of water, each with a diameter of 31.6m. Also, the plant contains a chlorination
unit as well as a processing line for the resulting sludge.
Bio-shaft station: The bio-shaft is designed to accommodate and treat wastewater of approximately
50,000 m3 / day, as shown in Figure 2. Filters represent the first treatment unit in the plant: Two types of
screens: coarse and fine, are intended to protect other parts of the plant from floating particles and large
particles. These screens are cleaned manually and automatically. There is a 19 * 6 * 4 rectangular tank,
which is a particle oil removal unit. This plant's biological treatment unit is the aeration tank, whose
dimensions are (84.5 * 21.6 * 5.7). It includes a blower to pump air into the tank to provide the oxygen
that the microorganisms need to complete the treatment and provide the appropriate process. The mixing
process inside the aeration tank comes after the second stage of biological treatment inside a turbo 4 Bio,
consisting of 16 basins after one (5 * 5 * 7) m3 inside four cylindrical edges with a diameter of 2.4 m and
a height of 6 m. Thus, separating the sludge from the liquid in Secondary sedimentation of the tank, in
which the filtration process is carried out using the principle of gravity, and the rectangle has dimensions
of one (10.8 * 8 * 7.625) meters. All sludge is returned to the aeration tank to increase processing
efficiency in figure 3
Figure 3. plane Bio-Shaft Station
2.2 Data collection
The data used in this research were obtained from the Sanitation Project's field laboratory in Najaf,
Administration / Ministry of Municipalities and Public Works of Iraq. It includes monthly exams for two
years from 2018 to 2020 and was working within the standard specifications from December 2018 to
December 2020. The Excel program was used for data analysis.
3. Bio -shift concept
contains plastic media. It is a suitable environment for aerobic bacteria growth, as the bio-basin contains
inside a tube made of iron material, where the wastewater returning from the aeration basins from the top
enters the saccharin fraction inside the container. The accompanying bacteria can grow and form a
homogeneous saturated biomass layer, acting as an enzyme plant for digesting sludge in a conventional
but more compact equilibrium tank, where 98% of the suspended growth is removed, by system unique
design features with the self-cleaning capability of T4b-Turbo Reactor. The design of the turbine reactor
and the T4b bio-carrier makes the biosphere of air develop and go deep into the media, and the non-
oxidative bio-films grow. It allows a group of heterocyclic microbes to remove organic matter and
nitrogen. Nitrification occurs by the autotrophic bacteria in the layer attached to the tank wall and
gentrification by the heterotrophic bacteria on the oxygen layer simultaneously. MBBR, IFAS or HYBAS,
4ICCMES 2021 IOP Publishing
IOP Conf. Series: Materials Science and Engineering 1145 (2021) 012053 doi:10.1088/1757-899X/1145/1/012053
RBBR IFAS, and MBBR processes use the same proven bio-film conveyor technology used in all MBBR
systems, but the conventional activated sludge process. This mixture is known as IFAS static sludge, or
HYBAS activated sludge, maintains a mixed liquid suspension on the top Of MLSS solids from single-
pass MBBR processes and improved municipal wastewater treatment facilities, and the result is a hybrid
process of activated sludge and membrane conveyor technology. Bio-degradation, which achieves a
biodegradation performance not comparable to conventional activated sludge systems of similar size, and
MLSS equivalent MBBR 6000 to 10,000 mg / l, so the MBBR process is half or one-third of the activated
sludge containing the yield RBBR is the yield biomass reactor where The established growth process,
which is only 100%, is non-sludge. Instead, it is due to aeration tanks. The output is zero because the FT
bio-system is better than the hybrid CAS used in the all-around competition, including MBR and MBBR,
such as energy-saving, odour, and sludge.
The equations for making those calculation areas flowing:
1)BOD loading rate =Q*So*8.34*453.59 …………………. (1)
Q is the wastewater flow rate MBBR rector in MGD
So: is BOD concentration is that in effluent flow mg/L
BOD loading rate is in g/day
2)require surf. area =BOD loading rate is g/day ………………(2)
SALE: is the design surface area loading rate in g/m²/day the calculated required carrier surface area
will be in m²
3) required carrier volume = required carrier surf. Area/carrier-specific required carrier
surface area (3)
Carrier specific area is in m²/m³ the calculated required carrier volume will be in m³
4)required tank volume = required carrier volume /carrier fill%.........................(4)
where: required tank volume will be in the same units as required carrier volume
5) liquid volume in tank = required tank volume – [required carrier volume(1 – carrier % void
space)]…………………………………………..(5)
Where: all three volumes will be in the same units. Note that volumes calculated in m³ can be
converted to ft3 by multiplying by 3.28083 ft3/m3. Although hydraulic retention time (HRT) is not
typically used as a primary design parameter for MBBR reactors, it can be calculated at the design
wastewater flow rate if the tank's liquid volume is known. Also, if a design peak hour factor is
specified, then the HRT at peak hourly flow can be calculated. The equations for calculating HRT are
as follows:
Ave. HRTdes ave = liquid vol. in the tank*7.48)/[Q*106/(24*60)]…………..(6)
where: liquid vol. in the tank is in ft3 Q is in MGD 7.48, the conversion factor for ft3 to gal 106 is the
conversion factor for MG to gal 24*60 is the conversion factor for days to min Ave. HRTdes ave will
be in min
2. Ave. HRTpeak hr = Ave. HRTdes ave/Peak Hour Factor …………………………(7)
where: Ave. HRT peak hr will also be in min[12]
4. Results and Discussion
4.1. Raw Sewage Assessment: The characteristics of the raw wastewater affecting the two plants are the
5ICCMES 2021 IOP Publishing
IOP Conf. Series: Materials Science and Engineering 1145 (2021) 012053 doi:10.1088/1757-899X/1145/1/012053
same as the wastewater effluent properties stored in the main pumping station. The BOD entering the
baraka station is stable and variable except in a few percentages. The highest value is in April 2019 (200
mg/litre), while the highest value for COD, according to Figure (3) 475 mg/litre in October 2019, in
addition to TSS, The highest value in 2019 was 424mg. / L and this indicates that in 2019 there was a
higher organic load than in 2018. If we look at the Figure 4 of the bio-shaft plant, we also note the values
of the concentrations in general during the two years. They differ only in small proportions, and the
highest BOD value in October In 2019, which is 190mg / L in 2019, while the highest COD value was 320
mg / L and the lowest value is 120mg / L in September 2018, we conclude from the above that the year
2019 is subjected to organic loading at high concentrations and higher than previous years due to tourism
or commercial conditions. It is no secret that the city of Najaf is a tourist city, and many visitors come to
it, and all this increases the organic loading of the concentrations that enter the station.
1200
1000
800
600
400
200
0
October
October
July
August
November
November
January
December
December
February
February
May
September
April
May
September
June
March
March
BOD COD TSS SO4 PO4 NH3 PH
Figure 4. The influential variation of pollutant concentrations with the years 2018-2019 of Al Barakia
Station
1500
1000
500
0
BOD COD TSS SO4 PO4 NH3 PH
Figure 5. The influential variation of pollutant concentrations with the years 2018-2019 of Bio-shaft
Station
The BOD / COD ratio is one of the important indicators. It means the ability to biodegrade and healthily
complete the biological process and get rid of pollutants, where if the ratio is between 0.5-0.8, it is good.
6ICCMES 2021 IOP Publishing
IOP Conf. Series: Materials Science and Engineering 1145 (2021) 012053 doi:10.1088/1757-899X/1145/1/012053
The possibility of decomposition is within normal conditions. The process under special conditions such
as high temperature, where the treatment output is ineffective, notice that the ratio appeared to us in the
Brakia station is 0.41. This value falls in the range of 0.3 - 0.8, as mentioned in Metcalf M and Eddy,
2014). This value is lower than compared to the effective BOD / COD ratio verified by (Al-Sulaiman W.
Khudair, 2018), which was 0.49. The maximum value was 0.5, which is the minimum of 0.32, and this
difference may be related to the characteristics of the wastewater and the amount of the organic
degradable. The ratio in the bio-shaft station, 0.63, meaning it is between 0.5-0.8, biodegradation will
occur easily. It was found that household wastewater usually contains a BOD / COD ratio between 0.4 and
0.8. In this study, the ratio was BOD / COD. The crude effect is about 0.46, which indicates a large
amount of organic matter subjected to biodegradation. The average percentage during the year was 0.63
and it is considered strong decomposition, and there is no toxicity the biological process is good.
4.. Assessment for Effluent COD: In the Figure, the values of the concentrations after treatment in the
Barakia station were within constant rates, and there is no fluctuation, and this indicates a stable
performance of the plant except for the concentration of SO4, which appeared with high values, as the
highest BOD value was 52.5 mg / L in December 2019 and the lowest value was 18.75 mg / L In 2019 the
highest COD value was 180 mg / L in September 2019, while the TSS value was at constant rates, with
the highest value in 2018 being March 148 mg / L. These results are generally good and within the
permissible limits, and if we look at the Figure (5) in which the results of the Bio Shaft plant appeared, the
highest BOD value was 35 mg / L in 2018 in September, and the lowest value was 15 mg / L in several
months. The Bio-Shaft plant results showed lower results than the results of the Al Baraqia plant after
treatment, which means that the efficiency was better. The possibility of reaching the lowest values of
pollutants and obtaining a very good treatment and the highest COD value was also in September 2019, of
194 mg / l, we can conclude From the above results. In September, the values were high.
1000
800
600
400
200
0
BOD COD TSS SO4 PO4 NH3 PH
Figure 6. The effluential variation of pollutant concentrations with the years 2018-2019 of Al Barakia
Station
7ICCMES 2021 IOP Publishing
IOP Conf. Series: Materials Science and Engineering 1145 (2021) 012053 doi:10.1088/1757-899X/1145/1/012053
1400
bod uot
1200
COD OUT 1000
TSS out 800
600
S04 out 400
PO4 OUT 200
0
NH3 OUT
October
July
October
August
November
November
June
Jan-19
December
December
February
September
September
May
May
April
March
ph out
Figure 7. The effluential variation of pollutant concentrations with the years 2018-2019 of Bio-shaft
Station
Removal efficiency (RE): One of the most important criteria that can be used to measure selective
bioreactors' performance in wastewater or water treatment is. There are several types of efficiency
components: BOD, COD, N, and TSS. RE is calculated using Equation 1
RF = (IN F-EFF) /INF.*100
The mean removal efficiency of 2 years for BOD, COD, and TSS was (89, 78, and 60)% for the biomass
plant, which are good results for both the brake plant. Figure 6 and 7 shows the removal efficiency of
BOD, COD, and TSS being (78,60,60)% over the years (2018-2019). The microbes then repair in the
plant, but in general, the microorganisms do not perform well due to the lack of oxygen transported in the
trickle filters (Metcalf and Eddy, 2014) where some modifications have been made to the station, such as
changing the media, adding scavengers and some other facilities with British expertise.
5. Conclusions
1) At Al-Barakia station, the results for all concentrations were within the permissible limits. The rate
was within the two-year range (41, 75,142,839, 12.3,10.3,7.3) mg / L each of BOD, COD, TSS, SO4,
PO4, NH3, PH) on Straight and the results of the bio-Shaft plant were for the concentrations after
treatment (15, 58, 89, 971, 5. 6, 8. 7.5) mg / L each of BOD, COD TSS, SO4 PO4 NH3.
2) The removal efficiency rate for BOD and COD TSS respectively was (78, 60 and 60)%, compared
with the removal efficiency rates for bio-shafts are lower. The reason is that the Al Barakia station
works under old technology and is within the age of extinction. However, its rehabilitation by
specialized companies and the organic load is high entering the plant, which is greater than the design
capacity. The bio-shaft's removal efficiency is (89, 78, 60)% for BOD, COD, and TSS, respectively.
Also, the bio-shaft technology is distinguished by being environmentally friendly as it does not
produce sludge at all.
3) The ratio of BOD / COD in the Bio-shaft plant is 0.63 because the decomposition and normalization
process is normal. The treated water does not contain toxicity, while the Al Barakia plant ratio was
0.41, and it is considered ineffective. Decomposition is slow and does not happen easily.
The authors would like to thank the Najaf Sewage Directorate and the Al-Barakia Sewage Treatment
Plant to obtain data and provide facilities to communicate with the plant manager and laboratory staff. The
8ICCMES 2021 IOP Publishing
IOP Conf. Series: Materials Science and Engineering 1145 (2021) 012053 doi:10.1088/1757-899X/1145/1/012053
authors thank the Sanitary Engineering Laboratory and Civil Engineering Department / College of
Engineering - the University of Baghdad for their valuable support in completing this work.
References
[1] ALSINA, F.X.; Gallego, A. Figo, c. Roda, I., R. Multipurpose evaluation of control alternatives
in wastewater treatment plants. Journal of Environmental Management, Vol. 91, 2010), pp.
1193-1201.
[2] Turkoman, Abd Al-Razzaq Muhammad Saeed. National Health Education Bulletin - Education
Treatment plants - Absent national strategy and a waste of money Syria (3111), April 03, 2013.
[3] The State Planning Commission - the tenth five-year plan. Drinking-Water and Sanitation
Sector - Chapter 15. Syria, p. 32.
[4] WHO Regional Office for the Eastern Mediterranean. Training lectures for water treatment
plant operators Craps. Primary Center, Recreation Environment, 332, 3114
[5] https://bioshaft.com/.
[6] Al- Saeed R. Tomaleh, N. Extended Performance Appraisal to Full-Scale Ventilation System in
Al-Bireh. Palestine, Clean Soil, Air, and Water, Volume 1 (2012), P1-7.
[7] Colmenarejo, FM; Rubio, A. Sanchez, E. VicentE, J.; Garcia, General Motors; Borga, R.
Evaluation of various municipal wastewater treatment plants technologies Las Rozas, Madrid
(Spain). Journal of Environmental Management, Volume 81, (2006), pp. 399-404.
[8] Haldorai and A. Ramu, An Intelligent-Based Wavelet Classifier for Accurate Prediction of Breast
Cancer, Intelligent Multidimensional Data and Image Processing, pp. 306–319.
[9] S, D., & H, A. (2019). AODV Route Discovery and Route Maintenance in MANETs. 2019 5th
International Conference on Advanced Computing & Communication Systems (ICACCS).
doi:10.1109/icaccs.2019.8728456
[10] H. Anandakumar and K. Umamaheswari, An Efficient Optimized Handover in Cognitive Radio
Networks using Cooperative Spectrum Sensing, Intelligent Automation & Soft Computing, pp. 1–
8, Sep. 2017. doi:10.1080/10798587.2017.1364931.
[11] Henze, M., Loosdrecht, M., and Ekama, G. (2008). Biological Wastewater Treatment; Principles,
Modelling, and Design.
[12] Harlan H. Bengtson, PhD, PE Continuing Education and Development, Inc. 9 Greyridge Farm
Court Stony Point, NY 10980
9You can also read