Evaluating Management Alternatives for Wyoming Elk Feedgrounds in Consideration of Chronic Wasting Disease
←
→
Page content transcription
If your browser does not render page correctly, please read the page content below

Prepared in cooperation with U.S. Department of Agriculture, National Park Service,
U.S. Fish and Wildlife Service, and Wyoming Game and Fish Department

Evaluating Management Alternatives for Wyoming Elk
Feedgrounds in Consideration of Chronic Wasting Disease

Open-File Report 2023–1015

U.S. Department of the Interior
U.S. Geological Survey

Evaluating Management Alternatives for
Wyoming Elk Feedgrounds in Consideration
of Chronic Wasting Disease

By Jonathan D. Cook, Paul C. Cross, Emma M. Tomaszewski, Eric K. Cole,
Evan H. Campbell Grant, James M. Wilder, Michael C. Runge

Prepared in cooperation with U.S. Department of Agriculture, National Park
Service, U.S. Fish and Wildlife Service, and Wyoming Game and Fish Department

Open-File Report 2023–1015

U.S. Department of the Interior
U.S. Geological Survey

U.S. Geological Survey, Reston, Virginia: 2023

For more information on the USGS—the Federal source for science about the Earth, its natural and living resources,
natural hazards, and the environment—visit https://www.usgs.gov or call 1–888–392–8545.
For an overview of USGS information products, including maps, imagery, and publications, visit
https://store.usgs.gov/ or contact the store at 1–888–275–8747.

Any use of trade, firm, or product names is for descriptive purposes only and does not imply endorsement by the
U.S. Government.
Although this information product, for the most part, is in the public domain, it also may contain copyrighted materials
as noted in the text. Permission to reproduce copyrighted items must be secured from the copyright owner.

Suggested citation:
Cook, J.D., Cross, P.C., Tomaszewski, E.M., Cole, E.K., Campbell Grant, E.H., Wilder, J.M., and Runge, M.C., 2023,
Evaluating management alternatives for Wyoming elk feedgrounds in consideration of chronic wasting disease:
U.S. Geological Survey Open-File Report 2023–1015, 53 p., https://doi.org/10.3133/ofr20231015.

ISSN 2331-1258 (online)
iii

Acknowledgments
J.D. Cook and P.C. Cross contributed equally to this work. We thank the Wyoming Game and
Fish Department, U.S. Fish and Wildlife Service, and National Park service for sharing data in
support of the analyses. Cirrus Ecological Solutions and BIO-WEST, Inc. assisted on economic
analyses and the structured decision-making process. Many U.S. Department of Agriculture
Forest Service employees provided their time and expertise to framing the fundamental
objectives and alternatives that we developed. Our team of expert panelists kindly provided their
time and expertise on chronic wasting disease. We thank D. Grear, P. Lukacs, M. Mceachran,
E. Merrill, N. Rayl, F. Rudolph, R. Russell, and E. Schauber for reviewing previous versions of the
document and computer code. K. Hartley, J. Hartley, and E. Watson assisted with figures and an
editorial review.
v

Contents
Acknowledgments����������������������������������������������������������������������������������������������������������������������������������������iii
1. Executive Summary�����������������������������������������������������������������������������������������������������������������������������������1
      1.1. References Cited���������������������������������������������������������������������������������������������������������������������������2
2. Introduction������������������������������������������������������������������������������������������������������������������������������������������������3
      2.1. Report Structure����������������������������������������������������������������������������������������������������������������������������6
3. Decision Framing���������������������������������������������������������������������������������������������������������������������������������������6
      3.1. Problem Statement������������������������������������������������������������������������������������������������������������������������7
      3.2. Fundamental Objectives and Performance Metrics����������������������������������������������������������������7
      3.3. Management Alternatives������������������������������������������������������������������������������������������������������������9
      3.4. Performance Metric Scaling�������������������������������������������������������������������������������������������������������9
4. Chronic Wasting Disease, Population Size, and Harvest Projections��������������������������������������������10
      4.1. Overview���������������������������������������������������������������������������������������������������������������������������������������10
      4.2. Methods����������������������������������������������������������������������������������������������������������������������������������������10
            4.2.1. Parameter Estimation������������������������������������������������������������������������������������������������������12
            4.2.2. Initial Conditions��������������������������������������������������������������������������������������������������������������14
            4.2.3. Implementation of Management Alternatives������������������������������������������������������������15
            4.2.4. Cumulative Effects�����������������������������������������������������������������������������������������������������������17
      4.3. Results�������������������������������������������������������������������������������������������������������������������������������������������17
            4.3.1. Dell Creek and Forest Park���������������������������������������������������������������������������������������������17
            4.3.2. Cumulative Effects�����������������������������������������������������������������������������������������������������������23
5. Spatio-Temporal Analysis of Elk Distributions������������������������������������������������������������������������������������26
      5.1. Overview���������������������������������������������������������������������������������������������������������������������������������������26
      5.2. Methods����������������������������������������������������������������������������������������������������������������������������������������26
            5.2.1. Habitat Selection and Use����������������������������������������������������������������������������������������������26
            5.2.2. Implementation of Management Alternatives������������������������������������������������������������27
            5.2.3. Cumulative Effects�����������������������������������������������������������������������������������������������������������28
      5.3. Results�������������������������������������������������������������������������������������������������������������������������������������������28
            5.3.1. Dell Creek and Forest Park���������������������������������������������������������������������������������������������28
            5.3.2. Cumulative Effects�����������������������������������������������������������������������������������������������������������31
      5.4. Discussion�������������������������������������������������������������������������������������������������������������������������������������31
6. Consequences������������������������������������������������������������������������������������������������������������������������������������������40
      6.1. Overview���������������������������������������������������������������������������������������������������������������������������������������40
      6.2. Results�������������������������������������������������������������������������������������������������������������������������������������������40
      6.3. Discussion�������������������������������������������������������������������������������������������������������������������������������������44
7. Conclusions and Future Directions�������������������������������������������������������������������������������������������������������44
References Cited�����������������������������������������������������������������������������������������������������������������������������������������45
Appendix 1. Additional Chronic Wasting Disease Analysis Details�������������������������������������������������50
vi
Figures
1. Maps showing supplemental elk feedgrounds in western Wyoming and
associated elk herd units used to assess winter elk density in fed and unfed
herd units, and the Hoback herd unit was incorporated into the Piney and
Upper Green River herd units in 2020 ........................................................................................4
2. Graph showing the probability density function of the time-to-death because
of chronic wasting disease in the absence of other mortality hazards, for
example, harvest and natural mortality ..................................................................................11
3. Graph showing the aggregate distributions of the mode of chronic wasting
disease transmission for fed and unfed elk population segments .....................................13
4. Aggregate distributions of the number of chronic wasting disease infections
that result from a single infectious individual, R_annual, under fed and unfed
scenarios��������������������������������������������������������������������������������������������������������������������������������������13
5. Aggregate distributions of the probability of environmental transmission in
year 20 in a completely susceptible population on native winter range and
feedgrounds under fed and unfed scenarios�������������������������������������������������������������������������13
6. One hundred simulations and the average population size of the Upper Green
River herd unit in the absence of any chronic wasting disease effects for the
emergency feeding and phaseout alternatives���������������������������������������������������������������������16
7. Elk counts and chronic wasting disease prevalence for fed elk and unfed elk in
the Upper Green River herd unit for the continued feeding alternative����������������������������18
8. Elk counts and chronic wasting disease prevalence for fed elk and unfed elk in
the Upper Green River herd unit for the no feeding alternative�����������������������������������������18
9. Elk counts and chronic wasting disease prevalence for other fed elk, unfed elk,
and the target feedground of Dell Creek in the Upper Green River herd unit for
the phaseout alternative������������������������������������������������������������������������������������������������������������19
10. Average population size and chronic wasting disease, and prevalence over
time for the four alternatives in the Afton herd unit��������������������������������������������������������������19
11. Average population size and chronic wasting disease prevalence over time for
the four alternatives in the Upper Green River herd unit�����������������������������������������������������20
12. Boxplots of the cumulative number of chronic wasting disease mortalities for
the four management alternatives in the Afton and Upper Green River herd units��������21
13. Boxplots of elk population size at year 20 for the four management alternatives
in the Afton and Upper Green River herd units����������������������������������������������������������������������21
14. Boxplots of the cumulative number of harvested elk for the four different
management alternatives in the Afton and Upper Green River herd units�����������������������22
15. Predicted cause of mortalities for females and males over time in the Upper
Green River herd unit for the feeding alternative������������������������������������������������������������������22
16. Predicted elk population sizes for different herd units for three management
alternatives that are implemented on all feedgrounds or only on Bridger-Teton
National Forest����������������������������������������������������������������������������������������������������������������������������23
17. Chronic wasting disease prevalence for different herd units assuming
all feedgrounds are fed, none of the feedgrounds are operational, or all
feedgrounds are phased out�����������������������������������������������������������������������������������������������������24
18. Boxplots of chronic wasting disease mortalities by year 20 for the no feeding,
continued feeding, and phaseout alternative across five Wyoming herd units��������������24
19. Boxplots of the simulated cumulative number of harvested elk by year 20
for the no feeding, continued feeding, and phaseout alternatives across five
Wyoming herd units�������������������������������������������������������������������������������������������������������������������25vii
20. Boxplots of the simulated population size in year 20 for the no feeding,
continued feeding, and phaseout alternatives across five Wyoming herd units������������26
21. Predicted monthly per capita elk use for elk that use native winter ranges
(unfed elk) and elk that use feedgrounds (feedground elk) for the Afton, Upper
Green River, Fall Creek, and Piney herd units in western Wyoming����������������������������������28
22. Land ownership, mule deer critical winter ranges, and moose critical winter
ranges overlayed with average per capita elk for elk that use native winter
ranges (unfed elk) and elk that use feedgrounds (feedground elk) in the Afton,
Upper Green River, Fall Creek, and Piney herd units in western Wyoming����������������������29
23. Winter elk locations from Wyoming Game and Fish Department surveys with
the predicted per capita elk use for unfed elk during the month of February������������������30
24. Average per capita elk use on different land for the continued feeding
and no feeding alternatives applied to Dell Creek (Afton herd unit) and
Forest Park (Green River herd unit)�����������������������������������������������������������������������������������������32
25. The predicted number of cumulative elk abortions on private property over 20
years for the Afton and Upper Green River herd units���������������������������������������������������������33
26. The average per capita elk use from March to May on private property for the
continued feeding and no feeding alternatives applied to Dell Creek or Forest
Park feedgrounds�����������������������������������������������������������������������������������������������������������������������33
27. The cumulative number of elk days divided by 100,000 on different land use
types in the Afton and Upper Green River herd units for the four alternatives����������������34
28. Graphs showing the average per capita elk use on different land types
assuming all feedgrounds are operational compared to feedgrounds on U.S.
Department of Agriculture Forest Service properties are closed��������������������������������������35
29. Boxplots of the cumulative number of elk abortions on private property over 20
years as an index of brucellosis risk to cattle�����������������������������������������������������������������������36
30. Boxplots of the cumulative elk days on private property over 20 years for
continued feeding, phaseout, and no feeding alternatives�������������������������������������������������37
31. Boxplots of the cumulative number of elk days on mule deer critical winter
range over 20 years for the continued feeding, phaseout, and no feeding
management alternatives����������������������������������������������������������������������������������������������������������38
32. Boxplots of elk days on moose critical winter range over 20 years as an index
of competition between elk and moose for the continued feeding, phaseout,
and no feeding management alternatives������������������������������������������������������������������������������39
Tables
1. Recent counts of elk on Wyoming supplemental feedgrounds, which
feedgrounds are located on U.S. Department of Agriculture Forest Service
property, and the year their supplemental feeding permit expires��������������������������������������5
2. Fundamental objectives, associated performance metrics, and their sources in
this report or the Environmental Impact Statement��������������������������������������������������������������12
3. Elk vital and harvest rate estimates used in the sex- and age-structured
stochastic simulation model�����������������������������������������������������������������������������������������������������14
4. Average elk population sizes from 2010 to 2020 in 13 Wyoming HUs around the
Greater Yellowstone Ecosystem����������������������������������������������������������������������������������������������15
5. Elk counts from 2020 for the six modeled herd units in Wyoming��������������������������������������17
6. Chronic wasting disease prevalence in year 20, cumulative chronic wasting
disease mortalities, population size, and cumulative harvest of elk under the
four alternatives for the Afton and Upper Green River herd units�������������������������������������20viii
7. Consequence table showing the 11 performance metrics and 4 alternatives for
the Afton herd unit����������������������������������������������������������������������������������������������������������������������41
8. Consequence table showing the 11 performance metrics and 4 alternatives for
the Upper Green River herd unit����������������������������������������������������������������������������������������������42
9. Cumulative effects table showing seven performance metrics and chronic
wasting disease prevalence for three alternatives on all feedgrounds and
those on U.S. Department of Agriculture Forest Service lands������������������������������������������43
Conversion Factors
U.S. customary units to International System of Units
Multiply By To obtain
Length
foot (ft) 0.3048 meter (m)
mile (mi) 1.609 kilometer (km)
yard (yd) 0.9144 meter (m)
Area
acre 4,047 square meter (m2)
acre 0.4047 hectare (ha)
acre 0.4047 square hectometer (hm2)
acre 0.004047 square kilometer (km2)
square foot (ft2) 0.09290 square meter (m2)
section (640 acres or 1 square mile) 259.0 square hectometer (hm2)
square mile (mi2) 259.0 hectare (ha)
square mile (mi2) 2.590 square kilometer (km2)ix Abbreviations CF continued feeding alternative CWD chronic wasting disease EF emergency feeding alternative EIS environmental impact statement FS U.S. Department of Agriculture Forest Service FWS U.S. Fish and Wildlife Service HU herd unit NEPA National Environmental Policy Act NF no feeding alternative MDCR mule deer critical winter range MOCR moose critical winter range PO phaseout alternative PM performance metric PrPCWD misfolded prion protein that causes chronic wasting disease RSF resource selection function SD standard deviation WGFC Wyoming Game and Fish Commission WGFD Wyoming Game and Fish Department
Evaluating Management Alternatives for Wyoming Elk
Feedgrounds in Consideration of Chronic Wasting Disease

By Jonathan D. Cook,1 Paul C. Cross,1 Emma M. Tomaszewski,1 Eric K. Cole,2 Evan H. Campbell Grant,1
James M. Wilder,3 Michael C. Runge1

1. Executive Summary                                              capacity and previously fed elk population segments would
                                                                  decline by 50 percent because of feedground closures. We
      The authors used decision and modeling analyses to          used a panel of experts to help estimate CWD transmission
evaluate management alternatives for a decision on whether        in fed and unfed elk population segments. In aggregate,
to permit Cervus canadensis (elk) feeding on two sites on         the expert panel estimated that median values of direct and
Bridger-Teton National Forest, Dell Creek and Forest Park.        indirect transmission of CWD are expected to be 1.9 and 4
Supplemental feeding of elk could increase the transmission       times higher, respectively, in fed elk populations compared
of chronic wasting disease (CWD) locally and disease spread       to unfed elk. We used these disease transmission estimates in
regionally, potentially impacting elk populations over time       combination with local elk demographic rates and carrying
with wider implications for Odocoileus hemionus (mule deer)       capacity estimates to project disease and population dynamics.
and Odocoileus virginianus (white-tailed deer) populations              In year 20, we predicted CWD prevalence would increase to
and hunting, tourism, and regional revenue. Supplemental          40 percent (5th and 95th percentiles = [32 percent, 51 percent]),
feeding is thought to improve overwinter elk survival and         and 14 percent (5th and 95th percentiles = [3.9 percent,
reduce the commingling of elk with cattle during months when      29 percent] on average for fed and unfed elk population
brucellosis transmission risk is highest. We worked with the      segments, respectively, given a starting prevalence of 1.6 percent.
U.S. Department of Agriculture Forest Service to identify their   The prevalence estimates for the unfed elk population segments
fundamental objectives and associated performance metrics         are in the range of previous observations of CWD in elk in the
related to this feedground decision. We then developed disease    western United States. The average CWD prevalence from 2016
and habitat selection models to quantify the effect of four       to 2018 in the unfed elk population of Wind Cave National Park
management alternatives on select performance metrics. The        in South Dakota was 18 percent overall but up to 30 percent in
four alternatives were to continue to permit feeding, phaseout    some regions (Sargeant and others, 2021). Meanwhile, CWD
permits to feed in three years, permit feeding on an emergency    prevalence in the Iron Mountain and Laramie Peak elk herds
basis, or stop permitting feeding. In this report, we present     in Wyoming from 2016 to 2018 was 14 percent and 7 percent,
methods and summarized results on disease and habitat             respectively, despite being present since at least 2002 (Wyoming
selection models and summaries of other performance metrics       Game and Fish Department, 2020b).
analyzed by BIO-WEST, Inc. and Cirrus Ecological Solutions              Elk that are fed at Forest Park and Dell Creek constitute
as part of an Environmental Impact Statement.                     14–19 percent of the total elk on their respective HUs. As a
      Data from Wyoming Game and Fish Department                  result, the differences between management alternatives are
(WGFD) supported the assumption that supplemental elk             modest when considering the closure of only one feedground
feeding allows for larger elk populations in a region. We         on an HU. The no feeding alternative for Forest Park resulted
documented herd units (HU) with feedgrounds having                in a CWD prevalence of 16 percent in the Afton HU compared
2.2 times higher densities of elk per area of winter range        to 19 percent with continued feeding by year 20. In the
when compared against HUs without feedgrounds, after              Upper Green River HU, no feeding on Dell Creek resulted
accounting for differences in sightability of elk counts on       in a CWD prevalence of 30 percent compared to 34 percent
and off feedgrounds. Thus, throughout our analyses, we            with continued feeding. In terms of disease-associated
assumed feedground closures would reduce elk carrying             mortality, we predicted the closure of Forest Park and Dell
                                                                  Creek feedgrounds would reduce the total number of CWD
                                                                  mortalities by 9 percent in the Afton HU and 20 percent in the
                                                                  Upper Green River HU during the 20-year timespan.
  1U.S. Geological Survey.                                              Our spatial analyses predicted that management alterna-
  2U.S.   Fish and Wildlife Service.                              tive effects vary by HU as a function of private property and
                                                                  other wildlife winter ranges proximity relative to feedground
  3U.S.   Department of Agriculture Forest Service.
2 Evaluating Management Alternatives for Wyoming Elk Feedgrounds
location. The predicted number of elk abortions on private Recent CWD detections in mule deer and elk in Grand
land, as a proxy for brucellosis risk to cattle, may increase Teton National Park has elevated the importance of the
by 8–10 percent in the absence of feeding at Dell Creek current decision on whether, and how, to permit elk feeding
and Forest Park. On the Afton HU, the no feeding alterna- on Forest Park and Dell Creek and the management of the
tive resulted in the lowest use of mule deer and Alces alces other feedgrounds. Aggressive male harvest has slowed,
(moose) winter range by elk. In the Upper Green River HU, but not stopped, the increasing prevalence of CWD in mule
the no feeding alternative resulted in less use of moose winter deer (Conner and others, 2021). It is unclear whether harvest
range compared to continued feeding, but higher elk use of management can be an effective tool to slow the spread of
mule deer winter range. CWD in elk. There are also no effective treatments or vaccines
Eight feedgrounds are located on Bridger-Teton National for CWD, and it is unlikely that any will be developed that can
Forest, all of which have permits that have expired or will be easily deployed in the near future. Thus, reducing artificial
expire prior to 2028. In addition, WGFD could change their aggregations is one of the few management approaches
management of feedgrounds in light of new information; suggested by the Western Association of Fish and Wildlife
therefore, we also assessed the cumulative effects of continued Agencies (Almberg and others, 2017).
feeding, phaseout, and no feeding management alternatives Future surveillance and monitoring can be designed to
across five HUs south of Jackson, Wyoming (Afton HU, Fall resolve uncertainties that can improve future decision-making.
Creek HU, Piney HU, Pinedale HU, and Upper Green River If feedgrounds close, research could quantify elk population
HU). These five HUs ranged from about 60 to 95 percent of reductions in the absence of feeding, the redistribution of fed
the elk herd using feedgrounds, which corresponded to a CWD elk to other places, or the consequences of elk movement on
prevalence at year 20 of 21–38 percent if all feedgrounds in private property. If feedgrounds remain open, research could
those five HUs remained open relative to 13 percent if all assess how rapidly CWD spreads in artificial aggregations
feedgrounds were closed. For all management alternatives, we of elk; however, surveillance programs would need to be
predicted a 30–58 percent decline in elk populations at the HU designed with sufficient power to detect initial changes of
level over 20 years because of increasing CWD prevalence CWD prevalence. Delaying action on feedground management
or from reductions in populations because of feedground was projected to be costly. Results of the phaseout alternative
closures. We predicted feedground closures may result in more relative to the no feeding alternative suggested a three-year
immediate reductions in population size relative to alternatives delay was enough for substantial long-term changes in
that continue feeding (for example, continued feeding and CWD prevalence. The long-term persistence of infectious
emergency feeding alternatives); however, over longer periods CWD prions in the environment suggests that feedground
of time, CWD-associated mortality leads to larger population management decisions may have long-lasting consequences.
reductions. The no feeding alternative resulted in higher elk Our results indicated tradeoffs in the ability of a
population sizes compared to the continued feeding alternative management agency to achieve all their objectives, and all
after 10–15 years of implementation. Delayed action under management alternatives resulted in significant reductions
a phaseout alternative resulted in roughly doubling CWD in elk population size. This report contains the foundational
prevalence relative to no feeding on HUs with a large elements for formal decision analysis methods, which can be
population of fed elk. implemented to help decision makers transparently evaluate
Summarizing our cumulative results across all five of the consequences of decision alternatives and identify the set
the analyzed HUs, we predicted continued feeding will lead of actions that best achieve agency and stakeholder priorities.
to fewer elk by year 20 (mean =10,400, standard deviation
[SD] = 800) compared to no feeding at U.S. Department
of Agriculture Forest Service sites (11,300, SD = 600). 1.1. References Cited
The closure of all feedgrounds was projected to result in
the largest elk populations at year 20 (11,800, SD = 600). Almberg, E.S., Ball, M.C., Bollinger, T.K., Heffelfinger,
Continued feeding at all sites, however, resulted in the largest J.R., Holland, A.A., Lutz, D.W., Mehl, K.R., Merrill,
cumulative harvest of 55,400 (SD = 3,500) compared to E.H., Miller, M.W., Pybus, M.J., and Wood, M.E., 2017,
51,000 (SD = 1,600) for no feeding at all current feedground Recommendations for adaptive management of chronic
sites on the five HUs. Continued feeding also resulted in wasting disease in the west: Wildlife Health Committee
the lowest brucellosis costs to producers ($199,000, SD and Mule Deer Working Group, Western Association of
= $7,400) compared to phasing out all feedgrounds in Fish and Wildlife Agencies, 14 p., accessed October 2022,
three years ($218,000, SD = $7,500). Assuming moderate at https://wafwa.org/wpdm-package/recommendations-
reductions in hunter interest because of increasing CWD for-adaptive-management-of-chronic-wasting-disease-in-
prevalence in elk, we predicted that no feeding resulted the-west/?wpdmdl=5531&refresh=63a0a6ff36ea616714
in a regional revenue of $162 million (SD = $4.0 million) 72895&ind=1597418597824&filename=CWDAdap
compared to $176 million (SD = $8.0 million) for continued tiveManagementRecommendations_WAFWAfinal_
feeding over the 20-year timeframe. approved010618.pdf.2. Introduction 3
Conner, M.M., Wood, M.E., Hubbs, A., Binfet, J., Holland, opportunities, and mitigating the loss of winter range to
A.A., Meduna, L.R., Roug, A., Runge, J.P., Nordeen, T.D., human development. Wyoming’s wildlife damage law imposes
Pybus, M.J., and Miller, M.W., 2021, The relationship liability on the Wyoming Game and Fish Commission (WGFC)
between harvest management and chronic wasting disease to pay for damages to agriculture producers caused by big
prevalence trends in western mule deer (Odocoileus game animals (Wyo. Stat. § 23-1-901). When feedgrounds
hemionus) herds: Journal of Wildlife Diseases, v. 57, were established, wildlife managers found it easier and less
no. 4, p. 831–843, accessed October 2022, at https://doi. expensive to feed elk in some areas during winter rather than
org/10.7589/JWD-D-20-00226. maintain hazing operations or mitigate private property damage
caused by elk (McWhirter and others, 2021).
Sargeant, G.A., Wild, M.A., Schroeder, G.M., Powers, J.G., Supplemental feedgrounds create denser aggregations of
and Galloway, N.L., 2021, Spatial network clustering reveals elk than native winter ranges (Cross and others, 2015; Janousek
elk population structure and local variation in prevalence of and others, 2021); thus, facilitating higher rates of disease
chronic wasting disease: Ecosphere, v. 12, no. 12, p. 1–16, transmission among elk (National Academies of Sciences,
accessed October 2022, at https://doi.org/10.1002/ecs2.3781. Engineering and Medicine, 2017). Brucellosis is a common,
Wyoming Game and Fish Department, 2020b, Wyoming zoonotic disease globally (Pappas and others, 2006). In the
chronic wasting disease management plan: p. 73, accessed early 1900s, it was widespread in the U.S. cattle population
October 2022, at https://wgfd.wyo.gov/WGFD/media/ (Ragan, 2002) and probably spilled over to neighboring elk and
content/PDF/Get%20Involved/CWD/Final-WGFD-CWD- bison populations. However, because of a long-term eradica-
Management-Plan-7-2020-with-appendices.pdf. tion program in cattle organized by the U.S. Department of
Agriculture, the incidence of brucellosis cases in cattle and
humans in the United States is now low (Ragan, 2002; Rhyan
and others, 2013). The Greater Yellowstone Ecosystem is the
2. Introduction last remaining wildlife reservoir of bovine brucellosis in the
United States, where it is enzootic among elk and bison with
This report documents a structured decision-making occasional spillovers to cattle (Rhyan and others, 2013).
process and supporting analyses developed to inform a Historically, elk were not considered maintenance
National Environmental Policy Act (NEPA, 42 U.S.C. hosts for brucellosis in the absence of supplemental feeding;
4321-4347) Environmental Impact Statement (EIS). The however, recent increases in brucellosis seroprevalence in elk
assessment centered around a decision by the U.S. Department populations that do not overwinter on feedgrounds suggests
of Agriculture Forest Service (FS) on whether to permit the halting supplemental feeding is unlikely to eradicate the disease
State of Wyoming to continue supplemental feeding of Cervus (Cross, Cole, and others, 2010; Cross, Heisey, and others, 2010;
canadensis (elk) on two State-run feedgrounds, Dell Creek Brennan and others, 2017; National Academies of Sciences,
and Forest Park, located on Bridger-Teton National Forest 2017). Brucellosis seroprevalence and spatial extent in elk
(fig. 1, table 1). Although we framed the decision to evaluate increased in the early 2000s, coincident with changes in elk
the outcomes of management alternatives on these two density (Cross, Cole, and others, 2010; Cross, Heisey, and
feedgrounds, our analytical methods and approach are useful others, 2010; Proffitt and others, 2015). Earlier analyses of
to evaluate feedground operations across western Wyoming. brucellosis seroprevalence suggested feedgrounds with longer
Supplemental feeding of ungulates is a common practice feeding seasons had higher seroprevalence (Cross and others,
and ranges in scale from agricultural mineral licks to State and 2007). Results of attempts to shorten the feeding seasons were
federally operated feeding on an emergency or seasonal basis less clear (Cotterill and others, 2020), potentially highlighting
across several western States. Supplemental feeding of elk and that even when feeding seasons are shortened, elk continue to
Bison (bison) in Wyoming are some of the longest running remain at higher local densities in winter. Although feedgrounds
programs, with feeding of elk beginning in the Jackson area serve as the primary management approach to limit brucellosis
around 1907. The National Elk Refuge, operated by the U.S. transmission from elk to cattle, this may have led to a cycle of
Fish and Wildlife Service (FWS) was established in 1912 and increased aggregations and brucellosis transmission in fed elk.
one of the first locations supplemental feeding of elk occurred Recent detections of chronic wasting disease (CWD)
(Smith, 2001). The State of Wyoming established 22 additional in mule deer and elk in Grand Teton National Park have
feedgrounds in western Wyoming from 1930 to 1980. Eight of raised additional concerns about disease impacts on elk
those feedgrounds operated by the State of Wyoming are on FS populations if supplemental feeding continues. Chronic
property in the Bridger-Teton National Forest (table 1). wasting disease affects members of the Cervidae family and
Feedgrounds in Wyoming usually operate from December is caused by a misfolded prion protein (PrPCWD) that can
to April depending on the location and severity of annual persist in the environment for many years (Williams and
snowpack (Cross and others, 2007). Feedgrounds were Young, 1980; Williams and Miller, 2002; Miller and others,
created for a variety of reasons, including reducing wildlife 2004). The disease is always fatal, but some elk genotypes
damage, addressing public concerns about winter mortality are associated with a slower progression of disease
of elk, supporting higher populations for increased hunting (Robinson and others, 2012; Monello and others, 2017).4 Evaluating Management Alternatives for Wyoming Elk Feedgrounds
A
MONTANA
N
NORTH BIGHORN
CLARK'S FORK
YELLOWSTONE
NATIONAL
PARK
CODY
GOOSEBERRY
JACKSON
WYOMING
FALL
CREEK WIGGINS FORK
UPPER
GREEN
RIVER
IDAHO
HOBACK
AFTON
PINEY
SOUTH WIND RIVER
PINEDALE
0 25 50 MILES
0 25 50 KILOMETERS
B
N
JACKSON
FALL CREEK EXPLANATION
UPPER
GREEN WIGGINS FORK Elk herd units
RIVER
Elk winter range
Bridger-Teton National
Forest
AFTON
Elevation above 2,500
PINEY meters
Other feedgrounds
Dell Creek feedground
PINEDALE
Forest Park feedground
IDAHO
WYOMING
0 10 20 30 40 MILES
0 10 2030 40 KILOMETERS
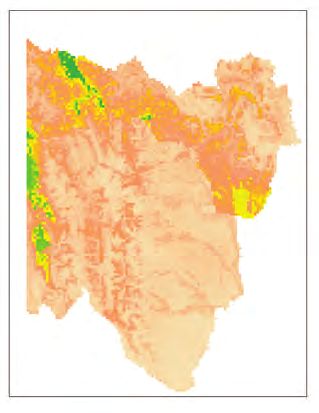
Figure 1. A, the supplemental elk feedgrounds in western Wyoming and associated elk
herd units used to assess winter elk density in fed and unfed herd units; and B, the Hoback
herd unit was incorporated into the Piney and Upper Green River herd units in 2020.2. Introduction 5
Table 1. Recent counts of elk on Wyoming supplemental feedgrounds, which feedgrounds are located on U.S. Department of
Agriculture Forest Service property, and the year their supplemental feeding permit expires.
[Year, biological year of the elk count used in the analyses. The year 2020 refers to the 2020–21 winter; HU, herd unit; FS, U.S. Department of Agriculture
Forest Service; NA, not applicable]
Year Feedground Elk HU1 HU2 Expiration
Feedgrounds on FS property
2020 Forest Park 399 Afton Afton 32016
2020 Dog Creek 518 Fall Creek Fall Creek 2028
2020 Dell Creek 529 Upper Green River Hoback 32016
2020 Alkali 0 Jackson Jackson 2024
2020 Fish Creek 0 Jackson Jackson 2028
2021 Fall Creek 591 Pinedale Pinedale 2028
2020 Muddy Creek 515 Pinedale Pinedale 2028
2020 Green River Lakes 698 Upper Green River Upper Green River 2028
Feedgrounds not on FS property
2020 Greys River 544 Afton Afton NA
2020 Camp Creek 1,249 Fall Creek Fall Creek NA
2020 Horse Creek 1,043 Fall Creek Fall Creek NA
2020 South Park 786 Fall Creek Fall Creek NA
2020 McNeel 779 Piney Hoback NA
2020 Patrol Cabin 1,087 Jackson Jackson NA
2020 National Elk Refuge 8,384 Jackson Jackson NA
2020 Scab Creek 745 Pinedale Pinedale NA
2020 Bench Corral 600 Piney Piney NA
2020 Finnegan 439 Piney Piney NA
2020 Franz 89 Piney Piney NA
2020 Jewett 345 Piney Piney NA
2020 Black Butte 918 Upper Green River Upper Green River NA
2021 Soda Lake 913 Upper Green River Upper Green River NA
1Herd unit membership after 2020 without the Hoback unit.
2Herd unit membership before 2020 with the Hoback unit.
3Operating on a special-use permit.
Chronic wasting disease is transmitted through direct contact Beyond disease issues, natural resource managers are
with an infectious individual and indirectly by contact with balancing other ecological, social, and economic benefits
a PrPCWD contaminated environment (Miller and others, associated with Greater Yellowstone Ecosystem elk and
2004). In Wyoming, CWD-induced population declines have feedground programs. Elk are important prey for the predator
been observed in mule deer and Odocoileus virginianus guild of the Greater Yellowstone Ecosystem, including Canis
(white-tailed deer) (Edmunds and others, 2016; DeVivo and lupus (wolves), Ursus horribilus (grizzly bears), and Puma
others, 2017). Elk populations are predicted to decline when concolor (mountain lions). For humans, elk are a valuable
prevalence reaches 7–13 percent (Monello and others, 2014; big game animal, which support local resource-associated
Galloway and others, 2021). The impacts of CWD may be economies and have valuable, non-consumptive uses associated
more severe in less productive, arid ecosystems with lower with wildlife viewing and other forms of ecotourism. Local
elk and deer densities and recruitment (Foley and others, communities host elk festivals that draw in thousands of visitors
2015). As of 2023, there are no effective treatments for CWD and shed antlers are collected for sale at the annual Jackson
at the individual, population, or landscape level. Hole Boy Scout elk antler auction.6 Evaluating Management Alternatives for Wyoming Elk Feedgrounds
To evaluate the environmental impact of a natural resource ranges under the different alternatives. In total, the analytical
decision, NEPA requires an evaluation of environmental sections provided effects estimates for 5 of 11 performance
effects (in other words, objectives) in relation to the proposed metrics associated with the six fundamental objectives. The
alternatives. In practice, the evaluations are typically qualitative fundamental objectives related to socioeconomic effects were
and narrative in structure, but require many, or all, of the same evaluated by a separate team working on the NEPA EIS; thus,
assumptions as the quantitative evaluations required by more these methods and results will be presented therein.
formal decision analytical methods. A potential downside The analytical sections on CWD, population size, and
to qualitative assessments is the decision process is less harvest projections (Section 4) and spatio-temporal analysis of
transparent about assumptions made, how issues are weighed, elk distributions (Section 5) grappled with predictions about
and ultimately, how the lead agency arrived at the preferred what would happen in the future under different management
alternative. We designed this report and analysis to support a alternatives. These types of questions typically cannot be
quantitative assessment of effects, which can facilitate future answered based upon empirical evidence alone. For example,
decision analysis and transparent decision-making. we cannot compare what elk density would be in a herd
This feedground permitting decision would benefit from unit (HU) with and without feeding because we only have
a more rigorous evaluation of meeting agency objectives in comparable data from times when feeding occurred. We do
relation to the selected alternatives. To guide such a process, not have data on how rapidly CWD spreads in comparable
the U.S. Geological Survey (USGS), in partnership with elk populations on supplemental feedgrounds. We constructed
the U.S. Department of Agriculture Forest Service (FS) and statistical and mechanistic mathematical models that incorporate
Wyoming Game and Fish Department (WGFD), led a formal prior knowledge and, in some cases, multiple hypotheses about
decision analysis process and developed quantitative models future system dynamics to simulate scenarios that represent
to evaluate the effects of alternatives on the objectives the lead outcomes of management alternatives. These models required
agency, cooperating agencies, and stakeholders were interested simplifying assumptions, which we attempted to make clear.
in (and, in some cases, mandated to) achieving. This report The transparency of assumptions behind the models and use of
captured the important technical elements of the decision decision analysis techniques are valuable because the alternative
context, the analytical methods, and is intended to inform the is a mental model of how the complex ecosystem interacts with
NEPA EIS process. unstated assumptions, biases, and weights.
Overall, the report has three primary goals: The Bridger-Teton National Forest is currently faced with
1. To describe the decision problem as defined by the FS management decisions specific to the Dell Creek and Forest
with the support of cooperating agencies, stakeholders, Park feedgrounds. The permits for six additional feedgrounds
and members of the public as part of the NEPA EIS on the Bridger-Teton National Forest will expire in the next
process; several years (table 1). Therefore, we also simulated the
effects of management alternatives if they are implemented
2. To develop and describe the modeling approaches used across all feedgrounds; however, State-run feedgrounds
to project the effect of management alternatives on outside of FS lands are outside of the FS authority to manage.
objectives; and A 2021 Wyoming law House Bill 101 required an order of
the governor to close an elk feedground and required WGFD
3. To provide results for use in agency deliberation, to develop plans for alternative feedground sites (State of
including a consequence table summarizing predicted Wyoming, 2021). Therefore, we analyzed the potential closure
performance of each alternative relative to objectives. of all feedgrounds within a HU to inform this process. In
these cumulative analyses, we included the Afton, Fall Creek,
Piney, Pinedale, and Upper Green River HUs. We excluded
2.1. Report Structure the Jackson HU because the National Elk Refuge is develop-
ing their own feedground management plan that would likely
We organized the report into four primary sections.
have different alternatives than alternatives assessed here.
The first section focused on decision framing and included
Additionally, the proximity of the city to the National Elk
a description of the problem, fundamental and strategic
Refuge and elk-proof fencing makes this HU a unique case.
objectives, performance metrics, and the management alter-
natives selected for evaluation. Following the description of
the decision framing (Section 3), we presented two analytical
sections used to estimate the effects of the alternatives on 3. Decision Framing
several of the fundamental objectives.
Section 4 used a sex- and age-structured population Structured decision making is a formal and transparent
model to analyze the effects of alternatives on CWD preva- process by which decision makers breakdown complex
lence and disease-induced mortality, elk population size, and problems into constituent parts (problem statement,
elk harvest. Section 5 built on those results and used popula- objectives, alternatives, consequences, and tradeoffs) and then
tion sizes in a spatial model to project space use patterns of analyze using various methods, including decision analysis
elk, human-elk conflict, and elk use of mule deer and moose methodology and quantitative models. In the past, structured3. Decision Framing 7
decision making has been successfully used to inform complex the long-term, decisions on permitting other feedground sites
natural resource decisions that allow agencies to consider on Bridger-Teton National Forest are also required and will
multiple management objectives and system uncertainties, consider multiple objectives of the Bridger-Teton National
which would otherwise challenge their ability to select the best Forest by considering any tradeoffs in achieving Forest Plan
course of action (Runge and others, 2013, 2015). The result objectives and diverse stakeholder interests.
is a transparent and deliberative process that leads to rational Historically, FS issued special-use permits to WGFD
decisions, which can be effectively communicated to stake- to allow supplemental feeding of elk during winter at eight
holders and members of the public. locations on Bridger-Teton National Forest. The permits include
a use authorization and site-specific stipulations. Two of these
locations, Dell Creek and Forest Park, have been in operation
3.1. Problem Statement for at least 40 years. Both special-use permits expired in 2016,
but the WGFD has been allowed to continue feeding using
The Bridger-Teton National Forest, located in western
shorter, one-year permits. To determine a 20-year long permit
Wyoming, is part of the larger Greater Yellowstone Ecosystem.
request for both feedgrounds, the Bridger-Teton National Forest
In total, the Bridger-Teton National Forest comprises more than
is assessing the environmental impacts of elk feeding activities
3.4 million acres of public lands, including 1.2 million acres that
by producing an EIS and subsequent Record of Decision
are designated wilderness. The cultural, biological, and physi-
under NEPA. An EIS was determined necessary because of
cal resources on Bridger-Teton National Forest are managed
the uncertainty of management alternatives on elk populations,
and preserved to maximize their continued use and sustain-
disease threats, and economic effects.
ability as guided by the 1990 Bridger-Teton Land and Resource
Management Plan (hereafter Forest Plan) and based on the
National Forest Management Act of 1976 (16 U.S.C. 1600) and 3.2. Fundamental Objectives and Performance
Multiple-Use Sustained Yield Act of 1960 (16 U.S.C. 528-531). Metrics
Decisions on Bridger-Teton National Forest resources and lands
management are under the direct authority of the forest supervi- Fundamental objectives describe the set of system
sor; however, the Bridger-Teton National Forest maintains close attributes a decision maker is motivated (or mandated)
partnerships with many State and Federal agencies. to achieve (Gregory and others, 2012). Under NEPA, the
One of the premier biological resources in the Greater fundamental objectives are often referred to as “resource goals.”
Yellowstone Ecosystem are Rocky Mountain elk. Elk are For a decision maker, the set of fundamental objectives are a
valued as a cultural resource for public viewing and tourism comprehensive description of the full range of independent
and a game animal that supports hunters, outfitters, and hunt- concerns related to a decision and should be sensitive
ing guides. In recent years, CWD has emerged as an imminent enough to differentiate among the range of alternatives under
threat to elk health on Bridger-Teton National Forest lands. consideration (Gregory and others, 2012; Runge and others,
The first detection of CWD in the feedground region occurred 2015). Bridger-Teton National Forest used U.S. Geological
in the fall of 2020 when a cow elk tested positive in Grand Survey-facilitated meetings, feedback from cooperating
Teton National Park. The migratory movements of elk within agencies and stakeholders, and public comments to identify six
Bridger-Teton National Forest and among adjacent lands may fundamental objectives and two strategic objectives that were
serve as a direct route of CWD introduction onto Bridger- important to consider when making permitting decisions on
Teton National Forest. Chronic wasting disease has the Dell Creek and Forest Park. Strategic objectives are higher level
potential to affect population productivity, hunting opportuni- objectives that go beyond the scope of the immediate decision
ties, and elk viewing opportunities for the public. Thus, recent to help achieve or preserve other linked opportunities or
CWD detection and potential spread onto the Bridger-Teton relations (Keeney, 1996). Several objectives are drawn directly
National Forest created concern about potential disease effects from an interpretation of the Bridger-Teton National Forest’s
on elk populations, the Greater Yellowstone Ecosystem, public enabling legislation, the Forest Plan, the National Forest
enjoyment, and local economies. Management Act of 1976, and the Multiple-Use Sustained
Many wildlife diseases, especially those with persistent Yield Act of 1960. Other objectives were considered based on
pathogen stages like CWD, are best managed in the early public and stakeholder concerns and evaluated as part of these
stages of an outbreak by implementing proactive measures that fundamental objectives or as narratives described in the EIS.
prevent introduction or limit the spread and growth (Langwig The FS completed the final selection of issues and concerns
and others, 2015). Because of the diverse management carried forward as fundamental objectives in this report.
responsibilities and objectives of the Bridger-Teton National Fundamental Objective 1.—Minimize Disease Prevalence
Forest and the interests of stakeholders, a transparent and in Elk. According to Land and Resource Management
deliberative decision-making approach that considers system Objective 2.1(b) of the Forest Plan, Bridger-Teton National
uncertainties is necessary to inform management of elk under Forest is directed to provide suitable and adequate habitat to
threat of CWD. In the coming months, decisions that consider support game and fish populations established by the WGFD,
multiple potential benefits and risks of permitting elk feeding as agreed to by the FS. The introduction and spread of diseases
activities on Dell Creek and Forest Park sites are required. In in elk that overwinter and are fed on feedgrounds could lead to8 Evaluating Management Alternatives for Wyoming Elk Feedgrounds
faster disease spread and reductions in population size. Further, Fundamental Objective 4.—Maintain Other Big
if elk aggregations occur repeatedly in the same geographic Game Populations (Mule Deer and Moose). Similar to
location, like at elk feeding sites, Bridger-Teton National Forest Fundamental Objective 2, the Bridger-Teton National Forest
lands may be contaminated by pathogens, leading to locally aims to provide suitable and adequate habitat to support mule
elevated, indirect disease transmission. Thus, decisions on deer and moose populations. Permitting decisions on the use
whether and how to permit elk feeding at Dell Creek and Forest of Dell Creek and Forest Park sites for supplemental feeding
Park could affect the suitability of Bridger-Teton National activities may affect the space use patterns and behavior of elk
Forest habitats to support healthy elk populations (Objective overwintering on Bridger-Teton National Forest lands; thus,
2.1[b]). The effect of alternatives on Fundamental Objective 1 changes in feeding may affect competitive interactions among
will be measured by the cumulative number of elk mortalities mule deer, moose, and elk on critical summer, transitional,
attributed to CWD across the 20-year permitting period on the or winter ranges for these species. The effect of alternatives
Afton (Forest Park) and Upper Green River (Dell Creek) HUs on Fundamental Objective 4 will be measured by the total
(performance metric 1, PM1). number of elk-use days of mule deer critical winter range
Fundamental Objective 2.—Maintain Big Game (MDCR) and moose critical winter range (MOCR) within the
Populations (Elk). According to Land and Resource Afton (Forest Park) and Upper Green River (Dell Creek) HUs
Management Objective 2.1(b) of the Forest Plan, Bridger-Teton over 20 years (performance metrics 4a and 4b, respectively,
National Forest will provide suitable and adequate habitat to PM4a and PM4b).
support game and fish populations established by the WGFD, as Fundamental Objective 5.—Minimize Conflict with
agreed to by the FS. Elk populations in the Greater Yellowstone Agricultural and Public Stakeholders. Elk feeding on
Ecosystem may be limited in the amount of suitable and Bridger-Teton National Forest and other feedgrounds in
naturally occurring winter forage, particularly during harsh the Greater Yellowstone Ecosystem have been maintained,
winter conditions and high snowpack. Supplemental feeding in part, to reduce human-elk conflicts. Feedgrounds help
may help to improve overwinter elk body condition and mitigate potential conflicts including the spillover of
survival. Conversely, the continuation of feedground operations brucellosis to cattle, elk depredation on private agricultural
may increase elk mortality by increasing CWD prevalence in products (for example, stored hay), and elk overwintering
elk that overwinter on feedgrounds. A decrease in the health in suburban areas leading to wildlife-vehicle collisions and
and size of elk herds would negatively affect hunting and destruction of developed areas. The effect of alternatives on
wildlife viewing opportunities. The effect of alternatives on Fundamental Objective 5 will be measured by the cost of elk
Fundamental Objective 2 will be measured by elk population depredation on privately owned hay stackyards (performance
size on the Afton (Forest Park) and Upper Green River (Dell metric 5a, PM5a), the number of elk abortions on private
Creek) HUs in the last year of the 20-year permitting period lands during the high-risk brucellosis transmission period,
(performance metric 2, PM2). and projected costs to livestock producers within the Afton
Fundamental Objective 3.—Maximize Elk Hunting (Forest Park) and Upper Green River (Dell Creek) HUs
Opportunities. Several goals as described in the Forest (performance metric 5b, PM5b).
Plan support maximizing elk hunting opportunities and Fundamental Objective 6.—Maximize the Prosperity of
hunter satisfaction. Of relevance is Forest Challenge Goal Resource-Supported Economies. Elk hunting and viewing
2.1, which aims to ensure adequate supplies of products and opportunities in the Greater Yellowstone Ecosystem rely on
experiences related to wildlife, fish, and edible vegetation healthy and abundant populations. In combination, hunting
to meet human food needs. Forest Challenge Goal 2.1 is and wildlife viewing supports many economic and social
supported by Objectives 2.1(b) and 2.1(c), which requires benefits in and around the Bridger-Teton National Forest.
suitable and adequate habitat to support game populations Many business owners and clientele (outfitters, guides,
and the maintenance of forest-user opportunity (including lodges, restaurants, and others) may suffer without healthy
recreational, enjoyment, play, and subsistence uses). Further, game populations to harvest, view, and enjoy. The effect of
maintaining disease free elk populations is an important alternatives on Fundamental Objective 6 will be measured
consideration. According to a 2019 Wyoming Hunter by the loss of potential hay sales revenue (performance
Perspective survey, a majority of hunters were concerned metric 6a, PM6a), revenue generated by elk harvest tag
about the potential for CWD to reduce deer hunting sales to residents and nonresidents (performance metric 6b,
opportunity and future generations’ ability to enjoy deer PM 6b), regional revenues generated by hunting activities
hunting (Wyoming Game and Fish Department, 2020b). (performance metric 6c, PM6c), and revenue of elk outfitters
Needham and others (2006) documented similar opinions and guides (performance metric 6d, PM6d). We calculated
in Wyoming elk hunters. The effect of alternatives on all performance metrics for Fundamental Objective 6 as
Fundamental Objective 3 will be measured by the number cumulative costs or revenues across the 20-year permitting
of elk available for harvest on the Afton (Forest Park) and period. BIO-WEST, Inc. and Cirrus Ecological Services
Upper Green River (Dell Creek) HUs across the 20-year developed the methods to calculate costs and revenues and the
permitting period (performance metric 3, PM3). methods are described in the EIS.You can also read