Enhanced X-Ray Emission from the Most Radio-powerful Quasar in the Universe's First Billion Years
←
→
Page content transcription
If your browser does not render page correctly, please read the page content below

The Astrophysical Journal, 911:120 (12pp), 2021 April 20 https://doi.org/10.3847/1538-4357/abe710
© 2021. The American Astronomical Society. All rights reserved.
Enhanced X-Ray Emission from the Most Radio-powerful Quasar in the Universe’s First
Billion Years
Thomas Connor1,10 , Eduardo Bañados2,3 , Daniel Stern1 , Chris Carilli4 , Andrew Fabian5 , Emmanuel Momjian4 ,
Sofía Rojas-Ruiz2 , Roberto Decarli6 , Emanuele Paolo Farina7 , Chiara Mazzucchelli8 , and Hannah P. Earnshaw9
1
Jet Propulsion Laboratory, California Institute of Technology, 4800 Oak Grove Drive, Pasadena, CA 91109, USA; thomas.p.connor@jpl.nasa.gov
2
Max Planck Institute for Astronomy, Königstuhl 17, D-69117 Heidelberg, Germany
3
The Observatories of the Carnegie Institution for Science, 813 Santa Barbara Street, Pasadena, CA 91101, USA
4
National Radio Astronomy Observatory, P.O. Box O, Socorro, NM 87801, USA
5
Institute of Astronomy, Madingley Road, Cambridge CB3 0HA, UK
6
INAF—Osservatorio di Astrofisica e Scienza dello Spazio di Bologna, via Gobetti 93/3, I-40129, Bologna, Italy
7
Max Planck Institut für Astrophysik, Karl–Schwarzschild–Straße 1, D-85748, Garching bei München, Germany
8
European Southern Observatory, Alonso de Cordova 3107, Vitacura, Region Metropolitana, Chile
9
Cahill Center for Astronomy and Astrophysics, California Institute of Technology, Pasadena, CA 91125, USA
Received 2020 December 9; revised 2021 February 3; accepted 2021 February 15; published 2021 April 23
Abstract
We present deep (265 ks) Chandra X-ray observations of PSO J352.4034−15.3373, a quasar at z = 5.831 that, with a
radio-to-optical flux ratio of R > 1000, is one of the radio-loudest quasars in the early universe and is the only quasar
with observed extended radio jets of kiloparsec scale at z 6. Modeling the X-ray spectrum of the quasar with a
+0.29 +0.45 -1
power law, we find a best fit of G = 1.99- 0.28 , leading to an X-ray luminosity of L 2 – 10 = 1.26-0.33 ´ 10 erg s
45
and an X-ray to UV brightness ratio of αOX = −1.45 ± −0.11. We identify a diffuse structure 50 kpc (∼8″) to the
NW of the quasar along the jet axis that corresponds to a 3σ enhancement in the angular density of emission and can
be ruled out as a background fluctuation with a probability of P = 0.9985. While with few detected photons the
spectral fit of the structure is uncertain, we find that it has a luminosity of L2–10 ∼ 1044 erg s−1. These observations
therefore potentially represent the most distant quasar jet yet seen in X-rays. We find no evidence for excess X-ray
emission where the previously reported radio jets are seen (which have an overall linear extent of 0 28), and a bright
X-ray point source located along the jet axis to the SE is revealed by optical and NIR imaging to not be associated
with the quasar.
Unified Astronomy Thesaurus concepts: X-ray quasars (1821); X-ray astronomy (1810); Radio loud quasars
(1349); Quasars (1319); Jets (870)
1. Introduction high-redshift population include detection of variability (Nanni
et al. 2018) and dual AGN (Connor et al. 2019; Vito et al.
The evolution of supermassive black holes (SMBHs) in the
2019a). Recent works by Vito et al. (2019b) and Wang et al.
early universe represents a challenge for modern cosmology,
(2021a) have also constrained the evolution of accretion
requiring significant, sustained growth from primordial seeds to
physics for this population of SMBHs; they note a potential
explain the population of observed quasars in the first billion steepening of the average X-ray power-law emission at high
years of the universe (e.g., Inayoshi et al. 2020). In the past redshifts (z 6), suggestive of more rapid mass gain at the
decade, not only has the number of known members of this earliest epochs (e.g., Brightman et al. 2013). Clearly, further
population expanded through large surveys (e.g., Bañados et al. study of high-redshift quasars is important for deepening our
2016; Jiang et al. 2016; Mazzucchelli et al. 2017; Reed et al. understanding of early SMBH growth, particularly when these
2017; Matsuoka et al. 2019; Wang et al. 2019; Yang et al. studies expand the parameter space of analyzed quasar
2019), but individual discoveries have pushed out the extremes properties.
of mass (Wu et al. 2015; Yang et al. 2020), luminosity (Pons Radio-loud quasars are an important subpopulation of high-
et al. 2019; Medvedev et al. 2020), and redshift (Mortlock et al. redshift quasars for understanding early SMBH growth and
2011; Bañados et al. 2018c; Wang et al. 2021b) that must be evolution. Radio-loud refers to quasars with rest-frame 5 GHz
accounted for by theoretical models. Grappling with this flux densities significantly greater than rest-frame optical flux
challenge requires not only measuring quasar accretion rates, densities; more formally, those quasars with radio-loudness
but also identifying mechanisms being used to produce massive parameter R = fν(5 GHz)/fν(4400 Å) 10 (Kellermann et al.
growth. 1989). Although the fraction of radio-loud quasars remains
One of the best ways to study this evolution is through X-ray consistent with redshift (∼10%; Bañados et al. 2015), these
observations, where the emission is produced in the innermost objects remain effectively unstudied at high redshift in X-ray
regions of the active galactic nucleus (AGN; Fabian 2016) and wavelengths (see Vito et al. 2019b). As such, characterizing the
where, at high redshifts, the observed energies are less sensitive AGN properties of the earliest radio-loud quasars is a crucial
to intervening obscuration. X-ray observations have been step in revealing quasar growth modes.
effective at investigating even the most distant known quasars One quasar of particular interest is PSO J352.4034−15.3373
(Bañados et al. 2018b), and the results of X-ray studies of the (hereafter PJ352−15), a radio-loud quasar at z = 5.84 ± 0.02
first reported by Bañados et al. (2018a). At its discovery, PJ352
10
NPP Fellow. −15 was the radio-loudest quasar known at redshifts z 6 by
1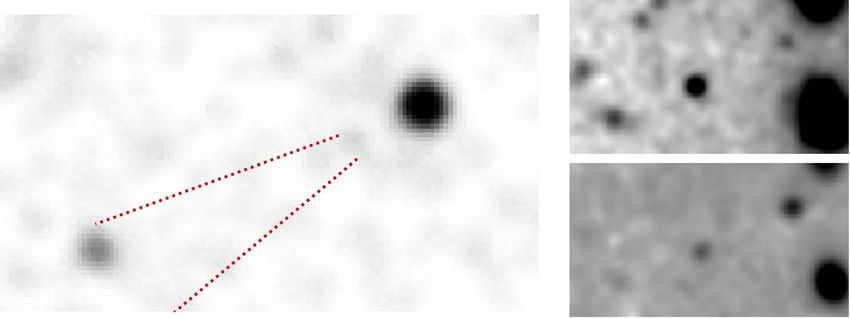
The Astrophysical Journal, 911:120 (12pp), 2021 April 20 Connor et al.
Table 1 followed standard procedures (e.g., Connor et al. 2020),
Chandra Observations beginning with reprocessing using the chandra_repro script
Obs ID Exposure Time Start Date Roll Angle with standard grade, status, and good time filters and with
(ks) (YYYY mm dd) (°) VFAINT background cleaning. As part of the standard
reprocessing, events were processed with the Energy Depen-
21415 41.52 2019 Aug 19 88
21416 19.06 2019 Sep 16 359
dent Subpixel Event Repositioning (EDSER) routine (Li et al.
22728 59.28 2019 Aug 21 88 2004); because of this reprocessing of the on-axis observations,
22729 45.46 2019 Aug 24 88 and to enable more detailed physical modeling, all X-ray
22730 38.24 2019 Aug 25 88 images in this work are presented at half-pixel (0 246)
22850 31.44 2019 Sep 17 359 resolution (and all images presented are of the combined seven
22851 29.88 2019 Sep 22 350 observations). To allow for accurate spatial analysis by
minimizing positional uncertainties, we first aligned all
observations with Obs ID 22728, our deepest exposure. This
an order of magnitude, with R > 1000, although a recently alignment was done with a combination of WAVDETECT
discovered blazar at z = 6.10 ± 0.03 has a similar radio- (Freeman et al. 2002) and the CIAO tools wcs_align and
loudness (Belladitta et al. 2020). High-resolution very long wcs_update.
baseline interferometry (VLBI) radio imaging using the Very We used the CIAO script merge_obs to generate coadded
Long Baseline Array (VLBA) revealed the presence of linear images from the seven observations. Images were generated in
structure at the quasar’s position over 1.62 kpc (0 28), divided the soft (0.5–2.0 keV), hard (2.0–7.0 keV), and broad
into three distinct components (Momjian et al. 2018). Whether (0.5–7.0 keV) bands; the image of PJ352−15 in the broad
these structures originate from a radio core with a one-sided jet band is shown in the left panel of Figure 1. No significant
or instead indicate a compact symmetric object is unclear with structure is readily apparent within ∼15″ (∼85 kpc) of the
the currently published data,11 but it is clear that in addition to quasar. For spectroscopic analysis of PJ352−15, we use a 2 0
being radio-loud, PJ352−15 also hosts kiloparsec-extended circular aperture centered on the coordinates from Bañados
radio jets. Because of these properties, PJ352−15 is an et al. (2018a), which align with the X-ray centroid (Figure 1).
excellent target for X-ray analysis; indeed, as discussed below, The background was extracted from a concentric annulus with
X-rays are potentially the best mechanism for detecting inner and outer radii of 25″ and 38″, respectively. Source and
extended jet structures at this redshift (Fabian et al. 2014). background spectra were created with specextract.
In this work, we present X-ray observations of PJ352−15
with Chandra. We discuss our observations in Section 2 and the
X-ray properties of PJ352−15 in Section 3. In Section 4, we 3. X-Ray Properties of P352–15
introduce the concept of inverse Compton (IC) emission from +12.3
the cosmic background and detail several methods we used to We detect PJ352−15 in a 2 0 radius aperture with 120.3- 11.2
+10.1
detect this emission. We further describe the properties of the net counts in the broad band (0.5–7.0 keV), 80.9-9.1 counts in
+7.6
detected extended emission in Section 5. Finally, we the soft band (0.5–2.0 keV), and 39.3- 6.6 counts in the hard band
contextualize these results in Section 6. Throughout this work, (2.0–7.0 keV), with all uncertainties calculated using the method
we adopt a quasar redshift of z = 5.831 based on observed of Gehrels (1986). From these values, and using the Bayesian
[C II] λ158 μm emission (S. Rojas-Ruiz et al. 2021, in methodology described by Park et al. (2006), we derive a
+0.08
preparation) and a Galactic neutral hydrogen column density of hardness ratio, 12 for PJ352−15 of = -0.34- 0.09 . As a
NH = 1.68 × 1020 cm−2 in the direction of PJ352−15 (HI4PI simple flux ratio, the hardness ratio allows for an easy
Collaboration et al. 2016). We use a flat cosmology with comparison between sources with few detected counts, as is
H0 = 70 km s−1 Mpc−1, ΩM = 0.3, and ΩΛ = 0.7; the scale at common for high-redshift quasars (Vito et al. 2019b).
this redshift is 5.80 kpc arcsec-1 . All distances given are in However, for comparisons between quasars observed with
proper distances and errors are reported at the 1σ (68%) different observatories or at different times, the relative
confidence level unless otherwise stated. differences in effective area need to be considered, and a
spectral fit, when available, is thus more informative.
Spectroscopic analysis was performed using the Python-
2. Observations and Data Reduction based implementation of XSPEC v12.10.1 (Arnaud 1996),
We observed PJ352−15 with the Advanced CCD Imaging PyXspec. We did not bin our spectrum, and instead used
Spectrometer (ACIS; Garmire et al. 2003) on Chandra. the modified C-Statistic (C; Cash 1979; Wachter et al. 1979)
Observations were conducted across seven separate visits to find the parameters of the best fit. We fit the spectrum
spread across five weeks, with a total exposure time of with a multiplicative combination of a power law and
264.88 ks. Details of the seven visits are given in Table 1. In all Galactic foreground absorption using the XSPEC model
observations, events were recorded in the Very Faint telemetry phabs × powerlaw. Here, the Galactic absorption NH was
format and with the Timed Exposure mode. Chandra was frozen at its adopted value (1.68 × 1020 cm−2), but the slope
positioned so that PJ352−15 appeared on the back-illuminated and normalization of the power law were allowed to vary. With
S3 chip during our observations. two free parameters, 1σ uncertainties include all values with
Data reduction was performed using the Chandra Interactive C-statistic values within ΔC 2.30 of the overall best fit. We
Analysis of Observations software package (CIAO; Fruscione used the Monte Carlo routines within XSPEC to evaluate the
et al. 2006) v4.11 with CALDB version 4.8.4.1. Reduction 1σ uncertainties of all parameters.
11 12
Follow-up multifrequency VLBI analysis should address this ambiguity (E. = (H - S ) (H + S ), where H and S are the net counts in the hard
Momjian et al. 2021, in preparation). (2.0–7.0 keV) and soft (0.5–2.0 keV) bands, respectively.
2The Astrophysical Journal, 911:120 (12pp), 2021 April 20 Connor et al.
Figure 1. Left: 0.5–7.0 keV Chandra observation of PJ352−15, smoothed by a Gaussian kernel of width 0 75. The 2 0 radius extraction region used for photometry
and spectroscopy is indicated by the red circle. Right: X-ray spectrum of PJ352−15. Data (dark gray) are binned for ease of display, but were not binned during fitting.
The best-fitting spectrum is shown in red, while 100 spectra with ΔC 2.30 from our Monte Carlo analysis are shown in gray. The background spectrum is shown in
dark gray error bars at the bottom.
From our spectral fitting, we find the emission is Table 2
+0.29
characterized by a power law of slope G = 1.99- 0.28 . This
X-Ray Properties
value is typical for quasars even up to z ∼ 6 (Nanni et al. 2018). Parameter Value Units
Including the uncertainties in the normalization of the power +12.3
law, this translates to a rest-frame 2.0–10.0 keV unabsorbed Net Counts 120.3- 11.2 L
+10.1
+0.45
luminosity of L 2 – 10 = 1.26- -1 L
0.33 ´ 10 erg s . This best fit is
45 Soft Counts 80.9- 9.1
+7.6
shown in Figure 1, as are 100 of the spectra explored by our Hard Counts 39.3- 6.6 L
+0.08
Monte Carlo analysis that have ΔC 2.30. The X-ray -0.34- 0.09 L
+0.29
properties of the quasar are summarized in Table 2. Γ 1.99- 0.28 L
L2–10 1.26-+0.45
0.33 ´ 10
45 erg s−1
F0.5–2.0 2.8-+0.6
0.5 ´ 10 -15 erg s−1 cm−2
4. Evidence for Inverse Compton/Cosmic Microwave F0.5–7.0 5.5-+0.9
0.8 ´ 10
-15 erg s−1 cm−2
Background Lν(2 keV) +1.11
1.62-0.66 ´ 10 27 erg s−1 Hz−1
PJ352−15 is the source of the most distant extended Lν(2500 Å) +1.2
9.8- 1.1 ´ 10
30 erg s−1 Hz−1
(kiloparsec-scale) radio jets yet seen (Momjian et al. 2018; αOX −1.45 ± 0.11 L
but see also Spingola et al. 2020), and it is therefore an ideal
candidate to investigate the potential for IC interactions
between relativistic particles in jets and the cosmic microwave
background (CMB). IC/CMB has long been associated with proposed that if jets are primarily emitting through IC/CMB in the
the X-ray emission seen with jets, dating back to the first early universe, this could allow the growth of observed z 7
observations with Chandra (Chartas et al. 2000; Schwartz et al. SMBHs from stellar mass seeds. Direct detection of this effect
2000), although a number of issues have been raised against is therefore of great importance to the understanding of SMBH
possible detections of this effect at low redshifts (Meyer et al. growth.
2015; Breiding et al. 2017). In recent years, a number of studies have begun looking for
As a simple model, IC/CMB occurs when a relativistic extended X-ray emission around high-redshift AGN, but clear
particle in a jet interacts with a CMB photon; the interaction evidence has not yet been seen in the first billion years of the
depletes energy from the jets while also scattering the CMB universe. Paliya et al. (2020) reported detecting seven blazars at
photons to X-ray energies. The energy density of the CMB 3.1 z 4.7 with extended emission seen by Chandra, and
scales as (1 + z)4, meaning that not only is the effect of Napier et al. (2020) detected two extended structures on
cosmological dimming countered, but at higher redshifts it opposite angles of a z = 4.26 radio galaxy. While Nanni et al.
becomes more likely that the CMB should dominate over (2018) identified a potential extended component associated
magnetic fields in lobes as a mechanism for particles to radiate with a z = 6.31 quasar, further analysis by Gilli et al. (2019)
energy. Jets can extract rotational energy from the accretion found that the reported emission is associated with a
disk (e.g., Blandford & Payne 1982), meaning that jets can foreground structure. Finally, Fabian et al. (2014) reported
enable accretion beyond the Eddington limit, and, in the two potential structures around a z = 7.1 quasar, but were
context of high-redshift quasars, allow for more rapid growth unable to rule out this being caused by source confusion in
(Ghisellini et al. 2013). While the dearth of radio jets at large the XMM-Newton observations. In this section, we describe
redshifts has been noted (Ghisellini et al. 2015), Fabian et al. (2014) our efforts to search for extended X-ray emission around
3The Astrophysical Journal, 911:120 (12pp), 2021 April 20 Connor et al.
PJ352−15, thereby probing potential jet-assisted growth of Therefore, with an expected background of surface brightness
early quasars. ΩB (in units of counts arcsec−2), the background subtracted
azimuthal density is
4.1. Presence of Extended Structure
In addition to looking for potential X-ray signatures of the
r (q ) - rB = å Wi (q) / AW - WB . (3 )
i
radio-detected jets, we also looked for possible indications of
an X-ray bright jet extending beyond the radio emission, which Uncertainties on this value are estimated by bootstrap
is roughly the size of a single ACIS pixel. Such X-ray resampling of all events that fall within the inner and outer
structures have long been seen around some AGN (for a radii of the annulus of interest, including the δ term. The
review, see Harris & Krawczynski 2006). While X-ray distribution of the azimuthal X-ray emission density is shown
components often overlap with radio emission in AGN jets in Figure 2.
(e.g., Jimenez-Gallardo et al. 2020), this is not always the case; A clear peak is seen in Figure 2, corresponding to a position
Schwartz et al. (2020), for example, recently reported X-ray angle of −55° E of N. In comparison, the jets seen by Momjian
detected jet candidates around z ∼ 3.2 quasars with no et al. (2018) are at −61° E of N. From the bootstrapped
corresponding radio emission. Likewise, a serendipitous uncertainties, this excess is a 3σ detection of faint structure (top
discovery of a quasar X-ray jet at z = 2.5 by Simionescu panel of Figure 2). It should be noted that these uncertainties do
et al. (2016) extends for ∼100 kpc, while radio emission is only not include the effects of systematic choices—the values of ri,
seen out to 10 kpc from the central AGN. In the context of ro, and f, as well as the energy range used. However, we find
IC/CMB, for a jet of fixed magnetic field, the relative flux qualitatively similar (3σ) results when using an annulus of
densities between X-ray and radio emission scales as either 3 0–15 0 or 5 0–10 0 or when setting f ä [5°, 12°].
SX/Sr ∝ (1 + z)4 (Carilli & Taylor 2002), and so, at higher Similarly, relaxing the binary restriction on Wi(θ), by setting
redshift, the X-ray flux will become easier to detect than the Wi(θ) = 0.5 and Wi(θ) = 1.0 for photons in the wedge with and
radio component. Conversely, it is also not uncommon for without including positional uncertainties, respectively, pro-
radio and X-ray components of jets to be spatially offset, duces no meaningful change in our results. Due to the paucity
implying their emission is generated from synchrotron emis- of counts, the significance of this detection is maximized in
sion from separate populations of jetted particles (e.g., Reddy the broad energy band (0.5–7.0 keV), but the peak remains at
et al. 2021); however, for such a scenario, we would expect the 2σ–3σ significance in the soft and hard bands.
X-ray component to be stronger upstream in the jet relative to Enhanced X-ray emission is only seen in the NW direction
the radio components over large scales (e.g., Siemiginowska of the quasar; in the context of other X-ray imaging studies, the
et al. 2007). lack of emission from the counter-jet is common. In a flux-
As a cursory inspection of the area around the quasar in limited sample of 56 quasars with radio jets at z 2, Marshall
X-rays (shown in Figure 1) does not reveal any structure, we et al. (2018) report 33 have X-ray jets but none have visible
turn to a statistical test to search for excess emission oriented counter-jets. While tentative hints of X-ray emission from jets
along the jet axes. If present, X-ray jets would manifest as have been seen in quasars up to redshifts z 4.7 (Paliya et al.
additional X-ray emission outside of the quasar point-spread 2020; Napier et al. 2020), and from jets of similar sizes
function (PSF; see Section 4.3) and at position angles of (50 kpc) up to redshifts z 3.7 (Simionescu et al. 2016;
∼−60° and/or ∼120°, the angle and counter-angle of the jets Worrall et al. 2020), this observation represents the most
reported by Momjian et al. (2018). To quantify this, we distant quasar with 3σ evidence for a projected X-ray jet.
calculate ρ(θ), the azimuthal X-ray density profile (e.g., Connor
et al. 2018), summing over all X-ray events such that 4.2. X-Ray Loudness
We also evaluate αOX, the logarithmic ratio of monochromatic
r (q ) = å Wi (q). (1 )
luminosities between rest-frame X-ray and UV13 for PJ352−15.
i
We calculate Lν(2 keV) directly from the best-fit power law,
Here Wi(θ) is a Boolean value that evaluates to 1 if event i is accounting for redshift corrections following Stern et al. (2000),
+1.11 27 erg s-1 Hz-1. To calcu-
within an angular wedge centered on angle θ and within the finding L n (2 keV) = 1.62- 0.66 ´ 10
wedge’s inner and outer radii and to 0 otherwise. The wedge is late Lν(2500 Å), we use the AB 1450 Å absolute magnitude
defined by its opening angle (f = 10°) and inner (ri = 5 0) and given by Bañados et al. (2018a), M1450 = −25.59 ± 0.13, and
outer (ro = 12 0) radii. scale that to 2500 Å assuming fn µ n an , where, per Bañados
Although these observations were processed with EDSER to et al. (2018a), we adopt αν = −0.5. From this, we calculate
−1
allow for event positioning to better precision than the size of L n (2500 Å) = 9.81.2
-1.1 × 10 erg s
30
Hz−1 and a corresponding
an ACIS pixel, there is still an inherent uncertainty in where value of αOX = −1.45 ± 0.11.
events were recorded. Based on the work of Li et al. (2003), we A number of observational studies have shown a relationship
assume that all events have an inherent uncertainty in position between Lν(2500 Å) and αOX, such that, for increasing
of δ = 0 125 in both axes despite their repositioning. As such, ultraviolet monochromatic luminosity, the relative strength of
we set Wi(θ) = 1 for events that, if shifted within ±δ in X and/ the X-ray luminosity declines (e.g., Vignali et al. 2003;
or Y positions, would fall within the wedge. The total area of Strateva et al. 2005; Steffen et al. 2006). Using the best-fit
the wedge is thus scaling relation for radio-quiet quasars of Lusso & Risaliti
(2016), we would expect a value of αOX = −1.65 given the
fp ultraviolet luminosity of PJ352−15. Our measured value is
AW = ((ro + d )2 - (ri - d )2 ) + 2d (ro + 2d - ri ).
360 13
αOX = 0.3838 × log (L n (2 keV) L n (2500 Å)), where Lν is the monochro-
(2 ) matic luminosity.
4The Astrophysical Journal, 911:120 (12pp), 2021 April 20 Connor et al.
Figure 2. Left: angular overdensity of broad (0.5–7.0 keV) emission in an annulus of radii 5 0–12 0 centered on the quasar. Counts are summed in wedges of
angular size 10° and the contribution from the background is subtracted, as described in the text. The overdensity and its 1σ uncertainty range are marked by the red
line and the gray filled region, respectively. We highlight the position angle −55° and its complement 125°; this is where excess emission is detected, while Momjian
et al. (2018) report jets at a position angle of −61°. The ratio between this emission and its uncertainty is shown in the top panel; the signal is stronger than 3σ at −55°.
Right: broadband sky image of PJ352−15, showing the extraction region (red, centered on θ = 0°) and the 5 0–12 0 annulus. Photons detected outside this annulus
are lightened for presentation purposes. The resolved radio structure has an overall linear extent of 0 28 (1.62 kpc), a size equivalent to one pixel in the X-ray image.
Figure 3. Offsets from the best-fit αOX relation as a function for radio-loudness for PJ352−15 and a sample of radio-loud quasars from Miller et al. (2011). Predicted
values of αOX were calculated using the nominal relation of Lusso & Risaliti (2016). Points are colored by redshift, with higher-redshift quasars being redder, as
indicated on the color bar. Note that to conform to the catalog of Miller et al. (2011), radio-loudness in this figure is with respect to the monochromatic luminosity at
2500 Å, not 4400 Å.
offset from this prediction by ΔαOX = 0.19 ± 0.11. For this best fit of Lusso & Risaliti (2016). We show in Figure 3 how
offset, the uncertainty accounts for changes in both the this value of ΔαOX compares to a broad sample of radio-loud
predicted and calculated αOX with changing Lν(2500 Å), but quasars collected by Miller et al. (2011); note that, as the values
it does not include the uncertainties and intrinsic scatter in the of R given in that work are based on fν(2500 Å) and not
5The Astrophysical Journal, 911:120 (12pp), 2021 April 20 Connor et al.
fν(4400 Å), we adjust the value of R for PJ352−15 for this plot, The results of this exercise are shown in the bottom panels of
again extrapolating from M1450 assuming αν = −0.5. Figure 4. We detect no statistically significant deviation from
As can be seen in Figure 3, PJ352−15 is not particularly the expectation of a quasar PSF with a stochastic background.
X-ray overluminous in the context of radio-loud quasars. For While Chandra provides unparalleled angular resolution for
further comparison, we consider PSO J0309 + 27, the z = 6.1 X-ray observations, our technique is nevertheless insensitive to
blazar (Belladitta et al. 2020). That quasar has a similar UV features smaller than ∼4 kpc at the redshift of PJ352−15
luminosity to PJ352−15 (M1450 = −25.1) but is less X-ray (0 738). In comparison, the radio structures reported by
overluminous (αOX ∼ −1.6, converting from the 10 keV-based Momjian et al. (2018) have a maximum angular extent of 0 28.
a˜ OX following Ighina et al. 2019). Miller et al. (2011) argued
that the lack of redshift evolution seen in ΔαOX for radio-loud
4.4. Potential Secondary Source
quasars was indicative that IC/CMB only produced, at most, a
minor contribution to the X-ray emission from these quasars. In our initial analysis of the X-ray observations, we detected
As it stands, neither of the two radio-loudest quasars known in a secondary source near the position of the quasar. This source
the early universe show enough X-ray emission to contrast with is located ∼19″ (∼115 kpc at the redshift of the quasar) from
that argument. PJ352−15 at a position angle of ∼115°. This angle is roughly
the counter-angle of the jets identified by Momjian et al. (2018)
and the extended X-ray emission reported in Section 4.1. This
4.3. Point Source or Extended Emission source is dominated by hard energy photons, with a hardness
If jets are producing excess X-ray emission around PJ352 ratio of = 0.0 0.3 from ∼20 ± 5 detected counts.
−15, this could potentially manifest as a deviation from the Chandra observations of PJ352−15 and this source are shown
predicted Chandra PSF, assuming the jets are sufficiently in the main panel of Figure 5. While there is no corresponding
separated from the AGN. To test this possibility, we compare source in the Pan-STARRS1 imaging catalog (Chambers et al.
the observed quasar in three bands—soft (0.5–2.0 keV), broad 2016), this object is coincident with a faint source (∼60 μJy) in
(0.5–7.0 keV), and hard (2.0–7.0 keV)—to a simulated PSF for 3 GHz imaging (Bañados et al. 2018b). From the deep X-ray
these observations. Any significant deviations, as characterized and optical survey results of Marchesi et al. (2016), a source
by the binomial probability of structure in the observations with this X-ray flux and hardness and with no optical flux in
being caused by random samplings of the PSF and background, Pan-STARRS1 imaging being detected within 30″ of PJ352
would be indicative of X-ray emission outside of the central −15 is at least a ∼2σ occurrence.
point source. To constrain the properties of this source, we imaged the
For all seven observations given in Table 1, we used MARX field in both the near-infrared and optical regimes. For the
(Davis et al. 2012) to simulate our observed point source. The former, we used MOSFIRE (McLean et al. 2010, 2012) on the
input source spectrum was derived from our best-fit parameters, Keck I telescope to obtain J-band images. We observed the
but with a normalization 100 times larger to produce more field on UT 2020 July 2 for 14 52.4 s exposures (733.6 s total).
photons. We did not include the effects of the readout streak or Images were combined and processed with the AstrOmatic
of pileup. Each observation was simulated 100 times, so that, in software suite (Bertin & Arnouts 1996; Bertin et al. 2002;
total, we produced ∼10,000 simulated photons for every Bertin 2006) following standard reductions with IRAF. For
observed photon. We adopt an aspect blur of 0 28 to account optical imaging, we observed in the r ¢ band with the GMOS-N
for uncertainties in the aspect solution, following the imager (Hook et al. 2004) on the Gemini-North telescope as
recommendations of the Chandra X-ray Center for ACIS-S part of program GN-2020B-FT-101. Seven 423 s observations
observations.14 The simulations were facilitated with the CIAO (2961 s total) in a filled-hexagon dither pattern were taken in
task simulate_psf. Output events files were processed with queue mode on UT 2020 July 28. Data were reduced using the
the EDSER algorithm to be consistent with our observations. DRAGONS package (Labrie et al. 2019) following standard
The observed quasar and simulated PSFs are shown in procedures. For both sets of observations, flux calibrations
Figure 4; due to the use of EDSER in both data sets, bin were performed by comparing other objects in the field to their
sizes shown are half of an ACIS pixel, or 0 246 on a side. reported photometry in 2MASS (J; Skrutskie et al. 2006) and
To evaluate the probability of deviations from the PSF, we Pan-STARRS1 (r ¢ ; Chambers et al. 2016). Photometry was
compare our observations to these models, quantifying extracted in 1 0 radius apertures, with backgrounds drawn in
deviations using the binomial probability that the flux in a 3 0–6 0 concentric annuli. Both observations are shown in the
bin is consistent with the expectation of the overall background right of Figure 5.
plus the contribution of the PSF at that location. We follow the At the redshift of PJ352−15, Lyα is at ∼8300 Å, and so all
methods outlined by Weisskopf et al. (2007) and Lansbury emission observed in the r ¢ filter will be attenuated by
et al. (2014), namely, that the probability of N counts arising by absorption from intervening neutral gas (the Lyα forest). With
chance given an expectation of NB background counts can by the small projected separation between PJ352−15 and the
expressed as secondary object, if they are both at z ≈ 5.83 we would expect
the same level of attenuation to be observed for both objects.
¥
NBi -NB As such, the color difference between the two objects, Dr ¢- J ,
P (N ) = å i!
e . (4 ) should only reflect the innate color differences of the two
i=N objects. If no reasonable spectral model can explain the
observed values of Dr ¢- J , then the objects must be being seen
Here, both NB and N are evaluated in a 3 × 3 bin region through different Lyα forests, and we can rule out this object as
centered on the bin of interest. being at the redshift of PJ352−15.
From this photometry, we find that PJ352−15 has an r′ − J
14
https://cxc.cfa.harvard.edu/ciao/why/aspectblur.html color of 4.5 mag (r ¢ = 25.8 0.2, J = 21.3 ± 0.1; all
6The Astrophysical Journal, 911:120 (12pp), 2021 April 20 Connor et al.
Figure 4. Comparisons between the observed quasar (top row) and a simulated PSF at that location (center row), with the binomial probability of any signal arising
from the combined PSF and background (bottom row and color bar), as described in the text. The soft (left), broad (center), and hard (right) bands are independently
evaluated. All images cover 4 0 × 4 0 fields of view centered on the peak of emission. No statistically significant deviation from the point source expectation is seen.
magnitudes are AB). In contrast, the secondary object has a companion AGN. We also consider the possibility that this
color of r ¢ - J = 0.3 mag (r ¢ = 24.6 0.2, J = 24.3 ± 0.2). source is a hot spot on the counter-jet, and that we are seeing
As such, they cannot be at the same redshift and have the same rest-frame optical and UV emission from star formation.
spectral shape, so we rule out the possibility that this is a Indeed, star formation triggered on radio jets has been seen for
7The Astrophysical Journal, 911:120 (12pp), 2021 April 20 Connor et al.
Figure 5. Multiwavelength observations of the area around PJ352−15, showing the broad X-rays (left), r ¢ (top right), and J (bottom right). All images show the same
field of view, with north pointing up and east to the left, and a 5″ scale bar is shown for reference. An object (bottom left of all panels) is seen in X-rays ∼100 kpc from
the quasar (top right of all panels) at the counter-angle of the jets (position angles of 110° and 130° are indicated by the dotted lines, for reference); both objects are
indicated in all images by red reticles. This source is also seen in the observed optical and NIR imaging, as discussed in the text. Additional sources present in the r ¢
and J images have no X-ray counterparts.
decades (van Breugel et al. 1985), and this effect is predicted to Using PyXspec, we fit the observed emission to an
be common in the early universe (Croft et al. 2006), although absorbed power-law model, phabs × powerlaw. The best
previous results have not seen star formation triggered so far fit of this emission comes when Γ ∼ 4 and L2–10 ∼ 3 ×
from the quasar (Nesvadba et al. 2020). To test this possibility, 1044 erg s−1. With Γ and the power-law normalization allowed
we use the synphot Python package to model the expected to vary, we have two free parameters, and, with so few
observed photometry of a quasar (using the template of counts, the uncertainties on our fit are significant. Indeed, the
Abazajian et al. 2004) and a 45,000 K blackbody (a rough hardness ratio, = 0.1- +0.5
0.4 , is harder than that of PJ352−15
approximation of a star-forming region), both at z = 5.83. The +0.08
( = -0.34-0.09 ), implying Γ < 2. Despite the uncertainties,
expected color difference between a quasar and a star-forming we do find some constraints on the observed emission.
region, Dr ¢- J ~ 1.5, is not consistent with what is observed Assuming that Γ ∼ 2 (e.g., Harris & Krawczynski 2006), the
(Dr ¢- J ~ 4.2), which rules out the possibility that this object is
1σ expectation of our fit is that this potential jet component
at the redshift of the quasar.
has a luminosity of L2–10 1044 erg s−1, and we can conclu-
sively rule out jet emission of L2–10 1045 erg s−1. The full
5. Properties of the Extended Emission confidence intervals are shown in Figure 6.
As a comparison, we consider the sample of X-ray jet
In Section 4.1 we identified extended structure in the X-ray
properties described by McKeough et al. (2016); this sample
observations to the NW of the quasar position. While without a
comes from Chandra imaging of 11 intermediate-redshift
redshift measurement we cannot conclusively confirm a
(2.1 z 4.7) quasars known to host radio jets. In that work,
connection with PJ352−15, it is the strongest evidence of
X-ray emission from jets that we see around this quasar. McKeough et al. (2016) fit absorbed power laws to observed jet
Although only a limited number of photons with which to emission, including multiple regions for three quasars. From
analyze this source are available, constraining the properties on those fits we derive rest-frame luminosities for comparison
this emission nevertheless sets limits on the strength of X-ray using XSPEC. We note that, as the covariances between Γ and
emission from one of the two radio-loudest quasars yet normalization are not given for these fits, we calculated
observed in the first billion years of the universe. To that uncertainties in luminosity at the extreme values of both
end, we present the observed properties of the X-ray parameters, and therefore these uncertainties are most likely
enhancement, assuming a redshift of z = 5.831. overestimates. The observed properties of these jets are shown
We extract a spectrum from a 2 0 radius region centered on in the right panel of Figure 6.
23:29:36.35, −15:20:09.6. This region, which is ∼50 kpc from Assuming that this emission is not driven by a source with
the centroid of the quasar emission, is shown in Figure 6. We an extreme power-law spectral index (Γ 5), PJ352−15 is not
note that, while there is a galaxy to the NW of PJ352−15 host to the most X-ray luminous jets in the z > 2 universe. In
visible in the optical imaging shown in Figure 5, the entirety of contrast, for a steeper spectral slope, the high predicted
our extraction region is outside of the full extent of the galaxy luminosity is caused by extrapolating a poorly constrained
in our r ¢ and J images, and no source is detected at this position spectrum into unobserved energy ranges (e.g., Connor et al.
in either band (to 3σ limits of J > 24.3, r ¢ > 26.2). The 2020) and is not indicative of an expected relation between Γ
+4.6
extraction region has 7.8- 3.5 net counts, with a hardness ratio of and L2–10. As can be seen in Figure 3, PJ352−15 is not an
+0.5
= 0.1-0.4 . We compute a binomial probability of this outlier in radio-loudness among the broad population of
emission being produced by the background for three bands: quasars; the only reason we would expect this emission to be
soft (p = 0.020), hard (p = 0.021), and broad (p = 0.0015). large is due to the (1 + z)4 scaling of the CMB energy density.
8The Astrophysical Journal, 911:120 (12pp), 2021 April 20 Connor et al.
Figure 6. Left: smoothed X-ray image showing the diffuse emission to the NW of PJ352−15 identified in Section 4.1. The energy range (0.75–5.0 keV), smoothing
scale, and contrast have been chosen to best highlight this emission for presentation purposes. Our 2 0 radius spectral extraction region is indicated by the dashed red
circle. Right: values of Γ and L2–10 for the diffuse emission, colored by offset from the best-fitting C value. Equivalent values to 1σ, 2σ, and 3σ are indicated by
contour lines. A comparison sample of jets observed around intermediate-redshift (2.1 z 4.7) quasars known to host radio jets from McKeough et al. (2016) is
shown with gray points.
Following Lucchini et al. (2017), we calculate an equivalent normalization of the X-ray spectral fit), then from
magnetic field to the CMB’s energy density as Equation (6) we find an expected source magnetic field
of 6 μG. This is a typical magnetic field strength for diffuse
BCMB = 3.26 (1 + z)2 Gjet mG, (5 ) lobes of extragalactic radio sources (Miley 1980) and is
where Γjet is the bulk Lorentz factor, finding BCMB = significantly lower than the value of ∼3.5 mG reported for the
inner kiloparsec of the quasar by Momjian et al. (2018). Deeper
152 Γjet μG at this redshift. If magnetic field strengths inferred
radio observations are required to test if there is a radio
from radio synchrotron measurements are less than this value counterpart to this possible X-ray knot around PJ352−15.
then particle cooling should be dominated by X-ray IC
processes. While values of Γjet ∼ 10 have been seen at z > 5
(e.g., Frey et al. 2015), the VLBI analysis of Momjian et al. 6. Discussion
(2018) did not find evidence for such fast outflows in this
In this work, we have presented analysis of X-ray
system, and so we adopt a conservative Γjet ∼ 1. For a jet of
observations of PJ352−15. In addition to the X-ray properties
relativistic particles with X-ray emission caused by interaction
of the quasar itself, we also conducted a search for evidence of
with the CMB at redshift z and radio emission driven by a IC/CMB emission. Here, we discuss our results in the context
magnetic field of strength B, the relative X-ray and radio flux of the broader perspective of high-redshift SMBH growth,
densities can be found through AGN emission, and radio activity around quasars
2 One of the primary goals of this investigation was to search
⎛ Sr nr ⎞ = 1 ⎛⎜ B ⎞⎟ (1 + z)-4 ,
⎜ ⎟ (6 ) for evidence of extended jets as an indicator of enhanced
⎝ SX n X ⎠ 2.89 ⎝ mG ⎠ accretion rates for high-redshift quasars. Jolley & Kuncic
(2008) presented a model (see also Ghisellini et al. 2013; Jolley
where SX and Sr are the X-ray and radio flux densities at et al. 2009) wherein a magnetic torque on the accretion disk
observed frequencies νX and νr, respectively, and Sr ∝ ν is extracts energy that is then injected into a magnetized jet. As
assumed (Carilli & Taylor 2002). the jet transports a minimal amount of mass but a more
To constrain the radio emission, we examine archival substantial amount of angular momentum, the net effect of this
observations of PJ352−15 taken with NSF’s Karl G. Jansky model is that the jet enhances the mass accretion rate, allowing
Very Large Array (VLA) at 3 GHz in 2018 January (Bañados for more significant growth than would be possible without the
et al. 2018a). We reprocessed these observations using standard jet. Here, the model postulates that the jet is powered by
techniques (e.g., Carilli et al. 2019). The resulting image, extraction of energy and momentum from the disk (the
shown in Figure 7, has an rms noise of 9.5 μJy beam−1 and a Blandford–Payne processes; Blandford & Payne 1982) rather
resolution of 2 6 × 1 4 (PA = −13°). The secondary source to than from the spin-energy of the black hole (the Blandford–
the SE of the quasar discussed in Section 4.4 has a nominal Znajek mechanism; Blandford & Znajek 1977), as is
radio counterpart of 60 μJy beam−1 (∼6σ significance). At the commonly invoked at lower redshifts. Because of this
location of the diffuse X-ray emission being discussed here, no distinction, observed relations showing a decline in accretion
radio emission is seen. If we assume this X-ray emission is rate with radio-loudness (e.g., Sikora et al. 2007) driven by
from IC upscattering of the CMB by relativistic electrons, and conditions where jets are powered from the black hole spin
adopting flux densities ofThe Astrophysical Journal, 911:120 (12pp), 2021 April 20 Connor et al.
Figure 7. Smoothed X-ray emission with contours from 3 GHz VLA observations overlaid. Contours are logarithmically spaced at levels of f = 2n × 9.5 μJy beam−1
for n = 1, 2, 3, 4, 5, 6, 7, where 9.5 μJy beam−1 is the rms noise of these data. The secondary object discussed in Section 4.4 is shown in the bottom left of the figure,
while the diffuse emission highlighted in Section 4.1 is indicated here by a dashed orange circle. Negative radio contours are not shown for clarity.
Potentially, this model of jet-enhanced accretion could here, the jets could have extended to ∼50 kpc, and the implied
complement the jet emission models of Garofalo et al. duration of jet launching is, assuming v ∼ 0.3c, of order 1 Myr.
(2010), who present an evolutionary model for radio-loud Recent interferometric observations of the z = 6.1 blazar PSO
AGN, starting with retrograde spins that produce Blandford– J0309 + 27 by Spingola et al. (2020) showed jets with
Payne jets and transitioning to Blandford–Znajek-dominated projected sizes of hundreds of parsecs; while these structures
prograde systems. Prograde systems are more efficient at are potentially larger given the viewing angle, they, in addition
converting accreting mass to jet energy (Tchekhovskoy & to the observations of Momjian et al. (2018), are in contrast to
McKinney 2012), so the presence of large jets around a the limited effect of jets predicted by Regan et al. (2019) and
retrograde SMBH could indicate significant amounts of further support the notion that these jets could be aiding in
accretion have occurred. As black hole spin measurements at accretion.
these redshifts are beyond the capabilities of current observa- Recently, Schwartz et al. (2020) reported two candidate
tories (although see Gnedin et al. 2015, who postulate that X-ray jets at intermediate redshifts (z ∼ 3.2) found using a
ULAS J1120+0641 at z = 7.08 has a retrograde spin), a direct technique similar to that employed here in Section 4.1.
test of this hypothesis is not currently possible. Nevertheless, Although these jets are along a line connecting quasar cores
this scenario does present a case in which jet emission could to radio emission, they have no associated radio emission of
enable the rapid buildup of SMBHs needed to reconcile their own. Similarly, X-ray emission associated with a z ∼ 4.3
observed quasar populations with theoretical models of seed quasar reported by Siemiginowska et al. (2003) has no
formation. corresponding radio emission. For these three jets, the X-ray
Simulations provide some context to the role of jet feedback luminosities are of order L2–10 ∼ 1045 erg s−1, slightly higher
in regulating AGN growth in the early universe. Recently, than what we found here. While individually less compelling,
Regan et al. (2019) simulated the formation of an SMBH the combination of all four reports of X-ray emission paints a
through a metal-free supermassive star that directly collapses picture wherein jets around intermediate- and high-redshift
into a ∼104 Me black hole. Immediately after the collapse, quasars may be hiding without associated detections of radio
mechanical feedback is turned on in the form of jets; these jets emission. If this is the case, only deep X-ray observations of
suppress accretion, driving the black hole growth to sub- radio-loud high-redshift quasars will enable a meaningful
Eddington values, but their effect is limited to the inner 0.1 pc. insight into this population.
In contrast, Takeo et al. (2020) simulated both radiative and
mechanical feedback from a black hole of initial mass 105 Me 7. Summary
and found that, after around one dynamical timescale
We have presented deep (265 ks) X-ray observations of
(∼8.4 × 10⁶ yr), a cascade of neutral gas along the equatorial
PJ352−15, one of the two radio-loudest quasars observed in
region drives major outflows in the polar region. The balance
the first billion years of the universe (z > 5.6; see also Belladitta
found in this simulation is one of hyper-Eddington accretion
et al. 2020). As part of our analysis, we have also obtained
and an evacuation of gas along the poles.
optical and NIR imaging of the quasar and its surroundings.
In contrast, the VLBI observations of jets presented by
Our primary results are:
Momjian et al. (2018) provide direct evidence that the jets
around PJ352−15 have, at least, extended beyond 1 kpc from 1. We fit the X-ray properties of the quasar itself, which is
the SMBH itself. From the candidate jet emission reported detected with over 100 counts; adopting an absorbed
10The Astrophysical Journal, 911:120 (12pp), 2021 April 20 Connor et al.
power-law model, we find the AGN emission is fit with Foundation (United States), National Research Council
+0.29
G = 1.99- 0.28 , and it has a corresponding unobscured (Canada), Agencia Nacional de Investigación y Desarrollo
luminosity of L 2 – 10 = 1.26-+0.45
0.33 ´ 10 erg s .
45 -1 (Chile), Ministerio de Ciencia, Tecnología e Innovación
2. In relation to the quasar’s rest-frame UV emission, the (Argentina), Ministério da Ciência, Tecnologia, Inovações e
observed X-ray luminosity is stronger than expected from Comunicações (Brazil), and Korea Astronomy and Space
the scaling relation for radio-quiet quasars of Lusso & Science Institute (Republic of Korea). Some of the data
Risaliti (2016), with ΔαOX = 0.19 ± 0.11. However, in presented herein were obtained at the W. M. Keck Observatory,
comparison to other radio-loud quasars, PJ352−15 is not which is operated as a scientific partnership among the
an outlier in its X-ray loudness. California Institute of Technology, the University of California,
3. As radio jets have been observed around PJ352−15 and the National Aeronautics and Space Administration. The
(Momjian et al. 2018), we searched for evidence of these Observatory was made possible by the generous financial
jets in X-rays. We found no excess X-ray emission in the support of the W. M. Keck Foundation.
core of the quasar, either in excess luminosity or in This work was enabled by observations made from the Keck
deviations from the expected PSF. We also investigated a and Gemini-North telescopes, located within the Maunakea
nearby (∼19″ offset) X-ray source along the predicted jet Science Reserve and adjacent to the summit of Maunakea. The
axis; follow-up optical and NIR imaging presented here authors wish to recognize and acknowledge the very significant
rule out this emission being at the redshift of PJ352−15. cultural role and reverence that the summit of Maunakea has
4. Through an analysis of the angular overdensity of always had within the indigenous Hawaiian community. We
emission, we identified a peak in the X-ray emission are most fortunate to have the opportunity to conduct
along the observed jet axis, corresponding to a 3σ observations from this mountain and are grateful for the
deviation above the expectation. Further analysis of a 2 0 privilege of observing the universe from a place that is unique
radius region finds that this emission is unlikely to be in both its astronomical quality and its cultural significance.
associated with a background fluctuation, with a binomial Facilities: CXO, Gemini:Gillett (GMOS-N), Keck:I
probability of P = 0.0015. As this emission is at the same (MOSFIRE).
position angle as the previously reported radio emission, Software: BEHR (Park et al. 2006), CIAO (Fruscione et al.
we take this as tentative evidence for X-ray emission 2006), MARX (Davis et al. 2012), PyFITS (Barrett &
from the jets ∼50 kpc from the position of the quasar. Bridgman 1999), Synphot (STScI development Team 2018),
5. Spectral analysis of the jet emission is limited by the WAVDETECT (Freeman et al. 2002), XSPEC (Arnaud 1996).
small number of observed photons in the extraction
region. However, assuming a spectral index similar to ORCID iDs
that found for other jet emission, the overall luminosity is
Thomas Connor https://orcid.org/0000-0002-7898-7664
L2–10 1044 erg s−1.
Eduardo Bañados https://orcid.org/0000-0002-2931-7824
6. The tentative detection of X-ray emission along the jet
Daniel Stern https://orcid.org/0000-0003-2686-9241
axis of PJ352−15 with no radio or optical counterpart is
Chris Carilli https://orcid.org/0000-0001-6647-3861
potentially indicative that this emission is being produced
Andrew Fabian https://orcid.org/0000-0002-9378-4072
by IC interactions of jetted particles with the cosmic
Emmanuel Momjian https://orcid.org/0000-0003-
microwave background. Further, deeper observations are
3168-5922
required to fully test this possibility.
Sofía Rojas-Ruiz https://orcid.org/0000-0003-2349-9310
The depth of the observations required to obtain these results Roberto Decarli https://orcid.org/0000-0002-2662-8803
—and the uncertainties still remaining—provide further Emanuele Paolo Farina https://orcid.org/0000-0002-
support for the need for a new generation of X-ray 6822-2254
observatories, namely, Athena (Nandra et al. 2013) and, Chiara Mazzucchelli https://orcid.org/0000-0002-
hopefully, Lynx (Gaskin et al. 2019) and AXIS (Mushotzky 5941-5214
et al. 2019). Hannah P. Earnshaw https://orcid.org/0000-0001-
5857-5622
The work of T.C. and D.S. was carried out at the Jet
Propulsion Laboratory, California Institute of Technology, References
under a contract with NASA. T.C.ʼs research was supported by
an appointment to the NASA Postdoctoral Program at the Jet Abazajian, K., Adelman-McCarthy, J. K., Agüeros, M. A., et al. 2004, AJ,
Propulsion Laboratory, California Institute of Technology, 128, 502
Arnaud, K. A. 1996, adass V, 101, 17
administered by Universities Space Research Association Bañados, E., Carilli, C., Walter, F., et al. 2018a, ApJL, 861, L14
under contract with NASA. Bañados, E., Connor, T., Stern, D., et al. 2018b, ApJL, 856, L25
The scientific results reported in this article are based on Bañados, E., Venemans, B. P., Decarli, R., et al. 2016, ApJS, 227, 11
observations made by the Chandra X-ray Observatory. This Bañados, E., Venemans, B. P., Mazzucchelli, C., et al. 2018c, Natur, 553, 473
research has made use of software provided by the Chandra Bañados, E., Venemans, B. P., Morganson, E., et al. 2015, ApJ, 804, 118
Barrett, P. E., & Bridgman, W. T. 1999, adass VIII, 172, 483
X-ray Center (CXC) in the application package CIAO. Based Belladitta, S., Moretti, A., Caccianiga, A., et al. 2020, A&A, 635, L7
on observations obtained at the international Gemini Observa- Bertin, E. 2006, adass XV, 351, 112
tory (GN-2020B-FT-101), a program of NSFs NOIRLab, Bertin, E., & Arnouts, S. 1996, A&AS, 117, 393
which is managed by the Association of Universities for Bertin, E., Mellier, Y., Radovich, M., et al. 2002, adass XI, 281, 228
Blandford, R. D., & Payne, D. G. 1982, MNRAS, 199, 883
Research in Astronomy (AURA) under a cooperative agree- Blandford, R. D., & Znajek, R. L. 1977, MNRAS, 179, 433
ment with the National Science Foundation on behalf of Breiding, P., Meyer, E. T., Georganopoulos, M., et al. 2017, ApJ, 849, 95
the Gemini Observatory partnership: the National Science Brightman, M., Silverman, J. D., Mainieri, V., et al. 2013, MNRAS, 433, 2485
11The Astrophysical Journal, 911:120 (12pp), 2021 April 20 Connor et al.
Carilli, C. L., Perley, R. A., Dhawan, V., & Perley, D. A. 2019, ApJL, Medvedev, P., Sazonov, S., Gilfanov, M., et al. 2020, MNRAS, 497, 1842
874, L32 Meyer, E. T., Georganopoulos, M., Sparks, W. B., et al. 2015, ApJ, 805, 154
Carilli, C. L., & Taylor, G. B. 2002, ARA&A, 40, 319 Miley, G. 1980, ARA&A, 18, 165
Cash, W. 1979, ApJ, 228, 939 Miller, B. P., Brandt, W. N., Schneider, D. P., et al. 2011, ApJ, 726, 20
Chambers, K. C., Magnier, E. A., Metcalfe, N., et al. 2016, arXiv:1612.05560 Momjian, E., Carilli, C. L., Bañados, E., Walter, F., & Venemans, B. P. 2018,
Chartas, G., Worrall, D. M., Birkinshaw, M., et al. 2000, ApJ, 542, 655 ApJ, 861, 86
Connor, T., Bañados, E., Mazzucchelli, C., et al. 2020, ApJ, 900, 189 Mortlock, D. J., Warren, S. J., Venemans, B. P., et al. 2011, Natur, 474, 616
Connor, T., Bañados, E., Stern, D., et al. 2019, ApJ, 887, 171 Mushotzky, R., Aird, J., Barger, A. J., et al. 2019, BAAS, 51, 107
Connor, T., Kelson, D. D., Mulchaey, J., et al. 2018, ApJ, 867, 25 Nandra, K., Barret, D., Barcons, X., et al. 2013, arXiv:1306.2307
Croft, S., van Breugel, W., de Vries, W., et al. 2006, ApJ, 647, 1040 Nanni, R., Gilli, R., Vignali, C., et al. 2018, A&A, 614, A121
Davis, J. E., Bautz, M. W., Dewey, D., et al. 2012, Proc. SPIE, 8443, 84431A Napier, K., Foord, A., Gallo, E., et al. 2020, MNRAS, 498, 1550
Fabian, A. C. 2016, AN, 337, 375 Nesvadba, N. P. H., Bicknell, G. V., Mukherjee, D., & Wagner, A. Y. 2020,
Fabian, A. C., Walker, S. A., Celotti, A., et al. 2014, MNRAS, 442, L81 A&A, 639, L13
Freeman, P. E., Kashyap, V., Rosner, R., & Lamb, D. Q. 2002, ApJS, 138, 185 Paliya, V. S., Ajello, M., Cao, H. M., et al. 2020, ApJ, 897, 177
Frey, S., Paragi, Z., Fogasy, J. O., & Gurvits, L. I. 2015, MNRAS, 446, 2921 Park, T., Kashyap, V. L., Siemiginowska, A., et al. 2006, ApJ, 652, 610
Fruscione, A., McDowell, J. C., Allen, G. E., et al. 2006, Proc. SPIE, 6270, Pons, E., McMahon, R. G., Simcoe, R. A., et al. 2019, MNRAS, 484, 5142
62701V Reddy, K., Georganopoulos, M., & Meyer, E. T. 2021, ApJS, 253, 37
Garmire, G. P., Bautz, M. W., Ford, P. G., Nousek, J. A., & Ricker, G. R. J. Reed, S. L., McMahon, R. G., Martini, P., et al. 2017, MNRAS, 468, 4702
2003, Proc. SPIE, 4851, 28 Regan, J. A., Downes, T. P., Volonteri, M., et al. 2019, MNRAS, 486,
Garofalo, D., Evans, D. A., & Sambruna, R. M. 2010, MNRAS, 406, 975 3892
Gaskin, J. A., Swartz, D. A., Vikhlinin, A., et al. 2019, JATIS, 5, 021001 Schwartz, D. A., Marshall, H. L., Lovell, J. E. J., et al. 2000, ApJL, 540, 69
Gehrels, N. 1986, ApJ, 303, 336 Schwartz, D. A., Siemiginowska, A., Snios, B., et al. 2020, ApJ, 904, 57
Ghisellini, G., Haardt, F., Ciardi, B., et al. 2015, MNRAS, 452, 3457 Siemiginowska, A., Smith, R. K., Aldcroft, T. L., et al. 2003, ApJL, 598, L15
Ghisellini, G., Haardt, F., Della Ceca, R., Volonteri, M., & Sbarrato, T. 2013, Siemiginowska, A., Stawarz, Ł., Cheung, C. C., et al. 2007, ApJ, 657, 145
MNRAS, 432, 2818 Sikora, M., Stasińska, G., Kozieł-Wierzbowska, D., Madejski, G. M., &
Gilli, R., Mignoli, M., Peca, A., et al. 2019, A&A, 632, A26 Asari, N. V. 2013, ApJ, 765, 62
Gnedin, Y. N., Mikhailov, A. G., & Piotrovich, M. Y. 2015, AN, 336, 312 Sikora, M., Stawarz, Ł., & Lasota, J.-P. 2007, ApJ, 658, 815
Harris, D. E., & Krawczynski, H. 2006, ARA&A, 44, 463 Simionescu, A., Stawarz, Ł., Ichinohe, Y., et al. 2016, ApJL, 816, L15
HI4PI Collaboration, Ben Bekhti, N., Flöer, L., et al. 2016, A&A, 594, A116 Skrutskie, M. F., Cutri, R. M., Stiening, R., et al. 2006, AJ, 131, 1163
Hook, I. M., Jørgensen, I., Allington-Smith, J. R., et al. 2004, PASP, 116, 425 Spingola, C., Dallacasa, D., Belladitta, S., et al. 2020, A&A, 643, L12
Ighina, L., Caccianiga, A., Moretti, A., et al. 2019, MNRAS, 489, 2732 Steffen, A. T., Strateva, I., Brandt, W. N., et al. 2006, AJ, 131, 2826
Inayoshi, K., Visbal, E., & Haiman, Z. 2020, ARA&A, 58, 27 Stern, D., Djorgovski, S. G., Perley, R. A., de Carvalho, R. R., & Wall, J. V.
Jiang, L., McGreer, I. D., Fan, X., et al. 2016, ApJ, 833, 222 2000, AJ, 119, 1526
Jimenez-Gallardo, A., Massaro, F., Prieto, M. A., et al. 2020, ApJS, 250, 7 Strateva, I. V., Brandt, W. N., Schneider, D. P., Vanden Berk, D. G., &
Jolley, E. J. D., & Kuncic, Z. 2008, MNRAS, 386, 989 Vignali, C. 2005, AJ, 130, 387
Jolley, E. J. D., Kuncic, Z., Bicknell, G. V., & Wagner, S. 2009, MNRAS, STScI development Team 2018, synphot: Synthetic Photometry using Astropy,
400, 1521 Astrophysics Source Code Library, ascl:1811.001
Kellermann, K. I., Sramek, R., Schmidt, M., Shaffer, D. B., & Green, R. 1989, Takeo, E., Inayoshi, K., & Mineshige, S. 2020, MNRAS, 497, 302
AJ, 98, 1195 Tchekhovskoy, A., & McKinney, J. C. 2012, MNRAS, 423, L55
Labrie, K., Anderson, K., Cárdenes, R., Simpson, C., & Turner, J. E. H. 2019, van Breugel, W., Filippenko, A. V., Heckman, T., & Miley, G. 1985, ApJ,
ASPC, 523, 321 293, 83
Lansbury, G. B., Alexander, D. M., Del Moro, A., et al. 2014, ApJ, 785, 17 Vignali, C., Brandt, W. N., & Schneider, D. P. 2003, AJ, 125, 433
Li, J., Kastner, J. H., Prigozhin, G. Y., et al. 2004, ApJ, 610, 1204 Vito, F., Brandt, W. N., Bauer, F. E., et al. 2019a, A&A, 628, L6
Li, J., Kastner, J. H., Prigozhin, G. Y., & Schulz, N. S. 2003, ApJ, 590, 586 Vito, F., Brandt, W. N., Bauer, F. E., et al. 2019b, A&A, 630, A118
Lucchini, M., Tavecchio, F., & Ghisellini, G. 2017, MNRAS, 466, 4299 Wachter, K., Leach, R., & Kellogg, E. 1979, ApJ, 230, 274
Lusso, E., & Risaliti, G. 2016, ApJ, 819, 154 Wang, F., Fan, X., Yang, J., et al. 2021a, ApJ, 908, 53
Marchesi, S., Civano, F., Elvis, M., et al. 2016, ApJ, 817, 34 Wang, F., Yang, J., Fan, X., et al. 2019, ApJ, 884, 30
Marshall, H. L., Gelbord, J. M., Worrall, D. M., et al. 2018, ApJ, 856, 66 Wang, F., Yang, J., Fan, X., et al. 2021b, ApJL, 907, L1
Matsuoka, Y., Iwasawa, K., Onoue, M., et al. 2019, ApJ, 883, 183 Weisskopf, M. C., Wu, K., Trimble, V., et al. 2007, ApJ, 657, 1026
Mazzucchelli, C., Bañados, E., Venemans, B. P., et al. 2017, ApJ, 849, 91 Worrall, D. M., Birkinshaw, M., Marshall, H. L., et al. 2020, MNRAS,
McKeough, K., Siemiginowska, A., Cheung, C. C., et al. 2016, ApJ, 833, 123 497, 988
McLean, I. S., Steidel, C. C., Epps, H., et al. 2010, Proc. SPIE, 7735, 77351E Wu, X.-B., Wang, F., Fan, X., et al. 2015, Natur, 518, 512
McLean, I. S., Steidel, C. C., Epps, H. W., et al. 2012, Proc. SPIE, 8446, Yang, J., Wang, F., Fan, X., et al. 2019, AJ, 157, 236
84460J Yang, J., Wang, F., Fan, X., et al. 2020, ApJL, 897, L14
12You can also read