Enhanced and second version of an alternative approach to produce indicators of languages in the Internet Daniel Pimienta Observatory of ...
←
→
Page content transcription
If your browser does not render page correctly, please read the page content below
Enhanced and second version of an alternative approach
    to produce indicators of languages in the Internet

                         Daniel Pimienta
          Observatory of linguistic and cultural diversity
                          in the Internet
                     http://funredes.org/lc

                                         August 2021

Credits: The work leading to this enhanced version has been made possible thanks to the support
of the Cultural and Educational Department of the Brazilian Ministry of Foreign Affairs within the
frame of the International Institute of the Portuguese Language and the coordination of the UNESCO
Chair on language policies for multilingualism. Credits are given also to Daniel Prado, who first
conceived the idea of collecting diverse sources for measuring languages in the Internet as well as to
transform figures per country into figures per language.

Thanks: To Professor Gilvan Müller de Oliveira for the support on linguistic matters and coordination
with the funders, to Alvaro Blanco for the support in writing tricky programs which change radically
the management of so many sources and so many orthographs of languages and countries and to David
Pimienta who wrote the program required to transform the Ethnologue format into the required format
for that study and process macro-languages.

Warning : The following study is essentially a statistical work based on a large variety of input sources.
Adopting a major source in such type of works also implies logically adopting the rules sustaining the
data of that source. The author is therefore not responsible for the list of considered countries and
territories established by ITU, a United Nation agency, for the statistics of percentage of persons
connected to the Internet, nor for the list of languages with more than five million L1 speakers according
to Ethnologue and for the regrouping into macro-languages adopted by Ethnologue in concordance with
standard ISO 693.3.

                                                    1
ABSTRACT
In a context of scarcity of reliable data about the space of languages in the Internet, the 2017 alternative
approach to compute indicators of behavior in the Internet, for the 140 languages with more than 5
million speakers, has been enhanced and actualized. The enhancements of this approach based on the
collection of a series of micro-indicators that measure languages or countries in various Internet spaces
or applications are exposed. The use of the last Ethnologue Global Data Set allows not only to dispose
of the most reliable and up to date demo-linguistic data but also give the ground to overcome one of the
major bias of the method related to the process of the L2 speakers. The five indicators of languages in
the Internet which has been defined and exposed in 2017 (Internet users, traffic, use, contents, societal
indexes and interfaces), and 4 macro-indicators which are deduced from them (power, capacity,
gradient and content productivity) are reproduced with all inputs updated in 2021. The results are
showing the trends with English decreasing close to 25% and Chinese getting stronger while Spanish
is comforted in third position. French shares now the third place with Hindi, with a reduced advance
over a group of languages in very close positions: Portuguese, Russian, Arabic and German. As in 2017
edition, all possible biases derived from the method, assumptions or sources are discussed and finally
an estimate is proposed that consider those biases. It is forecasted for the end of 2021 a new set of
enhancements with the high possibility to extend the results for the 332 languages with more than 1
million L1 speakers, a limit that this method shall not cross to avoid stronger biases.
Keywords: Languages, Internet, linguistic diversity, indicators, bias
2Contents
ABSTRACT ........................................................................................................................................................... 2
BACKGROUND .................................................................................................................................................... 5
1. INTRODUCTION ......................................................................................................................................... 6
2. DIFFERENCES FROM FIRST VERSION........................................................................................................ 7
2.1 Adoption of Ethnologue as demo-linguistic source ...................................................................... 7
2.2 Management of L2 and multilingualism ....................................................................................... 8
2.3 Source for persons connected to the Internet ............................................................................. 9
2.4 Management of sources for micro-indicators ............................................................................ 10
2.4.1 INDEX .................................................................................................................................................... 11
2.4.2 CONTENT ............................................................................................................................................. 11
2.4.3 TRAFFIC ............................................................................................................................................... 13
2.4.4 INTERFACES ....................................................................................................................................... 14
2.4.5 USAGES ................................................................................................................................................. 14
2.5 Summary of Indicators .......................................................................................................... 15
3. RESULTS .................................................................................................................................................... 16
4. RESULTS ANALYSIS .................................................................................................................................... 19
5. BIASES ANALYSIS ........................................................................................................................................ 20
5.1 Biases proper of the method ................................................................................................ 21
5.2 Biases from sources’ selection .............................................................................................. 21
5.3 Biases from sources .............................................................................................................. 21
5.3.1 Wikimedia biases ....................................................................................................................................... 24
5.3.2 Alexa Biases ................................................................................................................................................ 30
5.4 BIAS CORRECTION ....................................................................................................................... 31
6. CONCLUSIONS AND PERSPECTIVES ................................................................................................... 35
REFERENCES ..................................................................................................................................................... 36
ANNEX 1. LIST OF MICRO INDICATORS AND SOURCES ......................................................................... 37
ANNEX 2: MACROLANGUAGES .................................................................................................................... 46
ANNEX 3: LIST OF COUNTRIES OR TERRITORIES WHERE ITU DOES NOT OFFER DATA ................ 48
ANNEX 4: RESULTS FOR ALL PROCESSED LANGUAGES ........................................................................ 49
3LIST OF TABLES AND FIGURES
TABLES
Table 1 : The 2 types of weightings used................................................................................................ 6
Table 2: Sensitivity of India figures for percentage of persons connected to the Internet ...................... 9
Table 3: Wikipedia factors and the formula.......................................................................................... 12
Table 4: Weighting of content indicators .............................................................................................. 13
Table 5: Description of indicators ......................................................................................................... 15
Table 6 : Indicators for the top 15 languages in terms of power........................................................... 16
Table 7 : Languages sorted by percentage of people connected ........................................................... 17
Table 8 : Languages sorted by capacity ................................................................................................ 18
Table 9 : Languages sorted by gradient ................................................................................................ 18
Table 10: Wikipedia presence of top languages ................................................................................... 19
Table 11: Wikipedia presence sorted by formula figures ..................................................................... 20
Table 12: Bias rating by indicator ......................................................................................................... 22
Table 13 : Macro Indicators for the top 15 languages after weighting indicators ................................ 23
Table 14: Sorted by number of Wikipedia articles ............................................................................... 24
Table 15: Wikipedia articles sorted by formula .................................................................................... 25
Table 16: Number of Wikibooks .......................................................................................................... 27
Table 17: Number of Quotes................................................................................................................. 27
Table 18: Number of Wikisources ......................................................................................................... 27
Table 19: Number of Wikiversity ......................................................................................................... 28
Table 20: Number of Wiktionnary entries ............................................................................................ 28
Table 21: Number of Wikinews ............................................................................................................ 29
Table 22: Number of articles in Wikivoyages ...................................................................................... 29
Table 23: Comparisons of different traffic measurements .................................................................... 30
Table 24: Bias correction first method .................................................................................................. 31
Table 25: Bias correction 2nd method .................................................................................................. 32
Table 26: Bias correction results ........................................................................................................... 35
FIGURES
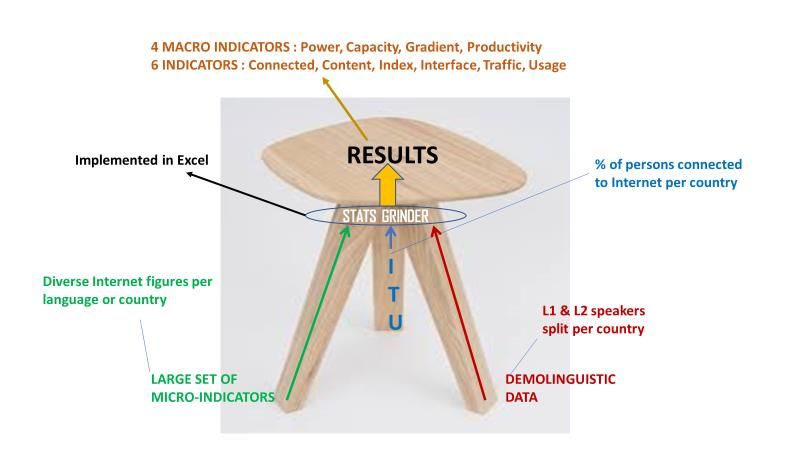
Figure 1: From micro-indicators to macro-indicators ............................................................................. 5
Figure 2: The input/output process of the model .................................................................................... 6
4BACKGROUND
The first edition of this method to produce indicators of language presence in the Internet has been
realized in 2017 and documented under the title “An alternative approach to produce indicators of
languages in the Internet” ([1]) accessible in the website of the Observatory in 4 linguistic versions
(English, French, Portuguese and Spanish)1. The reader is invited to consult it previous to the reading
of this paper which is written as a complement of the first version. The first version presented both the
method and the results; this paper presents the differences in the method and the new results.
As a reminder, the method addresses the 138 languages with quantity of L12 speakers higher than 5
million3 and produce indicators for each of them, under the following scheme (which numbers are
updated for the second version).
Figure 1: From micro-indicators to macro-indicators
412 micro-indicators 6 indicators 4 MACRO-INDICATORS
%
1
Internauts
14
%
CAPACITY
Contents
%
14 %
Usages
POWER
338 %
Trafic
GRADIENT
%
20
Interfaces
25 % PRODUCTIVITY
Indexes
The method relies in 3 type of inputs and 10 outputs as represented in the following figure.
1
http://funredes.org/lc2017
2
The convention used is to call L1 the mother tongue (or first language) and L2 the second languages, providing
a sufficient level of control to be accepted in that category.
3
As a matter of fact, the total is 128 : in order to be able to make comparisons with the 2017 study, 10 languages
with less than 5 million speakers have been left because they appeared in the 2017 study, in order to be able to
make controls and comparisons. Those languages are : Awhadi, Belarusian, Bikol, Bugis, Dugri, Armenian,
Kimbundu, Luyia, West Flemissh and Southern Thai.
5Figure 2: The input/output process of the model
The process of the model stands on weighting mechanisms able to transform figures per country into
figure per language, extrapolation technics for completing sources with limited figures per country
and weighting mechanisms with the figure of world repartition of Internet connected persons per
country to produce world percentages of the different sources.
Table 1 : The 2 types of weightings used.
Demo-linguistic Internauts per language
TYPE % per Country ---> % Criterion ---> % worldwide
% per Language
INPUT Data by country Given in % by specific criteria
OUTPUT Data by language Data in worldwideL1+L2 %
DATA L1+L2 Speakers per % of persons connected to the
WEIGHTING country matrix Internet per country
SCOPE All sources by country Index and interfaces indicators.
IMPLIED Independence of Modulation rate connection to
ASSUMPTION languages in the country the Internet according to the
criterion
The model is implemented in Excel within a spreadsheet of 7 Megabytes with 17 correlated worksheets
organized around the 215 countries considered, the 138 languages processed and the 412 micro-
indicators collected. The model so implemented allows to verify in fraction of second the impact of any
hypothesis (including prospective analysis).
1. INTRODUCTION
This second version of the referenced method to create indicators of the presence of languages on the
Internet brings a set of tangible enhancements which improve considerably the reliability of the
method and reduce the biases.
6The major improvements derive for the adoption of the Ethnologue Global Dataset 244 of March
2021 which not only update the demo-linguistics data (the quantity of speakers of each language in each
country) but also provide the most trustable data overall on the subject, even if perfect exactitude on
that matter is unattainable, and additionally, in this last version, provide for the first source of L2
speakers of each language, split per country.
2. DIFFERENCES FROM FIRST VERSION
Many differences on the method or sources occurs from version 1 in the spirit of enhancing the quality
of the method and the products.
2.1 Adoption of Ethnologue as demo-linguistic source
The main part of the Ethnologue source is in the form of an Excel matrix of 11500 lines with the
following format: ISO6395, Language Name, Country Name, number of L1 speakers, number of L2
speakers, plus a large set of associated parameters not used for this method.
In order to get the format required by the model (a matrix with all considered countries on column and
all considered languages on lines) a set of cautious steps has been implemented, with the support of
different computer programs written as macros for Excel. One of the most complex steps has been to
fusion all figures for the languages belonging to each macro-language into a single one. This process
has been involving 60 macro-languages regrouping 434 different languages6 (see in Annex 2 the list of
macro-languages).
After completing this step, the process consisted in reducing the large list of languages into the list of
languages being processed by the model7, summing carefully all the remaining figures per country into
a single line “REST”.
It is important to understand that the adoption of the Ethnologue data implies the conformity with the
imbedded rules which are based in pure linguistic considerations:
- Macro-language regrouping8
- List of countries and corresponding English naming.
The list of countries in the Ethnologue source is larger than the list processed by ITU9 for the providing
of the Internet connection rate per country (ITU as a UN entity does not separate, for instance
Martinique from France). In that case, the ITU rule is the obliged one and the requirement has been to
4
https://www.ethnologue.com/product/ethnologue-global-dataset-0
5
The ISO code with 3 characters assigned to each of the 7486 languages identified.
6
For instance, Arabic macro language holds 29 languages such as Egyptian or Moroccan Arabic.
7
At that stage 138 languages with the number of L1 speakers higher than 5 million.
8
A significative example is the case of Serbo-Croatian macro language which definition regroups, in alphabetic
order, Bosnian, Croatian, Montenegrin and Serbian. This obliged grouping does not answer at all to geo-political
criteria and could even be considered as polemical from this standpoint. Additionally, as some sources separate
clearly the involved languages and countries this produce some risk of error in the results even though the sources
input has been transformed to pay attention to that situation (the risk occurs when the figures are not to be added
but rather averaged like in the Depth indicator of Wikipedia).
9
The International Telecommunications Unit (http://itu.int), the organ of United Nations which provide telecom
stats including the percentage of persons connected to the Internet per country.
7sum up all the Ethnologue figures for the 29 countries which appears in Ethnologue but not in ITU (for
complete list see Annex 3) into a single column « Remaining countries ».
2.2 Management of L2 and multilingualism
The inclusion of the last Ethnologue data on the model allowed, as a by-product, to eliminate the major
bias of the method which was linked to the process of the second language (L2) in the model. For the
first time there is a trustable source which completes the number of L1 speakers per country with the
number of L2 speakers per country. In the 2017 version, the L2 figures for persons connected were
computed from the total of L2 speakers worldwide, applying the Internet connectivity rate computed
by the model for L1 speakers. An important bias resulted from the fact that for some major languages
(as for example French and English) a high proportion of L2 speakers belongs to developing countries
where the average Internet connection rate is much lower than what is computed in average for L1
speakers. This bias inflated the results for English and French (and some other languages) and obliged
to a “manual” bias correction.
Another positive consequence of the use of Ethnologue data is the ability to get an “official figure” for
multilingualism. The world ratio (L1+L2)/L1 was established in 2017 edition by projecting data
available for the processed countries: it resulted to be around 1.25. Now the figure is provided indirectly
by Ethnologue data and its value is 1.43.
Following Ethnologue figures:
✓ The total worldwide (L1) population is given as: 7 231 699 136
✓ The total worldwide L1+L2 speakers is given as: 10 361 716 756
✓ The “multilingualism ratio” is then 10 361 716 756/7 231 699 136 = 1.4328
(in other terms 43% of the population speaks more than one language).
This figure of 43% is clearly much better than the 25% used in the first version and this is not an
anecdotical element of the model but one of the key elements. As shown in the first study, the most
common and critical bias of the figures offered on languages is the fact that they are not considering
correctly the L2 speakers (issue which expresses fully in the Internet where most internauts do use their
L2 languages and many websites are multilingual 10 ). Not paying due attention to multilingualism
conduces to tremendous errors, often hidden in “the rest of languages”, as world percentages are
computed over a total of 7 billion (the world population) where it should be over a population of 10
billion (the L1+L2 speakers).
In that second version, the principle of measuring everything in terms of L1+L2 population (instead
of the world population) has been fully adopted to insure accuracy to the results. For that reason (and
also because of other improvements) comparison between 2017 and 2021 results are to be made with
caution. As a matter of fact, all the macro-indicators, power but also capacity and gradient, are now
following this rule of being computed over the L1+L2 population instead of the L1 population (and will
then appear lower than in 2017 version).
10
As a matter of fact, the 5 indicators processed by the study are by nature multilingual: internauts visit websites
and generated traffic in the different languages they manage, often websites are multilingual, interfaces are
multilingual, translation services cover different languages…
82.3 Source for persons connected to the Internet
Until 2017, ITU used to provide each year an update of its figures11 on the percentage of individuals
who use the Internet per country, including its own estimates whereas there is no official source in a
given country. This input, which is indeed the most important element of the method, was considered
one of the most reliable sources. Unfortunately, after 2017, ITU has decided to stop providing its own
estimates, which leaves many countries (almost all developing countries12) with old figures of 2017 in
2021.
This posed a serious issue to the method and after many iterations drove the decision to violate, in that
case, a strong principle which is basic in this type of statistical tasks: never change the data of the
sources, take it as it is.
The World Bank provides its own figures13 for the same concept, which are clearly retaken from ITU,
but, in many cases, overcomes the ITU limitation and does offer new data where ITU has left 2017 data.
This is a progress; however, many countries still remain out of the update from 2017 and this would
impact negatively the languages spoken in those countries and prevent to perceive possible progress.
Finally, it was decided to use the World Bank data when they are different from ITU’s and, for the
many remaining cases lacking actualization, do, for each concerned country, an Internet search for
reliable data and provide estimates based, when there is no evidence of arguments against, in the
approximate linear progression from previous data.
One case remained an issue: India has now a 2021 official figure of 20.1% while the 2017 ITU estimate
was 32%... and many sources on the Internet claim a boost of the Internet in India in the last years with
figures around 50%14! After failing to obtain answer from the official source and from Indian colleagues
consulted, it was decided, due to the paramount importance of India in the study context 15 , to
exceptionally violate a still stronger principle: not to change official sources. The working hypothesis
made is that the figure provided by the Indian Ministry of Statistics and Program Implementation
concerns only the fixed type of connections and leave outside the mobile connections to the Internet.
Based on that hypothesis, the conservative figure of 40% was set. Note that the sensitivity of this figure
on the results is not marginal. Hereafter the different model results for Hindi and Bengali depending of
the figure selected.
Table 2: Sensitivity of India figures for percentage of persons connected to the Internet
India % Connected persons 20.08% 30% 40% 50%
Hindi Power (ranking) 2.42% (10) 2.91% (8) 3.38% (5) 3.81% (4)
Bengali Power (ranking) 0.75% (17) 0.82% (15) 0.88% (15) 0.95% (14)
11
https://www.itu.int/en/ITU-D/Statistics/Documents/statistics/2021/PercentIndividualsUsingInternet.xlsx
12
Only 80 countries have provided official figures in 2019.
13
Source: https://data.worldbank.org/indicator/IT.NET.USER.ZS
14
See for instance in https://www.statista.com/statistics/255146/number-of-internet-users-in-india/ or
https://en.wikipedia.org/wiki/List_of_countries_by_number_of_Internet_users
15
With major languages such as Hindi and Bengali and also 34 languages which are part of the list of considered
languages.
92.4 Management of sources for micro-indicators
The whole process of sources management for micro-indicators is the most heavy, cumbersome
and challenging task of the project, with high consumption of human resources. There are many
steps involved:
1. For each category of indicator, search the Internet for sources
2. Select sources based on reliability and applicability to the process
3. Collect sources in a format able to allow automatic integration to the model
4. Integrate sources to the model and associate a theme
5. Evaluate biases of the sources
In annex 1, the full list of sources, for each type of indicator, is presented.
In order to do step 4, the data needs to get transformed into an Excel format with the appropriate
names of Countries and languages, in the same order than the one used in the model.
As for step 3, all the sources are collected from a specific URL (see Annex 1 for the complete
list of URLs). Most of the sources are obtained in HTML format, some others in PDF format
and a limited subset (mainly ITU and World Bank’s) in Excel format, which is the target to
transform all the sources. The process of transformation from PDF format into Excel could be
relatively straightforward in most cases, however in some cases there is incompatibility and
some tricks are required, such as passing first by an intermediary DOC format.
The process of transforming from HTML format to Excel format can often turn into a real
nightmare, requiring a lot of imagination and tricks, including in several case trying to retrieve
the data inside the HTML source and attempting, from there, to construct a table using the
convert function of Excel.
In a growing number of cases, the source offers a geographic access to the data (clickable maps)
which, except when the number of countries or languages is limited and copying by hand is not
too heavy, makes it impossible to process or requires subcontracting a person for a hand
collection job which is tedious but require high concentration and discipline to avoid errors.
The collection of traffic data involving hundreds of micro-indicators was subcontracted that
way.
Credits must be given to the institutions (in general, international organizations or NGOs)
which provide the data in a computer exploitable format (Wikimedia for example provides, in
its English version, HTML tables which are always transformed directly in Excel format,
without trouble).
The transformation of the source into an Excel file (in general, a table of country names and
numerical percentages or values) is not the end of the game. With 214 countries or hundreds
of languages to be processed and rare utilization of ISO codes, but instead literal names which
10can be in different languages and non-standardized orthographs, the setting into a model, which
bear its own meaningful order for the countries and languages, is not feasible by hand. Two
programs have been written for that process, which in both cases needs some recursing tuning16
in order to integrate the various orthographs (which has been conserved in a file used by the
programs). The final output of those programs is an Excel file directly usable to copy entirely,
or line by line, the sources into the appropriate spreadsheet of the model. Besides the huge gain
of time to that method it also warrants to get the data from the sources without errors.
Note also that the decision to match Ethnologue formats and to treat all the languages part of a
macro language as a unity has made this process still more complex, as macro regrouping needs
to be processed into the very sources, prior to process. To take some examples, frequent
occurrences of Egyptian or Moroccan Arabic in sources has been cumulated to Arabic and
Serbian, Bosnian, Croatian and Montenegrin data has been merged into Serbo-Croatian (the
number of similar cases being quite high). For the manual process of the list of unidentified
languages identified by the program, extensive use of the Ethnologue page
https://www.ethnologue.com/language/srp has been made.
2.4.1 INDEX
The deadline came too early when production of the 2017 version was made and this indicator
came short with a single source providing only 5 micro-indicators. This time, the required
attention was given and an almost exhaustive collection has been realized for this indicator. A
large variety of parameters characterizing the progress of countries in the Information society
have been included, with 25 micro-indicators now, from electricity stability to artificial
intelligence, crossing to Governance and many other parameters (see Annex 1 for the full
range).
2.4.2 CONTENT
As explained before, the sources for languages figures on the Internet are extremely scarce and
this makes this indicator rely heavily on Wikimedia outstanding statistics. The fact, discovered
in that second version, is that the presence of languages in Wikimedia is not proportionate to
their presence in the real world, as shown in the section of the document analyzing biases, nor
could be considered a faithful reflect of their very presence in the Web. Some way to balance
the results of Wikimedia stats has been introduced and the painful diagnostic is that Content is
the weaker indicator of this method and at the same time a very sensible and sensitive one
(changes in this indicator can provoke important impact in the resulting macro-indicators).
While one of the main goals of the project is to know the content repartition per language in
the Internet, this objective remains hard to get with a frustrating difficulty to weight correctly
the contents17 and power, a holistic macro-indicator, remains yet the best approximation of the
presence of languages in the Web.
16
The recursive process ends when the process of the sources produces no more unknown orthographs.
17
As shown in the first edition, the commendable effort of W3Techs to offer updated figures for contents is biased
at many different levels (the strongest but not unique being the lack of consideration of multilingualism and the
fact that most multilingual websites including English are probably computed as English only). This source
projects values for English contents in the Web which are extremely exaggerated (above 50% whereas the reality
is probably today below 25%). The lack of sources fuels the myth in the media that more than half of websites are
11To try to control better the excessive influence of Wikimedia figures on this indicator two
decisions were made. The first one concern exclusively Wikipedia: instead of having one
indicator for each of the figures provided (number of articles, active editors, edits and depth18)
a formula has been set up to define a single micro-indicator:
W (Li) = Articles (i) x Edits (i) x Editors (i) x Depth (i) / L1+L2 (i) ²
This formula expresses more accurately the Wikipedia overall activity per language, not giving
so much importance to languages where bots19, instead of humans, are used to create articles
by translating from another language version and hardly updating the articles further20.
The following table shows how the formula manages to reflect better the reality. The last
column (presence) is the ratio between the number of articles and the L1+L2 population
(number of articles per speaker) is a clear demonstration of why the presence of languages in
Wikipedia is not a good indicator of the overall presence of languages in the Internet… Note
that the depth value for Vietnamese was not informed and a value of 1 was set to avoid a null
formula21.
Table 3: Wikipedia factors and the formula
Language Articles Edits Active Users Depth FORMULA PRESENCE
English 6332139 1027716498 125399 1073 481775 0,47
Cebuano 5853095 32075254 186 2 275 36,71
Swedish 3050759 49330695 2148 12 22759 23,37
German 2593827 212207089 18119 93 50897 1,92
French 2342875 183969129 18054 242 26424 0,88
Dutch 2060512 59302602 3933 17 13742 8,45
Russian 1736736 115035192 10425 137 4286 0,67
Italian 1703284 121418801 8085 172 62435 2,51
Spanish 1698331 136390848 15694 210 2590 0,31
Polish 1480982 63723938 4235 32 7742 3,64
Japanese 1277204 84188217 15173 85 8683 1,01
in English. This was the case between 2007 and 2009 (see [3]), but since the exponential growth of Chinese,
Hindi, Arabic, Turkish, Bengali, Vietnamese, Urdu, Persian and Marathi, to name new languages in the first 20
ranks and together weighting close to 28% of contents, has radically changed the situation and English represents
today only a quarter of the content. Between 2000 and 2007, the persistent myth was that English occupied 80%
of the Web and this disinformation finally disappeared after 2009 with the publication by UNESCO of reports
(see [3] and [4]) which established a presence of English around 50%. How come English would have kept stable
at 50% during 14 years while the Internet was changing demography and the number of connected English
speakers (L1+L2) has decreased from 32% of the total of connected persons in 2007 (source :
https://web.archive.org/web/20120511104604/http://dtil.unilat.org/LI/2007/es/resultados_es.htm) to only 13%
today?
18
Quoted from Wikimedia: Depth, which is defined as [Edits/Articles] × [Non-Articles/Articles] × [1 − Stub-
ratio] ), is a rough indicator of a Wikipedia’s quality, showing how frequently its articles are updated. It does not
refer to academic quality.
19
A bot is a computer program behaving like a human from the point of view of the application interface.
20
Without this formula Cebuano, with huge number of articles but very low depth, appeared with the highest
capacity score.
21
The low value of depth is a reflect of the fact that 67% of articles are been made by bots, not by humans (source:
https://www.wikiwand.com/en/Vietnamese_Wikipedia).
12Vietnamese 1266628 65110373 2476 1 35 1,65
Chinese 1208732 66159632 8940 202 62 0,08
Arabic 1123561 54279052 5189 227 536 0,31
Ukrainian 1100281 32831286 2773 53 4823 3,32
Portuguese 1067241 61371751 9508 176 1651 0,41
In the chapter discussing biases, a deep analysis is made of the Wikimedia statistics.
The second decision made to balance the Wikimedia influence on the content indicator is a
system of weighting, implemented in regard to each content micro-indicator, which gives more
importance to the T-Index of Translated22 than to the whole Wikimedia collection of indicators.
Playing with different configurations of weighting factors showed the high sensitiveness of the
value of this indicator, basically due to the very low number of sources and the fact that some
languages have disproportionate presence in some Wikimedia items.
The configuration of weighting finally implemented is the following:
Table 4: Weighting of content indicators
ITEM WEIGHT
Amazon US - number of books 201723 0,5
Wikipedia formula 1
Number of WikiBooks per language 0,5
WikiQuote articles per language 0,1
Number of WikiSource articles per language 0,1
Number of articles Wikiversity per language 0,1
Number of articles Wiktionnary per language 0,1
Number of articles WikiNews per language 0,1
Number of articles WikiVoyages per language 0,1
T-Index for e-commerce Projection 2021 3
2.4.3 TRAFFIC
This step has also been very dense with a lot of trial and errors. In 2017, it was established that
the Alexa Traffic data were extremely biased against Asian countries (especially India and
China), and Brazil, and somehow biased also in favor of French and English. Four years after,
the Alexa data collection showed strange patterns (the output would not show traffic in the
country of creation of some sites24) and the feeling was that European countries traffic was
underestimated, while, in the other hand, India appears quite high in all sites, not so much
China.
22
This index, accessible at https://translated.com/les-langues-qui-comptent, is an attempt to measure the potential
of languages in electronic commerce, from the number of internauts per language, multiplied by the estimated
online expenses. It uses World Bank and ITU figures and proposes a 2021 projection which is the figure selected
for the model. It is, besides Wikimedia data, one of the extremely few serious sources available for languages in
the Internet.
23
The lack of equivalent accessible data for 2021 and the situation with Wikimedia drove the decision to keep
this micro-indicator in spite not being actualized.
24
As examples, theses.fr showed zero traffic in France, the same with spip.net, a CMS mainly used in France.
13A study comparing the traffic data with the subscription data for 5 main social networks first
confirmed the intuitive findings. In summary, Brazil traffic seems largely underestimated
compared to the level of subscription, as well France, Germany, Italy, Spain and United
Kingdom; on the other hand, India, Japan, Korea appear largely overestimated (see the Chapter
discussing the biases for more details).
In front of those un-trustable results, it was decided to look for alternative measurement tool.
SimilarWeb.com looks as a possible alternative and the test was intended prior to buying
subscription. Unfortunately, it was impossible to reach the country data in the website, and, in
spite of many intents thru different channels, including the interactive chat of the company, no
answer was ever obtained.
Facing this blocking situation, another provider, Semrush.com, was tested and country figures
were collected for the same set websites. Semrush, at difference of Alexa, provides, for each
measured site, the results for all countries, which was an attractive prospect, leaving out the
need for extrapolation. However, it happens that in some cases the total goes short of 100%
(which is not a problem) and some other times it goes over 100% (which is a problem). Finally,
the figures were normalized to exact 100% using a pro-rata rule before introduction to the
model.
After running the model, transforming country data to language data, the results were not
convincing: Chinese value was quite too low, the same for Hindi and Arabic and for the
“remaining languages”.
The extreme differences between Alexa and Semrush results, after running the model for the
same set of websites, are an alarm signal about the reliability of such tools and a worry for
future plans to extend the number of websites studied and allow theme differentiation results
for some languages.
2.4.4 INTERFACES
The list of languages supported in important application’s interfaces, or as a possible target for
translation services in the Web, does not pose any particular problem. The list of applications
selected can be consulted in Annex 1. In order to reduce the importance of the Wikimedia
figures on the model the decision was made to remove from this indicator the Wikimedia
sources.
2.4.5 USAGES
No particular difficulties either for this indicator, except to find free of charge figures for the
main social networks (mainly number of subscribers per country). Finally, the coverage
managed to include the following applications: Facebook, Instagram, Linkedin, Messenger,
Pinterest, Reddit and Twitter. Additionally, some sources not related to social networks were
included (as for example the number of downloads of OpenOffice per country), see the full list
in Annex 1.
142.5 Summary of Indicators
The following table summarizes the description of each of the indicators and explain how it is
built from micro-indicators.
Table 5: Description of indicators
INDICATOR DEFINITION TECHNICAL RELIABILITY/BIAS
A: INTERNAUTS Mono indicator derived from weighting High reliability
ITU and World Bank figures country -> language Very marginal bias
of world % of people without extrapolation although increasing
connected per country because of lack of update
extrapolated where recent for many countries.
figures are lacking.
B: USAGES Includes 14 micro indicators weighting Strong reliability.
with 2021 data: country-> language Low bias.
- Fixed + mobile % per extrapolated
country proportionally
- Broadband % per country Mean of micro
- Cumulative OpenOffice indicators
download
- Facebook, Instagram,
LinkedIn, Messenger,
Netflix, Pinterest Twitter,
YouTube, % subscribers per
country
C: TRAFFIC Alexa measured traffic per weighting Relatively good reliability
country to a selection of 338 country-> language But strong European
websites. extrapolated negative bias of Alexa
proportionally confirmed by comparisons
Truncated mean to of traffic and number of
20% subscribers per country.
D: INDEXES Includes 25 indexes from weighting Good reliability and
various sources measuring country-> language marginal bias (subjective
parameters such as: extrapolated by quartile data quantified by a
- E.government method then competent body).
- Universal Access transformed into world
- E.participation percentage weighting
- General infrastructure data with ITU
(See Annex 1 for complete Mean of micro
list) indicators
E: CONTENTS Includes 13 micro indicators Direct use of figures Very strong for Wikimedia
with associated weighting. per language weighted and Amazon.
T-Index of Translated a to balance Wikimedia But quite biased due to
measure of the potential for importance. Merge of very low presence of some
e-commerce of a list of Wikipedia 4 indicators major Asian languages.
languages (2021) with a formula. The number of micro-
- Number of books at Truncated mean to indicators would need to
Amazon (2017) 20% of micro indicator be extended to give more
- 11 language micro strength to the mean.
indicators from Wikimedia:
articles, users or editors; all
Wikipedia indicators are
synthetized with a formula.
F: INTERFACE Includes 23 binary micro- Presence % on all 23 Perfect.
(and translation indicators micro indicators.
languages) Word % by weighting
with ITU figures.
153. RESULTS
The following tables show the results, sorted by the various macro-indicators, for each of the indicators
and macro-indicators, except productivity25.
The following table shows all the summary results for the 15 most "powerful" languages in the Internet.
All percentages are made on the basis of L1+L2 population.
Table 6 : Indicators for the top 15 languages in terms of power
W.Conn. W.Pop TRAFIC L.Conn. USAGE CONT. INTERF. INDEX POWER Capac. Grad.
English 15,30% 13,01% 37,44% 64,33% 27,92% 38,61% 21,73% 17,87% 26,48% 2,04 1,73
Chinese 17,65% 14,72% 7,79% 65,59% 5,47% 8,18% 25,07% 19,38% 13,92% 0,95 0,79
Spanish 7,00% 5,24% 10,72% 73,08% 11,74% 5,42% 9,94% 7,59% 8,73% 1,67 1,25
French 3,00% 2,58% 2,64% 63,67% 3,75% 5,40% 4,26% 3,21% 3,71% 1,44 1,24
Hindi 4,26% 5,80% 4,81% 40,18% 3,16% 0,28% 4,03% 3,71% 3,38% 0,58 0,79
Portuguese 3,05% 2,49% 1,42% 67,16% 5,53% 3,30% 3,85% 2,92% 3,35% 1,35 1,10
Russian 3,51% 2,49% 1,81% 77,20% 2,28% 3,38% 3,88% 3,78% 3,11% 1,25 0,88
Arabic 3,89% 3,53% 2,30% 60,14% 3,02% 2,05% 4,29% 3,01% 3,09% 0,88 0,80
German 2,09% 1,30% 1,32% 87,65% 1,95% 5,84% 2,97% 2,98% 2,86% 2,19 1,37
Japanese 2,07% 1,22% 1,98% 92,62% 1,76% 3,55% 2,77% 3,01% 2,52% 2,07 1,22
Malay 2,20% 2,36% 0,89% 51,00% 2,79% 0,79% 1,91% 1,99% 1,76% 0,75 0,80
Italian 0,91% 0,66% 0,51% 75,65% 0,97% 3,39% 1,22% 1,20% 1,37% 2,09 1,51
Turkish 1,21% 0,85% 1,03% 77,98% 1,59% 0,94% 1,43% 1,22% 1,24% 1,46 1,02
Korean 0,93% 0,79% 0,93% 64,73% 0,99% 0,85% 1,10% 0,95% 0,96% 1,22 1,03
Bengali 1,14% 2,58% 1,22% 24,15% 1,13% 0,26% 0,72% 0,84% 0,88% 0,34 0,78
REST 31,79% 40,39% 23,19% 25,95% 17,77% 10,81% 26,34% 22,64%
TOTAL 100% 100% 100% 100% 100% 100% 100% 100%
W.Conn. : percentage of speakers of that language connected to the Internet related to total speakers
connected to the Internet
W. Pop. : percentage of speakers of that language related to the total world L1+L2 population
L. Conn. : percentage of L1+L2 speakers of that language who are connected to the Internet
REST : represents the results for the full set of all languages of the world except the 15 languages
listed in the table.
It must remain clear that the ranking in terms of power favors the languages that have the largest number
of speakers. The capacity and gradient macro-indicators offer results independently of the number of
speakers.
Reminder:
Power26 has been defined as the mean of the 5 indicators.
Capacity27 is the value of power divided by the % of L1+L2 speakers
25
This indicator will be revisited in the chapter Correction of biases. The power indicator, which integrates all the
elements would probably be, at this stage, a better approximation to the distribution of contents per language data
which remains very difficult to get in a trustable manner as of today.
26
The term power has been used instead of weight to avoid confusion with the heavy transversal use of weighting
in the method. It represents the absolute presence of a language in the Internet, integrating all factors.
27
The capacity is the relative presence of a language in the Internet, independently of its number of speakers; it
indicates the dynamism of a language in the Internet.
16Gradient28 is the value of power divided by the % of connected L1+L2 speakers.
The following table is sorted by connected languages, the most connected first.
Table 7 : Languages sorted by percentage of people connected
INTERNAUT SORT Internauts Capacity Gradient
Danish 97,82% 2,19 1,22
Swedish 93,49% 2,61 1,53
Japanese 92,62% 2,07 1,22
Dutch 92,02% 2,26 1,34
German, Swiss 91,56% 1,21 0,72
West Flemish 90,43% 1,12 0,68
Finnish 89,67% 3,42 2,09
Bavarian 87,68% 0,97 0,61
German 87,65% 2,19 1,37
Hebrew 85,46% 5,24 3,35
Slovak 82,47% 1,30 0,86
Belarusian 82,27% 1,00 0,66
Czech 81,37% 1,70 1,14
Polish 81,17% 1,88 1,26
Hungarian 79,92% 1,79 1,22
Tatar 78,05% 0,87 0,61
Turkish 77,98% 1,46 1,02
Serbo-Croatian 77,78% 3,14 2,21
Greek 77,71% 1,75 1,23
Russian 77,20% 1,25 0,88
Kazakh 76,98% 0,90 0,64
Romanian 75,66% 1,18 0,86
Italian 75,65% 2,09 1,51
Albanian 75,48% 1,12 0,81
Azerbaijani 74,76% 0,94 0,69
Napoletano-Calabrese 74,39% 0,84 0,62
Spanish 73,08% 1,67 1,25
Kurdish Macro 73,02% 0,89 0,67
Bulgarian 70,34% 1,18 0,92
Armenian 69,86% 1,41 1,11
Vietnamese 69,04% 1,07 0,85
Guaraní 68,83% 0,64 0,51
Portuguese 67,16% 1,35 1,10
The following table is sorted by capacity.
28
The gradient indicates the dynamism of the connected speakers; the term gradient, expressing a derivate and
therefore a trend or a drive, has been chosen because a high gradient is a promise of increasing capacity.
17Table 8 : Languages sorted by capacity
CAPACITY SORT Internauts Capacity Gradient
Hebrew 85,46% 5,24 3,35
Finnish 89,67% 3,42 2,09
Serbo-Croatian 77,78% 3,14 2,21
Swedish 93,49% 2,61 1,53
Dutch 92,02% 2,26 1,34
German 87,65% 2,19 1,37
Danish 97,82% 2,19 1,22
Italian 75,65% 2,09 1,51
Japanese 92,62% 2,07 1,22
English 64,33% 2,04 1,73
Polish 81,17% 1,88 1,26
Hungarian 79,92% 1,79 1,22
Greek 77,71% 1,75 1,23
Czech 81,37% 1,70 1,14
Spanish 73,08% 1,67 1,25
Turkish 77,98% 1,46 1,02
French 63,67% 1,44 1,24
Armenian 69,86% 1,41 1,11
Portuguese 67,16% 1,35 1,10
Slovak 82,47% 1,30 0,86
Russian 77,20% 1,25 0,88
And finally, the last table, sorted by gradient, highlights the dynamism of people connected. The
presence of Malagasy so high29 is a consequence of the dynamism of its speakers in some Wikimedia
indicators.
Table 9 : Languages sorted by gradient
GRADIENT % Capacity Gradient
SORT Internauts
Hebrew 85,46% 5,24 3,35
Serbo-Croatian 77,78% 3,14 2,21
Malagasy 9,79% 0,40 2,21
Finnish 89,67% 3,42 2,09
English 64,33% 2,04 1,73
Swedish 93,49% 2,61 1,53
Italian 75,65% 2,09 1,51
German 87,65% 2,19 1,37
Dutch 92,02% 2,26 1,34
Polish 81,17% 1,88 1,26
Spanish 73,08% 1,67 1,25
French 63,67% 1,44 1,24
Greek 77,71% 1,75 1,23
29
Such a ranking for Malagasy, a language with less than 10% of speakers connected, and a very low capacity,
can legitimately provoke surprise: this is the result of a “mathematical accident” due a hugely disproportionate
presence in one of the content micro-indicators and is indeed a symptom of the weakness of this indicator which
is discussed hereafter.
18Danish 97,82% 2,19 1,22
Hungarian 79,92% 1,79 1,22
Japanese 92,62% 2,07 1,22
Czech 81,37% 1,70 1,14
Armenian 69,86% 1,41 1,11
Portuguese 67,16% 1,35 1,10
Beyond the quite logical fact that the national languages of countries acknowledged for their proactive
policies for the information society appear in the top positions, it is remarkable that several languages
rate above English in spite its strategic advantage in the Internet to be the preferred language of choice
for multilingual content and the belief of many it is the Internet lingua franca.
Those results have to be taken paying attention to the biases mentioned in the document, especially the
difficulties with the content indicator whose changes may impact considerably those macro-indicators30.
4. RESULTS ANALYSIS
Although comparisons with 2017 results is to be made with caution due to the importance and nature
of the changes (specially the decision to express percentages in relation with the total world L1+L2
population), some phenomena can be highlighted.
The expected growth of Hindi which compete now with French for the 4th place and the apparition of
Turkish in the list of top languages. As expected also, the differences between the group of followers
of French are too close to consider the results are beyond the confidence interval; Portuguese, Russian,
Arabic and German. However, the demographics may in the close future separate the respective
positions at the speed of digital divide reduction.
As for the macro-indicators independent of the number of speakers, the apparition of Serbo-Croatian
has to be taken with caution due to the process of the indicators resulting to the decision to adopt the
Ethnologue classification as macro-language. And clearly, the indicator content and its actual high
dependency on Wikimedia statistics, in spite the effort made to counterbalance it, clearly favors
languages whose speakers have invested in Wikimedia presence. See the table below those languages.,
first sorted by the ratio 1000 x Number or articles/L1+L2 speakers and then sorted by the result of the
formula set up (factor)
Table 10: Wikipedia presence of top languages
Language Articles Edits Active Users Depth FACTOR %FACTOR/L1+L2 %FACTOR/CONN ART/L1+L2
Swedish 3050759 49330695 2148 12 22759 1,74 1,86 233,68
Finnish 512026 19813368 1752 40 21354 3,70 4,13 88,74
Dutch 2060512 59302602 3933 17 13742 0,56 0,61 84,51
Serbo-
Croatian 1514114 78699318 1959 92 53779 2,69 3,46 75,77
Belarusian 281379 6093511 384 61 2620 0,67 0,81 71,87
Danish 267641 10777444 767 64 4486 0,80 0,82 47,64
30
Prior to the introduction of the Wikipedia formula and the Wikimedia weighting, Cebuano, the second language
in terms of number of Wikipedia articles, close to English, therefore with a content presence two order of
magnitude higher than its speaker’s presence, appeared first in the gradient table…
19Hungarian 489514 23958462 1561 59 6871 0,55 0,69 39,04
Polish 1480982 63723938 4235 32 7742 0,19 0,23 36,44
Czech 484445 20095461 2242 46 5593 0,42 0,51 36,16
Ukrainian 1100281 32831286 2773 53 4823 0,15 0,23 33,16
Bulgarian 273163 11023721 789 27 942 0,11 0,16 33,10
Hebrew 298053 31660591 3335 258 92147 9,82 11,49 31,75
Italian 1703284 121418801 8085 172 62435 0,92 1,22 25,10
German 2593827 212207089 18119 93 50897 0,38 0,43 19,21
Japanese 1277204 84188217 15173 85 8683 0,07 0,07 10,11
Persian 816984 32472834 5416 172 3534 0,04 0,07 9,77
French 2342875 183969129 18054 242 26424 0,10 0,16 8,78
English 6332139 1027716498 125399 1073 481775 0,36 0,56 4,70
The following table shows clearly why some languages, such as Hebrew, Finnish and Serbo-Croatian,
have gotten an advantage in the final results sorted by gradient.
Table 11: Wikipedia presence sorted by formula figures
Language FACTOR %FACTOR/L1+L2 %FACTOR/CONN
Hebrew 92147 9,82 11,49
Finnish 21354 3,70 4,13
Serbo-Croatian 53779 2,69 3,46
Swedish 22759 1,74 1,86
Italian 62435 0,92 1,22
Danish 4486 0,80 0,82
Belarusian 2620 0,67 0,81
Hungarian 6871 0,55 0,69
Dutch 13742 0,56 0,61
English 481775 0,36 0,56
Czech 5593 0,42 0,51
German 50897 0,38 0,43
Polish 7742 0,19 0,23
Ukrainian 4823 0,15 0,23
Bulgarian 942 0,11 0,16
French 26424 0,10 0,16
Japanese 8683 0,07 0,07
Persian 3534 0,04 0,07
Those considerations naturally lead to the discussion on biases.
5. BIASES ANALYSIS
There are three main categories of biases susceptible to affect the results:
- Biases proper of the method
- Biases from source’s selection
- Biases from sources
205.1 Biases proper of the method
One of the main biases proper of the method, which result of giving the same figure of
percentage of L1 speakers connected to the Internet for L2 speakers, has been eliminated with
the switch to Ethnologue data, gaining the repartition of L2 speakers per country. This strong
bias affected particularly the languages with an important L2 population in countries with low
connectivity rate (such as French and English). This is a paramount progress for the trust of the
figure produced by the established model.
The second main bias proper of the method is to consider that, within a given country, all
language speakers hold the same connectivity percentage (in other terms the national
percentage of persons connected to the Internet is applied to all speakers, independently of their
mother tongue). This bias forbids to distinguish speakers of different languages within a
country with the method (for example, Catalan speakers in Spain are given the same
connectivity percentage than Spanish speakers and no differentiate advantage can be analyzed,
the same with Martinique creole in France, the same with the many languages of India). It is
understandable intuitively that this assumption is not verified in many cases (the national digital
divide could be linked to linguistic considerations) and that the impact of this bias is as strong
as the language population is low. Marginal effect is expected if the model is limited to
speaker’s population higher than 5 million (although in the case of India it is not so obvious).
The next launch of the model, forecasted to conclude before the end of 2021, will try to push
the limit to languages with more than 1 million speakers.
Other marginal biases of the model may result of the adoption of structures implied by main
sources. For instance, the split into countries has been derived from ITU classification and do
not distinguish some territories.
5.2 Biases from sources’ selection
There is obviously a “selection bias “, which is not proper of the methodology but belongs to
the application of the method, where the decision on what source selection is made implicitly
favor criteria proper of one’s cultural background and ignore unconsciously data from countries
too remote from one’s experience. This may apply to each of the indicator and impact specially
traffic where the selection of websites is hardly even between countries and can be influent
even if the number of websites is counted in hundreds. The use of the truncated mean at 20%
has been implemented to reduce such biases, after verifying that 20% was a large span capable
to eliminate the large majority of results centered in websites with high language locality.
5.3 Biases from sources
The biases resulting from sources are discussed in the table below, rating each indicator with a
value from 0 (totally unreliable) to 20 (bias-free).
21Table 12: Bias rating by indicator
RATING
INDICATOR COMMENTS
INTERNAUTS 19→16 This indicator derives from a unique micro-indicator. The
main source is ITU. In 2017, this was the best rated sources
with a 19/20 but in this release the rating drops to 16 because
ITU has stopped to provide its own estimation when the
country does not produce official data. ITU figures has been
completed by World Bank’s whenever possible and a linear
projection of previous year’s data has been set for the other
cases. This indicator is key in the method as it serves as
weighting of the results in several situation, however the
factor analysis showed that the impact of small variation is
moderate. As an example, if the connection rate for Brazil will
be set at 80% instead of the actual value of 74% Portuguese
power value would increase from 3.26% to 3.39%.
INDEX 15→18 This indicator derives from a mix of 25 micro-indicators
rating different parameters of countries characterizing
Information Society. The sources are either international
organizations, large NGOs or universities. Bias-free rating
does not exist but if biases exist they are certainly marginal.
The selection bias is now extremely low as we are closer to
exhaustivity in the set of micro-indicators.
CONTENT 5→8 There are only 13 micro-indicators to build this indicator and
11 of them derive from Wikimedia. Repartition of web
content by language is a hidden continent of the Internet and
existing sources are, first, extremely scarce and, second,
highly biased. Unfortunately, the actual stage of the model
does not escape to that situation. As it relies strongly in
Wikimedia excellent statistics it carries the biases of
Wikimedia where the presence of Asian languages is way
below their proportion in the Internet. Obviously, the
selection bias in that case, which is hugely dependent on
Wikimedia stats, is extremely important. A weighting system
has been put in place to reduce that dependence as much as
possible (which in any case is certainly not enough, this is
why the rating has been upgraded from a very low 5 to an
insufficient 8). The bias proper to content indicator is not only
important but quite sensitive (meaning that small variations
may produce strong impacts in results) as we could
experiment playing with the weighting method and the
Wikipedia formula we designed (see below). Some ideas to
try to remediate that issue will be implemented in the next
measurement campaign. Meanwhile biases are overcome “by
hand” using some technics (see Bias correction).
TRAFFIC 11 This indicator derives from the measurement of traffic by
country using Alexa.com on a selection of 338 websites. In
2017 the bias analysis showed that this source was strongly
biased disfavoring Asian countries and Brazil. In 2021, it
appears that the bias against Asian country has been corrected
22You can also read