ENDLINE REPORT (SAV-EX) - SEGURIDADE ALIMENTARIA PARA VENEZOLANOS EXTENDIDA - BRASÍLIA/DF
←
→
Page content transcription
If your browser does not render page correctly, please read the page content below
ENDLINE
REPORT
SEGURIDADE
ALIMENTARIA
PARA
VENEZOLANOS
EXTENDIDA
(SAV-EX)
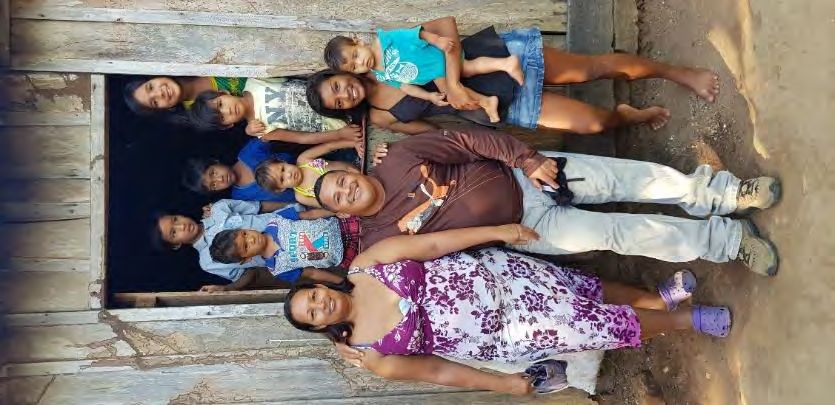
PICTURE OF A SAV-EX BENEFICIARY FAMILY - BASELINE
PICTURE OF A SAV-EX BENEFICIARY FAMILY - ENDLINE
BRASÍLIA/DF
October/ 2020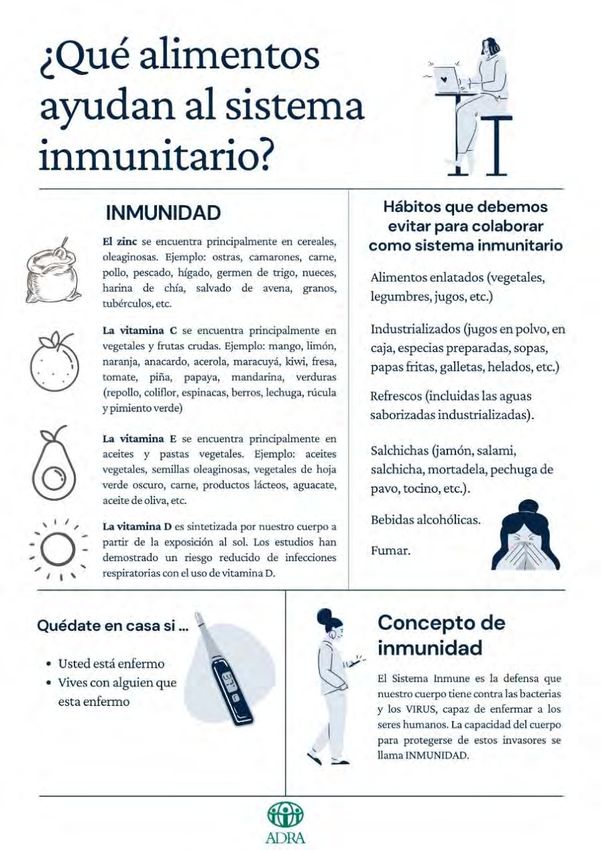
Executive: Consultoria em Planejamento e Avaliação de Políticas Públicas - IPLANVS
Condomínio Ville de Montagne – Qd 7 – Casa 3 – 71680-357 – Brasília/DF
Phone: (61) 3263-7464
Email: manoeltimbo@gmail.com / i.planvs@gmail.com

General Coordinator
Antonio Manoel Timbó Lima Gomes

Deputy Coordinator
Júlia Alves Marinho Rodrigues

Technical Coordenadinator
Tilcia Kelen Santos Araújo

Statistician
João Francisco Resende

Interviewers & Enumerators
Astrid Carolina Cortes
Carlos Francechi
Claudia Minera Ovellar Castillo
Diana Carolina Pulido Sanchez
Flávio Sousa
Freddy Abrahan Bellorin Torres
Georgany Elisa Morales Pinto
Jose Gregorio Ybarra Contreras
Randy
Vanessa Moraes Marinho
LIST OF ACRONYMS

ADRA – Adventist Development & Relief Agency

DHAA - Human Right to Adequate Food

DHANA - Human Right to Adequate Food and Nutrition

FCS - Food Consumption Score

HHS - Household Hunger Scale

INSAN - Food and Nutrition Insecurity

rCSI -Reduced Coping Strategies Index

RR - Roraima

SAV-EX – Seguridade Alimentaria para Venezolanos Extendida

SWAN - Settlement, WASH and Non-Food Assistance for Venezuelan Migrants in Brazil
EXECUTIVE SUMMARY

         This is the final evaluation of the Food Security Program for Venezuelans-Extended –
SAV-Ex, implemented by the Adventist Development and Relief Agency - ADRA Brazil.
         This program is an intervention that aims to generate food security for a group of
Venezuelan migrants in a social vulnerability situation and food and nutritional insecurity.
         In ten months of implementation of this project, 18,748 beneficiaries were assisted. This
group of migrants live in several municipalities in the State of Roraima, precisely in six cities
comprising the migratory corridor: Pacaraima, Amajarí, Mucajaí, Iracema, Caracaraí,
Rorainópolis and Boa Vista. In addition to this group, the project also assisted beneficiaries who
were incorporated from another intervention implemented by ADRA Brazil, the SWAN project.
In the initial moment of this incorporation, these beneficiaries received a three-month food aid.
Along with these interventions, SAV-Ex also supported another group of vulnerable migrants
made up of creole and indigenous Venezuelans of the Eñepa, Kariña, Pemon and Warao ethnic
groups. The meals are distributed during breakfast, lunch and dinner, and an average of 400 meals
per shift are served daily.
         Assessing the project, it can be said that it has managed to achieve its proposed objectives
in relation to generating food security and reducing the food insecurity of its beneficiaries.
         Qualitative and quantitative methods were used for the evaluation process, in addition to
innovative tools and approaches for at-distance data collection along with the generation of
evidence already adapted to circulation restrictions and social interaction during the COVID 19
health emergency. The quantitative assessment covered the sample range of 706 households, and
all areas of geographic implementation of SAV-Ex Program. The qualitative assessment included
structured interviews with technicians from the project's implementing entity, partners, and other
stakeholders, as well as a group of 116 project beneficiaries. The entire methodological
assessment process included the concepts in force in national and international laws defining the
themes of Food and Nutrition Security (FNS), Food and Nutrition Insecurity (FNIN), as well as
the Human Right to Adequate and Healthy Food (HRAHF) and the Human Right to Adequate
Food and Nutrition (HRAFN).
         Regarding the project's indicators, the following assessment is made: on the frequency
index of the reduced coping strategy (rCSI), which is based on the frequency in which during the
last seven days one of the coping strategies of food restriction is used. In the final evaluation a
total average household score (reduced CSI) was obtained). With the proper weights (expansion
factor), it was 17.2 points, which is considered a satisfactory food and security situation for all
beneficiaries, given that the lower the score the better food security situation. An important data
to be considered is that 6.4% of households obtained rCSI 0 (zero) and only 2.4% obtained the
highest rCSI score of 56 points.
         Considering the results found at endline, the SAV-Ex program managed to surpass the
planned index as a target to be reached, which was to reach a total rCSI of 20 points, as well as
this same score for FNM, MNF and M&F households.
         The Household Hunger Scale (HHS) indicator that analyses the aspects in terms of
household food access is based on three questions about household perceptions on varying degrees
of hunger, by the number of times they have had experienced hunger in the last 30 days prior to
the survey. Unlike the previous indicator, the higher the index, the more severe hunger is. Most
respondents (76.9%) fall into the category of little or no hunger. Moderate or severe hunger affects
about two thirds of families (23.1%), being less common in male households (10.9%). It is worth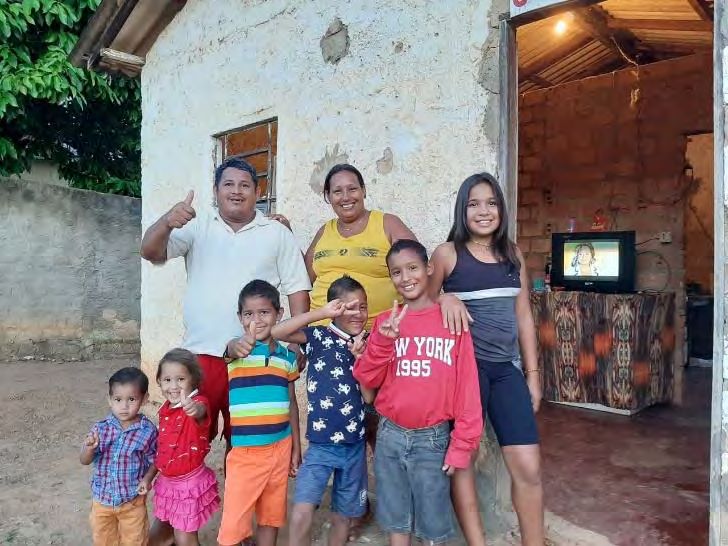
noting that moderate or severe hunger showed a significant reduction of 16.5 percentage points,
between the initial and the final study (from 39.6% to 23.1%).
        Regarding the targets to be met by the program, some points deserve reflection: for the
aspects of moderate hunger the total rate that the project should reach would be 30%. The project
managed to advance further, as it had a lower rate than planned, reaching 21.6% of beneficiaries
with moderate hunger. This is extremely positive as it has improved the planned rate even further
by reaching 8.4% above the target moving those beneficiaries up to the category of little or no
hunger. Regarding the severe hunger indicator, the program was unable to reach the total target
of zero. However, the program still has a very low percentage in this group, at 1.5%.
        Regarding the other disaggregation of this indicator, in relation to moderate hunger, the
program's performance was better than planned, only in relation to severe hunger it did not reach
its targets, with the exception of the MNF disaggregation which managed to reach the planned
target.
        Concerning the Food Consumption Score (FCS), which is characterized by food diversity,
food frequency and the relative nutritional importance of different food groups, the following
results were obtained: among the least consumed food groups are fruits, vegetables and leaves,
and legumes and grains, according to the highest percentages of “never consumes” and
consumption between 1 or 2 days a week. Thus, there are still some challenges regarding adequate,
diversified, and healthy food.
        Regarding the primary food source consumption, food purchasing, or food aid corresponds
to 93%. Among secondary sources, purchased foods is the most common (60.7%), but donated
(13.3%) and borrowed (9.9%) also have an important share. The 70.7% FCS frequency of food
consumption per head of household category of is acceptable, 9.1% borderline and 20.2% poor.
As a result, there are 29.3% of families in a borderline situation or inadequate nutrition. The result
of this indicator deserves some reflections, ranging from the project's implementation process to
the final evaluation. The project’s first funds endowment for the beneficiaries were made in
November 2019 and on February 6, 2020. With only three months of implementation of the
SAV-Ex project, “measures to deal with the public health emergency of international importance
were decreed in Brazil due to the coronavirus, responsible for the 2019 outbreak”. The project
was implemented mainly in restricted complex pandemic periods, seven months rather than in
normal times, three months. Thus, it is known that the food security sector has undoubtedly been
one of the most affected by the pandemic, since 1 in 5 households surveyed had at least one
resident who claimed to have been contaminated by COVID-19. According to interviewees’
perception, working was by far the aspect of everyday family life most affected by the pandemic.
Most of the SAV-Ex project beneficiaries are informal workers, and it is known that this sector is
one of the most affected.
        It is considered by 9 out of 10 beneficiaries that there was an increase in the cost of food
due to the pandemic. Among these beneficiaries, the biggest consequence of COVID19 occurred
in nutrition was the increase in expenses, followed by the need to eliminate certain foods from
meals to suit the household budget.
        Consequently, one can affirm that the FCS and HHS indicators could have had better
performance and evolution, reaching better results in this final assessment if the pandemic had
not occurred.
        This is a program that is currently fundamental since many of the beneficiaries have lost
jobs and today this is the only benefit, they have to survive.
        Based on this final evaluation, we present below a set of suggestions that we consider
important for the effective guarantee of food security in new programs or interventions for this
purpose with vulnerable groups such as Venezuelan migrants: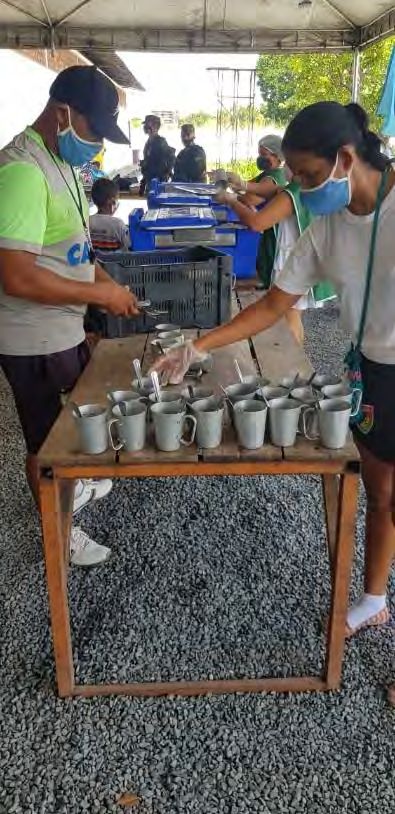
1. SUGGESTION TO IMPROVE THE SET OF PROJECT INDICATORS
We propose that for the next interventions, it is vital to institutionalize mechanisms for
systematic monitoring of food consumption, with a focus on the effective food security of the
participants, as well as to create mobilization instruments with the beneficiaries of the project and
that it be truly effective and efficient. in order to provide families with food consumption that is
truly focused on food security and the human right to food and adequate nutrition.
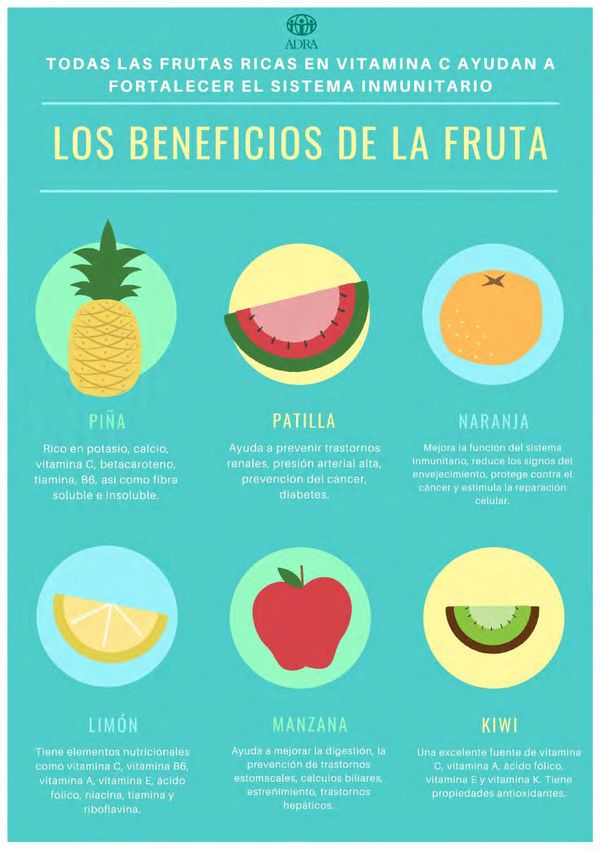
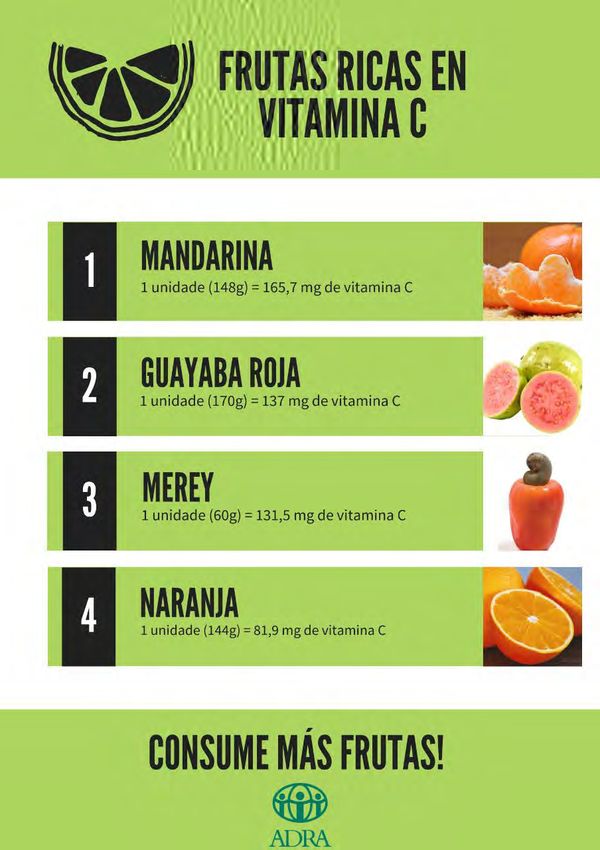
With this final assessment, it is clear that the sole use of pamphlets and, during the
pandemic, dissemination of informative cards via WhatsApp, demonstrated that these information
tools are not yet sufficient to sensitize beneficiaries to greater consumption of nutritious foods
such as fruits and vegetables and thereby achieving the planned targets of program indicators,
such as the Food Consumption Score.
Thus, it is suggested that the creation of manuals be supported and that they be published
on a virtual platform with a food security section. In this section, there could be guidelines that
include:
1. Guidance for the full use of food with recipes that are preferably linked to the food and
cultural habits of program beneficiaries;
2. Incentive guides for the cultivation of vegetables and legumes that have easy and quick
crops with a focus on urban and peri-urban agriculture;
3. Educational materials on nutrition and adequate and healthy food;
4. Healthy cooking guides;
5. Guide to Brazilian foods that can be used in typical Venezuelan cuisine;
6. Guiding seasonal calendar indicating the periods (months) of fruits, vegetables and
legumes production that are mostly produced in the State of Roraima such as: banana,
orange, watermelon, pineapple, mango, lemon and coconut; as these are cheaper in the
period in which they are produced. This would encourage a diversification of food
intake and an adequate and healthy diet;
7. Sharing of information on prices and supermarkets that provide more affordable food
items.
2. SUGGESTIONS FOR THE HOT MEALS DISTRIBUTION
1. Hiring a collaborator/ staff member to accompany hot meals and to articulate with local
leaders and prepare the place for the distribution;
2. Training of employees and volunteers who work in logistics, space organization and
food distributions to improve service provision;
3. Develop an efficient control for the distribution of hot meals;
4. Improvement in the space where food is distributed;
6. Training of volunteers in serving techniques and in the amount of food to be served;
7. Reinforce procedures for the importance of hand washing, as it was observed that
Venezuelans do not sanitize their hands prior to food distribution;
8. Need to use technology to control how many people have to eat as currently this is done
manually. For example, using a beneficiary flow control application or software.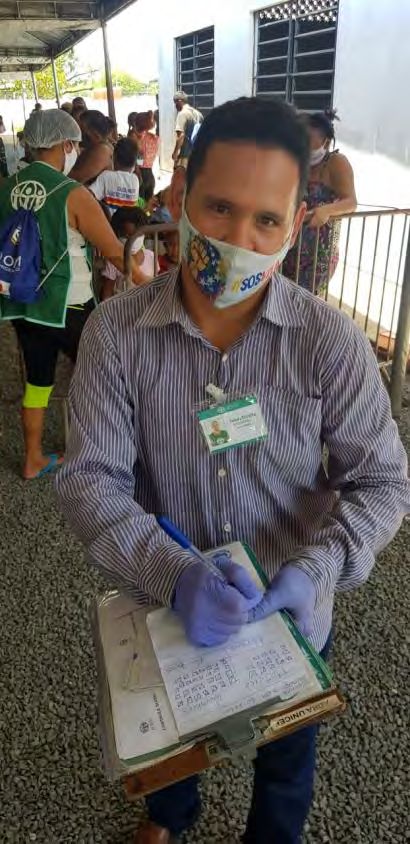
3. SUGGESTIONS FOR FOOD SECURITY INTERVENTIONS

1. Professionalization of the nutrition team focused on DHANA;
2. Articulate with other organizations that work with food security projects and initiatives
and that have experience with urban and peri-urban agriculture and that can support the
project with possible partnerships for the training of beneficiaries in vegetable cultivation
techniques that produce quick and easy crops, similar to the experience of one program
beneficiary illustrated in annex 8.
3. Encourage the consumption of fruits, vegetables and food produced in the State of
Roraima:
4. That the food security programs dialogue with other policies, such as health, social
assistance, agriculture that are being implemented by other organizations;
5. Promote effective articulation with the social protection network, such as the National
Food and Nutrition Security System, with the Unified Social Assistance System and
Unified Health System, and from there identify issues that can be supported and articulated
by governmental organizations with the beneficiaries of the program, as well as supporting
possible beneficiaries who have chronic diseases, women victims of violence and
LGBTQIA + population.
LIST OF FIGURES, GRAPHS AND TABLES

                                           GRAPHS

Graph 1: Gender of respondents
Graph 2: Number of persons living with the respondents
Graph 3: Age group of persons living with respondents by head of household gender (Final)
Graph 4: Average strategies used and total reduced CSI by head of household gender
Graph 5: Average HHS by gendered household
Graph 6: HHS Hunger categories by head of household gender
Graph 7: Types of Food Sources
Graph 8: Frequency categories of food consumption – FCS by gendered household – Endline
Graph 9: Area of life most affected by COVID-19
Graph 10: Consequences of COVID 19 on food

                                            TABLES

Table 1: Sample Size
Table 2: Beneficiaries Group Sample
Table 3: Average size of the families by gendered households
Table 4 – Affirmative food insecurity questions in the last 7 days
Table 5- Reduced CSI by household head gender
Table 6 - Reduced CSI by gendered household
Table 7 – Household Hunger Scale (HHS) frequencies
Table 8 – Comparison of the HHS indicator between the planned and achieved target at endline
Table 9 – Food frequency by type
Table 10 - FCS by head of household gender
Table 11 – Comparison of the FCS indicator between the planned and achieved target in the
assessment
SUMMARY

INTRODUCTION AND CONTEXT ..................................................................................................... 10
1.     METHODOLOGY .......................................................................................................................... 10
       1.     Quantitative Data ..................................................................................................................... 12
       A)         Questionnaires ...................................................................................................................... 12
       B)         Sample ................................................................................................................................... 12
       2.     Qualitative Data ....................................................................................................................... 14
II. RESULTS, DISCUSSION AND ANALYSIS ................................................................................... 16
       1.     PROFILE OF RESIDENTS IN RESPONDENT HOUSEHOLDS ..................................... 16
       2.     ANALYSIS OF PROGRAM INDICATORS ........................................................................ 19
       2.1.       Reduced Coping Strategies Index (rCSI)........................................................................... 19
       2.2.       Household Hunger Scale (HHS) ......................................................................................... 21
       2.3.       Food Consumption Score (FCS) ......................................................................................... 24
       2.4.       Hot Meals .............................................................................................................................. 31
       IV. IMPACTS OF THE PANDEMIC ON THE PROGRAM ..................................................... 33
       IV. CONCLUSIONS AND RECCOMMENDATIONS................................................................ 35
ANNEXES ................................................................................................................................................ 39
10

          INTRODUCTION AND CONTEXT

        In recent years, the economic crisis and political instability experienced in
Venezuela, has led to an increasingly accentuated migration process to several countries
in South America of men, women, and children. Consequently, these migrants have left
their country searching for survival alternatives in other regions. Brazil is one of those
countries that has received a significant number of Venezuelan migrants. The State of
Roraima is one of the states with the largest presence of the Venezuelan population, since
it is the gateway to Brazil, and not only in its capital, Boa Vista, but in several
municipalities throughout the migratory corridor. Initially, the presence of these
immigrants was restricted to the State of Roraima. Today, this situation has completely
changed, and Venezuelan migrants are being identified throughout the national territory.
According to the Thematic Atlas-Venezuelan Migrations, at least 1,291 of the 5,570
Brazilian municipalities, approximately 23%, have at least one immigrant from
Venezuela.
        According to this study, the "migratory process is divided into three surges of
Venezuelans fleeing who arrived in Brazil in recent years, like more than 5 million fellow
countrymen. The first migratory current, in 2012 and 2014, was characterized by highly
qualified immigrants and most of them settled in the southeastern region of Brazil. The
second -from 2015 to 2017, was also made up of middle class Venezuelans, such as
engineers, technicians and teachers, and the last current, which started in 2018 with the
worsening scenario in Venezuela, has been formed by immigrants of poor conditions,
many of them migrating with their families and settling in Roraima.”1 Thus, these
Venezuelans staying in Roraima, in addition to poverty and vulnerability, bring together
serious problems of food and nutritional security. Seeking to contribute to the reduction
of the serious impacts from this reality on the lives of this group of Venezuelan
immigrants, in November 2019, as a continuation of other interventions, the
implementation of the Food Security Program for Venezuelans- Extended – SAV-Ex (for
its acronym in Portuguese) began.

     1. METHODOLOGY
        The entire methodological process contemplates, from the analysis of the program
and project cycle, the use of the ex post evaluation methodology and considering the
following steps: baseline comparative methodology, objectives, implementation,
monitoring and evaluation with a focus on the main results such as: indicators generated
and target achievements, impacts and lessons learned. The evaluation of this initiative
combines qualitative and quantitative methods, in the initial phase (“ex ante” or
“baseline”) and in the final phase (“ex-post”). This included a survey questionnaire and
the review of primary and secondary program data.

1
   https://www1.folha.uol.com.br/mundo/2020/09/imigrantes-venezuelanos-estao-em-23-dos-municipios-brasileiros.shtml - access
on Thursday, October 15, 2020
11
The entire process of implementing methodological strategies was agreed upon
during planning meetings with the technical team from ADRA's Brazil Regional Office
in Roraima.
Documentary analysis was carried out: of the initial work plans, program´s
implementation and monitoring reports and other existing technical documents, which
were provided by the program´s implementation team.
In the whole process of this consultancy, the national and international concepts
and legislation that define Food and Nutrition Security (SAN) and Food and Nutrition
Insecurity (INSAN) were considered, as well as the Human Right to adequate and Healthy
Food (DHAA) and the Human Right to Adequate Food and Nutrition (DHANA). These
concepts are well defined in international literature and in the Brazilian Constitution of
1988, which advocates social rights and the right to access food to any citizen, Brazilian
or migrant who is in the country. Today, the concept adopted in Brazil on food and
nutritional security consists in “meeting the right of everyone to regular and permanent
access to food of good quality, in sufficient quantity, without compromising access to
other essential needs, based on health-promoting food practices that respect cultural
diversity and that are environmentally, culturally, economically and socially
sustainable.”2 The Human Right to Adequate Food (DHAA), “is exercised when every
man, woman and child already exercises alone or in common with others, has physical
and economic access, at all times, to adequate food or the means to obtain it.”3
Additionally, the DHANA “must be considered in its two dimensions: the right to be free
from hunger and the right to food and nutrition.”4
These rights to healthy food are considered by the various United Nations
agencies, as well as by other international entities, a human right of all and guaranteeing
food and nutritional security for vulnerable populations is a duty of the State as well as
society´s responsibility.
The main objective of this consultancy was to assess, from an ex post perspective,
the Food Security for Venezuelans – Extended project (SAV-Ex) program, implemented
by ADRA and is based on the following principles:
• evaluation was ex post and summative; despite having contemplated
methodological aspects of ex anti, such as the analysis of the documentation and the
results of the baseline;
• autonomous external evaluation by the team responsible for conducting the
process;
• participatory evaluation, with a strategy of incorporating the views of the team
responsible for the implementation of the program at ADRA, the network of partners, as
well as stakeholders and also contemplated the view of the beneficiaries from their
experiences and experiences with the project;
• the evaluation verified the scope of the proposed objectives and results, but also
the unforeseen and potentializing results of the program and
• the evaluation considered, the criteria of efficiency, effectiveness, equity and
sustainability.
2
LEÃO, Marília (Org.). Direito Humano à Alimentação Adequada e o Sistema Nacional de Segurança Alimentar e Nutricional.
Brasília, DF: ABRANDH, 2013, 263p.
3
FAO. Cómo mejorar el impacto de políticas de estado para el logro del ODS 2. Documento dirigido a asesores/as de los Frente
Parlamentario Contra el Hambre de América Latina y Caribe. Santiago - Chile, 2019
4
SANTARELLI, Mariana; BURITY, Valéria. Informe DHANA 2019. Brasília: FIAN Brasil. 2019. 102p.12
It is important to exemplify that the entire methodological process that will be
presented below already includes innovative tools and approaches for remote data
collection and thus the generation of evidence already adapted to mitigation measures of
social distancing during the COVID-19 pandemic.
1. Quantitative Data
A) Questionnaires
For the collection of responses to the quantitative assessment, the same baseline
questionnaire was used with some adaptations, such as the inclusion of specific questions
about the households´ coexistence with Covid-19, since there are already several studies
prepared by different agencies such as the Food and Agriculture Organization of the
United Nations – FAO5, United Nations Development Program, in addition to the
International Organization for Migration and the United Nations High Commissioner for
Refugees6 that focus mainly on migration and refugee. In addition, by the Brazilian
government, on the impacts of the pandemic on the food and nutritional security of
households nationally.
The questionnaires were applied to program beneficiaries in the municipalities of
the State of Roraima (Boa Vista, Amajari, Iracema, Mucajai, Caracarai, Paracaraima,
Rorainópolis) that make up the migratory corridor, and also to a portion of beneficiaries
of another program implemented by ADRA (SWAN program) and who have been
interiorized to other Brazilian states.
The questionnaires applied to the beneficiaries who live in the municipality of
Pacaraima, Roraima were the only ones carried out in person, since these two
communities do not have a cell phone signal, and ADRA´s local team provided the
support for this to happen. Moreover, some program beneficiaries live in three indigenous
reserves (Sorocaima I, Tarau Parú and Bananal) that are only accessible to Brazilian
government representatives and humanitarian organizations.
B) Sample
The sample universe consisted of all households and areas of geographical
implementation of the SAV-Ex program.
The sampling process was based on the guiding document of the consultancy for
the endline, the Statement of Work (SOW) Seguridad Alimentaria para Venezolanos –
Extended (SAV-EX) in Brazil, July 2020.
The final sample estimate is led by the Household Hunger Scale (HHS)7 indicator.
The Feed the Future comparative proportions TopUp sample-size calculator was used to
calculate the sample size. See attached calculator.
5
FAO. http://www.fao.org/americas/noticias/ver/pt/c/1273231/ - accessed on September 10, 2020.
6
ACNUR. https://www.acnur.org/portugues/2020/07/10/acnur-e-wfp-alertam-para-fome-e-desnutricao-de-refugiados-na-africa-
durante-pandemia/ - accessed on September 10, 2020.
7
The HHS indicator led the sample estimate as the FCS estimate (FCS sample was used in the baseline survey) would
have to be large with over 3,000 respondents to be statistically significant. The parameters used for the endline were13
n initial, actual 642
P1, actual 0.396
P2, target 0.30
1 -α 0.95
Z1-α 1.64
1 – β 0.8
Z1-β 0.84
D actual 2
K inflation Factor to apply to n initial, actual at time point 2 0.88
The sample was calculated at household level with an initial sample size of 564;
and a final number of households to sample at 706, which includes an anticipated
household non-response rate of 20%. Within cluster samples made up of municipalities
in Roraima and those interiorized under the SWAN project, a simple random sample
(SRS) was used to select direct participants from the program beneficiary register.
Data collection for the survey was carried out by telephone at this stage, as already
mentioned above, due to social distancing measures imposed by the covid-19 pandemic.
Thus, the final sample was 706 households, 662 of whom live in the municipalities of the
State of Roraima and 44 who live in other states of Brazil after the interiorization through
the SWAN program. Care was taken to include in the sample the group of beneficiaries
who participated in the baseline survey as a priority, and with this we have a greater
robustness that will enable the performance of a comparative study between the two
moments (initial and final).
For the analysis of the results, the interviews carried out were weighted according
to the same baseline criteria. Weights were adjusted to correct non-response, either due
to the respondent´s refusal or due to the impossibility of locating the household randomly
selected in the sample. The sample was selected taking as parameters the 95% confidence
interval and an error margin of ± 5%.
For the beneficiaries of the SWAN program, which were interiorized, all 07
(seven) states (Amazonas, Bahia, Minas Gerais, Mato Grosso, Paraná, Santa Catarina and
Rio Grande do Sul) were included in the sample.
Below is the sample size table:
Table 1: Sample Size
Municipalities in Project
Roraima Households Sample Weight % Sample Size = 706
Boa Vista 3878 71 502
Amajari 82 2 11
Iracema 94 2 12
Mucajaí 206 4 27
Caracaraí 156 3 20
Pacaraima 395 7 51
Rorainópolis 299 5 39
based on the baseline actual and the endline estimate (LOA). It needs to be noted that the parameters used for the
baseline survey were a low estimate.14
Relocation under SWAN
Project 340 6 44
5450 100% 706
Source: Designed by the consultancy based on the document Final Evaluation Statement of Work Food Security for
Venezolanos - Extended (SAV-Ex). Brazil, August 2020.
2. Qualitative Data
Structured interviews were carried out with technicians from the program´s
implementation team, partners and other stakeholders that are related to the theme of food
security with Venezuelan migrants living in Brazil. These interviews were conducted
through the virtual meet broadcast platform.
The following program implementation work groups were interviewed:
coordination of the SAV-Ex program, monitoring team, field officers’ team,
administrative team and the team responsible for hot meals and nutrition. In total, 25
(twenty-five) people participated in the interview activities.
In addition to this group that was directly involved with the implementation of the
SAV-Ex program, representatives of the coordination and monitoring of the SWAN
program were also interviewed, who also have a relationship with the SAV-Ex program,
since for a period SWAN´s interiorized beneficiaries received food vouchers once they
were interiorized.
Interviews were conducted with partners and other stakeholders that included
representatives from the offices of the International Organization for Migration – IOM
and Caritas Brasil, these are two humanitarian organizations that have dialogue and
partnership with the SAV-Ex program.
A) Qualitative Evaluation with Beneficiaries
Due to social isolation measures, it was not possible to carry out face-to-face focus
group discussions with project beneficiaries. Thus, they were carried out virtually from a
random selection of beneficiaries, using the WhatsApp tool as the driving force behind
this activity.
The choice was made at random and priority was given to the participation of men
and women who were household heads aged between 20 and 70 years. Households heads
have a main role as family providers of families and in this sense are fundamental for
understanding the levels of food and nutritional security of their household. For this, a set
of key and global questions (Annex 03) about the project was sent to selected
beneficiaries and the answers were returned in audio form. The whole process of this
activity had FOOD as a guiding element in the group discussions, as well as FOOD
SECURITY, HUNGER and PANDEMIA.
From then on, this consultancy carried out an analysis of the data generated from
the responses sent by the beneficiaries with the support of a specialized qualitative
methodology software, MAXQDA 2020.
As already mentioned in the previous item, the group of beneficiaries living in the
municipality of Pacaraíma were not included in this activity, since in indigenous villages15
there is no internet signal, which makes it impossible for beneficiaries to send information
via WhatsApp.
The choice of participants was made at random and priority was given to the
participation of male and female beneficiaries who were household heads and aged
between 20 and 70 years.
Table 2: Beneficiaries Group Sample
Municipalities Total Number of Participants
Boa Vista 45
Amajari 8
Iracema 8
Mucajaí 12
Caracaraí 10
Rorainópolis 15
Relocation under SWAN Project 18
TOTAL 116
Source: Designed by the consultancy
Study Limitations
Despite the achievement of the planned objectives for both qualitative and
quantitative samples, we know that a final assessment study remotely has some
limitations. These limitations basically reflect the change in the methodology of the
interviews and the pandemic moment we are going through.
1. In terms of methodology, while in the baseline the face-to-face approach
was used and worked well as there is usually more time for beneficiaries
to share their stories. For the endline, due to the pandemic and the rules of
social distancing the interviews were conducted over the phone, which
could lead to errors, even though some information has been verified.
2. This is not an impeccable method, especially since the interviewer does
not see the interviewee. Using the phone also restricts the amount of time
available and how focused the respondents are, which can result in some
reasonably large differences between the two results.
3. When issues are related to aspects of SAN, another challenge that arises is
the psychological and social factors that affect many heads of households
because they live in a situation of social vulnerability and the possibility
of food insecurity. Such threats are reflected in feelings of shame and
immobility in the face of this situation.
However, some statistical experts consider that “to reduce possible
inconsistencies, one of the possible solutions is to increase the number of people heard
on the methodology by telephone. Because they argue that the larger the sample, the
smaller the error.” 8 This aspect reassures this consultancy since there was an increase of
10% in the sample size when comparing the baseline and the endline.
8
https://politica.estadao.com.br/noticias/eleicoes,entenda-as-diferencas-entre-pesquisas-eleitorais-presenciais-e-por-
telefone,70002465734 – accessed on September 08, 2020.16
Any sample survey cannot represent only the sampled unit, but it represents the
entire population. As the SAV-Ex program is not static, but dynamic, the total number of
households and individuals being assisted change over time. This means that, during the
baseline, the total number of individuals sampled represented “X” households, each with
a specific research weight to represent the entire population presented at that time. At any
time in the future, the number of household’s change, which changes the general profile
of households at that time representing “Y” households. This means that, at point t and
point t + 1, these research weights will necessarily have different weights because they
represent different populations. In the results presented comparatively using the baseline
and the endline, the weights used were those of the latter, which may explain some
differences presented in the baseline.
Regarding qualitative data in a face-to-face focus group, it is more productive and
with more significant results where it is also possible to analyze the reactions from
participants´ reflections.
II. RESULTS, DISCUSSION AND ANALYSIS
1. PROFILE OF RESIDENTS IN RESPONDENT HOUSEHOLDS
As expected, women represent the majority of respondents. In both the baseline
and endline surveys, women were about 73% of the people interviewed.
Graph 1: Gender of respondents
100%
26.7% 27.2%
73.3% 72.8%
0%
Baseline Endline
Women Men
Source: Designed by the consultant from the results of the quantitative research (2020).
Sample=642 respondents (baseline)/706 respondents (endline).
The average age of respondents is 35 years old, both in the baseline and endline
surveys. Considering half of the respondents according to the age distribution, the median17
age observed was 32 years in the baseline and 33 years in the endline. Regarding the age
distribution in groups of respondents in the baseline, there was a concentration of
respondents between 17 and 25 years old (28.2%), while in the endline, the group between
31 and 40 years old was the most frequent (32.0%). In both surveys, respondents up to 40
years old were approximately 72% of respondents.
Before starting the analysis of the indicators, it is important that the results related
to the profile of household members are presented, as this data is important so that any
aspects related to nutritional food security can be analyzed, after all, to measure the
indicators it is necessary to know the average family size, as well as the age of household
members.
Graph 2, below shows that 70% of the households surveyed have up to four
residents. A higher proportion of households with more residents, five to nine, was
observed at the endline level (31.7%). This is a characteristic very present in Venezuelan
migrants living in Brazil today and this is very characteristic in beneficiaries´statements
such as this “we started to have a little more to eat, we have already tried to bring some
other family members who are in Venezuela. There the situation is very difficult and here
with what the project provides us we already bring children, parents or other relatives.” 9
This average household size did not increase so much compared to other endlines
of food security programs. One of the factors responsible for this is that due to the
pandemic, Brazil´s borders with other countries were closed. According to studies by the
Organization of American States, it is estimated that “about 111,000 Venezuelans
returned to their home country from Brazil and Colombia due to the Covid-19 pandemic.
Many of the refugees were dependent on informal income and saw their living conditions
affected by the coronavirus.” 10
The table below indicates that the average household size is between 3.43 and
4.84.
Table 3: Average size of the families by gendered households
Average size
Baseline Endline*
F&M 4,15 5,21
FNM 2,55 4,06
MNF 2,01 3,05
Total 3,43 4,84
Source: Designed by the consultant from the result of the quantitative research (2020)
* Considers the number of people who live with the respondent plus the respondent
9
Roraima, Boa Vista beneficiary´s statement collected at a virtual focus group in October 2020.
10
https://veja.abril.com.br/mundo/com-a-pandemia-cerca-de-6-000-venezuelanos-voltaram-do-brasil/ - accessed on October 12
2020.18
Graph 2: Number of persons living with the respondents
100%
74.2%
67.5%
31.7%
25.7%
0.2% 0.8%
0%
1 - 4 persons 5 - 9 persons 10 persons or more
Baseline Endline
Source: Designed by the consultant from the result of the quantitative research (2020).
Sample=642 respondents (baseline)/706 respondents (endline).
It is common for people of different age groups to compose households, ranging
from children under 5 years old to elderly people over 60 years old. Household members
between 21 and 30 years old were slightly more frequent at baseline level, whereas at
endline level, household members were distributed in similar proportions between 11 and
40 years old. It is important to note that in households headed by women, children,
adolescents and young people from 0 to 20 years old are more common. Also in 57% of
households headed by women, there are children from 0 to 5 years old, as shown in the
Graph, below.
Graph 3: Age group of persons living with respondents by head
of household gender (Final)
75%
56.7%
44.3%
51.5% Men Women
46.7% 45.0% 46.2% 46.1%
43.9%
39.2%
31.6%
28.1%
20.9% 14.9%
14.6%
11.7% 9.7%
0%
0-5 years 6-10 11-20 21-30 31-40 41-50 51-60 Over 60
old years old
Source: Designed by the consultant from the result of the quantitative research (2020).19
2. ANALYSIS OF PROGRAM INDICATORS
2.1. Reduced Coping Strategies Index (rCSI)
In relation to the reduced coping strategy index (rCSI), which is based on the
frequency during the last seven days in which any of the coping strategies of food
restriction is used, the results obtained at endline level are described in Table 4 below:
Table 4 – Affirmative food insecurity questions in the last 7 days
3 or more
1 – 2 days per
Never days per Daily
week
week
A) Need to rely on less preferred or cheaper
16,2% 21,3% 31,0% 31,5%
foods
B) Had to ask for food or depend on help from a
42,6% 33,9% 16,7% 6,8%
friend or family member to feed
C) Limited size of portions in meals 30,7% 16,0% 31,8% 21,4%
D) Restricted adult food intake so that young
60,0% 13,4% 14,6% 12,0%
children could eat
E) Reduce the amount of meal eaten in a day 42,0% 14,7% 25,3% 18,0%
Source: Designed by the consultant from the result of the quantitative research (2020).
Sample=706 respondents (endline).
It is observed that the most common strategies used are the following:
• Need to rely on less preferred or cheaper foods – 83,8%;
• Limited size of portions in meals – 69,20%;
• Reduce the amount of meals eaten in a day – 58,0%;
• Had to ask for food or depend on help from a friend or family member to feed –
57,4%;
• Restricted adult food intake so that young children could eat – 40,0%.
The highest percentages were those that deal with the need to have less preferred
or cheaper foods (83.8%) and limited the portion sizes at meals (69.20%). This type of
experience is an extremely common attitude in vulnerable groups. It is already known
that “socioeconomic factors in a specific way play a central role in defining what people
eat and are determinants of choices, as well as food motivations. Thus, people generally
know how much is “enough” and seek to find options to guarantee what to eat. 11
Disaggregating by gender of respondents, the averages of each of the strategies
used, as well as the general average of the reduced CSI, are shown in Graph 4:
11
MORAES, Jéssica Maria Muniz. Porque as pessoas comem o que comem? Comparação das motivações para comer entre dois
contextos socioeconômicos díspares no Brasil. Dissertação de Mestrado: Universidade de São Paulo. São Paulo, 2017. 131p.20
Graph 4: Average strategies used and total reduced CSI by head
of household gender
0 30
17.2 Total
Reduced CSI 16.8
17.3
Men
Need to rely on less preferred or cheaper 3.7 Women
4.0
foods 3.6
Had ask for food or depend on help from a 3.1
3.4
friend or family member to feed 3.1
3.0
Limited size of portions in meals 2.9
3.1
Restricted adult food intake so that young 4.8
3.9
children could eat 5.1
2.5
Reduce the amount of meal eaten in a day 2.6
2.4
Source: Designed by the consultant from the result of the quantitative research (2020).
The average total household score (reduced CSI), with the appropriate weights
(expansion factor) was 17.2 points, with a median of 14 points and standard deviation of
13.3 points. Considering the 95% confidence interval, the result is between 16.2 and 18.4
points.
With this total rCSI of 17.2 points, we have a situation of food and nutritional
security considered satisfactory for all beneficiaries, since the lower the score, the better
the situation of food security.
Table 5 - Reduced CSI by household head gender
95% Confidence interval
Std.
Mean rCIS Median Variance
Deviation Upper
Lower limit
limit
Total 17,2 14,00 177,1 13,3 16,2 18,2
rCSI Men 16,9 14,00 202,8 14,2 14,9 18,9
Women 17,3 14,00 167,7 12,9 16,2 18,4
Source: Designed by the consultant from the result of the quantitative research (2020)
An important data to be described is that 6.4% of households obtained a score of
0 (zero) in the rCSI and only 2.4% obtained the highest score of 56 points in the rCSI.21
The data in the table above also reveal that among households headed by women,
the average score is higher than among men. This is a totally predictable situation, since
it is a consensus in several studies that women have a fundamental role in improving their
families´ food and nutritional security indexes, where they often end up not eating to feed
their families.
The data in Table 6 also confirm the situation of greater food insecurity among
women: in households where there are no adult men, the average score is higher than in
those where adult men and women live together and in households where only adult men
live.
Table 6 - Reduced CSI by gendered household
F&M FNM MNF Total
Mean 17,3 17,4 15,6 17,2
St. Dev. 13,5 12,7 12,9 13,3
CI (95%) Lower 16,2 15,1 12,1 16,2
CI (95%) Upper 18,5 19,6 19,1 18,2
Median 14,00 15,00 13,0 14,0
Sample 540 128 55 723
Source: Designed by the consultant from the result of the quantitative research (2020)
To conclude the information for this indicator, with the data in the Table above, it
can be said that the program managed to surpass the planned target of reaching a total
rCSI of 20 points, as well as this same score for FNM, MNF and M&F headed households.
2.2.Household Hunger Scale (HHS)
The HHS is a measure that analyzes the aspects related to food access for families,
it is built around three questions about the perceptions of a house in varying degrees of
hunger by the number of times they have experienced hunger in the last 30 days prior to
the survey. The higher the HHS, the more severe the hunger.
In percentage terms, affirmative responses from HHS were: Was there a day
where there was no food to eat at all (53.7%), did you or any household member go to
sleep at night hungry because there was no enough food (21 , 5%) and did you or any
household member go a whole day and night without eating anything at all because there
was not enough food (11.7%).
This result, when compared to the baseline level, already shows a substantial
improvement mainly in the experience related to did you or any household member go to
sleep at night hungry because there was no enough food, at endline this type of experience
is 21.5% and at baseline it was 35.5%, a decrease of 14%.22
Table 7 – Household Hunger Scale (HHS) frequencies
Often
Rarely Sometimes
Never (more than
(1-2 times) (3-10 times)
10 times)
1) In the past month, was there a day where there
46,3% 30,3% 19,9% 3,5%
was no food to eat at all?
2) In the past month, did you or any household
member go to sleep at night hungry because there 78,4% 10,9% 9,1% 1,5%
was not enough food?
3) In the past month, did you or any household
member go a whole day and night without eating 88,2% 6,6% 4,7% 0,4%
anything at all because there was not enough food?
Source: Designed by the consultant from the result of the quantitative research (2020).
Sample=706 respondents (endline).
Disaggregated by sex, the averages of each of the questions on the hunger scale,
as well as the general average of the HHS are shown in Graph 5:
Graph 5: Average HHS by gendered household
0.00 1.40
0.92
0.96
HHS - Household Hunger Scale
0.91
0.55
Total
0.57
In the past month, was there a day where there 0.57
was no food at all? 0.59 F&M
0.55
FNM
0.23
In the past month, did you or any househld
0.23
member go to sleep at night hungry because MNF
0.22
there was no enough food?
0.25
0.12
In the past month, did you or any househld
0.11
member go a whole day and night without
0.13
eating because there was no enough food?
0.25
Source: Designed by the consultant from the result of the quantitative research (2020).
The average HHS of all respondents was 0.92 points, with a median of 1.00 points,
and standard deviation of 1.06 points. The 95% confidence interval has a lower limit of
0.84 and an upper limit of 0.99. The results reinforce the evidence of a situation of greater
food insecurity in households headed by women. As previously mentioned, a common
situation in any reality and food security projects.23
The gross HHS score ranges from 0 to 6 points. Gross scores are tabulated in the
following categories: (0-1) little or no hunger; (2-3) moderate hunger; and (4-6) severe
hunger.
Graph 6: HHS Hunger categories by head of household gender
100% 1.7% 0.0%
1.5% 1.6%
10.9%
21.6% 23.0% 21.1%
89.1%
76.9% 75.4% 77.3%
0%
Total F&M FNM MNF
Little to no hunger (HHS 0-1) Moderate hunger (HHS 2-3) Severe hunger (HHS 4-6)
Source: Designed by the consultant from the result of the quantitative research (2020).
The majority (76.9%) of respondents fall into the category of little or no hunger.
Moderate or severe hunger affects about two thirds of households (23.1%), being less
common in male headed households (10.9%). It is worth noting that moderate or severe
hunger showed a significant reduction, of 16.5 percentage points, when comparing
baseline and endline results (from 39.6% to 23.1%).
Regarding program targets, some points deserve a reflection:
1. For the aspects of moderate hunger, the total index that the project should
reach at endline level would be 30%. The project managed to advance
further, as it had a lower rate than planned, reaching 21.6% of beneficiaries
with moderate hunger. This is extremely positive as it has improved the
planned index even further by moving 8.4% of the total program
beneficiaries in the moderate hunger to the category of little or no hunger;24
2. With regards to severe hunger, the program did not achieve the total target
of 0 program beneficiaries in this category. Nevertheless, the program has
managed to reach a very low percentage in this group, which is 1.5%.
If we consider the reality of Brazil today, the beneficiaries of the program are in a better
situation than the Brazilian population and the population of the northern region of the
country – where the state of Boa Vista is located. Brazil is currently experiencing serious
problems with regards to food and nutritional security. According to data from the
Brazilian Institute of Geography and Statistics, which just presented the Family Budget
Survey, “the scenario of food insecurity has been frequent in Brazil and that situation
today only in the northern region of the country with families in total restriction of food
insecurity is 10.2%. ” 12 The former director-general of the United Nations Food and
Agriculture Organization, the situation in Brazil today is “extremely worrying and the
country is returning to the Hunger Map. Today 4.6% of the population live in severe
hunger.” 13
Regarding other program targets for this indicator in relation to moderate hunger,
the program´s performance was better than planned. In relation to severe hunger the
program did not reach the target, except for the MNF category where the target was met.
The Table below shows the planned targets and the indexes that were reached at endline.
Table 8 – Comparison of the HHS indicator between the planned and achieved
target at
endline
PLANNED TARGET TARGET REACHED AT
ENDLINE LEVEL
TOTAL
Moderate 30% 21,6%
Severe 0 1,5%
FNM
Moderate 32% 23%
Severe 0 1,7%
MNF
Moderate 27% 10,9%
Severe 0 0
M&F
Moderate 26% 23%
Severe 0 1,7%
Source: Designed by the consultant from the result of the quantitative research (2020).
2.3.Food Consumption Score (FCS)
12
BRASIL. https://agenciadenoticias.ibge.gov.br/agencia-noticias/2012-agencia-de-noticias/noticias/28903-10-3-milhoes-de-
pessoas-moram-em-domicilios-com-inseguranca-alimentar-grave - accessed on October 02, 2020.
13
GRAZIANO DA SILVA, José. https://valor.globo.com/opiniao/coluna/por-que-o-brasil-voltou-ao-mapa-da-fome.ghtml -
accessed on October 02, 2020.25
The FCS is a score that considers the basis of food diversity, food frequency and
the relative nutritional importance of different food groups. Nine distinct food groups are
analyzed: staple foods, legumes and nuts, vegetables, fruits, meats, dairy products, sugars,
oils and condiments. In this indicator, it is important to analyze the frequency of
consumption of these products over the past seven days. It is an indicator that allows for
qualitatively and quantitatively assessment of individual consumption and that of other
members of household. It is also important to understand the form of food acquisition and
the food diversity of respondents.
Table 9 – Food frequency by type
3 or
1–2
more
Never days per Daily
days per
week
week
1. Main staples: maize, rice, sorghum, other cereals; tubers;
1,1% 29,0% 26,2% 43,6%
plantains.
2. Pulses Beans, peas, groundnuts and cashew nuts 7,1% 51,7% 26,8% 14,4%
3. Vegetables (vegetables and leaves) 6,6% 54,1% 26,8% 12,4%
4. Fruits 18,5% 47,6% 23,5% 10,4%
5. Meat/fish: beef, goat, poultry, pork, eggs and fish 4,0% 31,3% 32,5% 32,2%
6. Milk, yogurt and other dairy products 9,1% 40,0% 30,3% 20,6%
7. Sugar and sugar products, honey 2,2% 27,5% 32,9% 37,3%
8. Oils, fats and butter 2,1% 38,0% 22,4% 37,5%
9. Condiments 8,0% 33,7% 20,9% 37,3%
Source: Designed by the consultant from the result of the quantitative research (2020).
Sample=706 respondents (endline).
Among the least consumed food groups are fruits, vegetables, leaves and grains
according to the highest percentages of “never consumes” and consumption between 1 or
2 days a week.
The endline comes to the same conclusion as the baseline, in relation to the
consumption of fruits, vegetables, leaves and grains. These items remain the least
consumed. However, despite this challenge that remains, it is important to exemplify that
there was an improvement in percentage terms of consumption (Table 10). Of course, it
is not yet an ideal percentage.
To analyze this food consumption indicator, we identified in the virtual focus
groups some statements by beneficiaries about the high cost of these food items and that
many beneficiaries ended up choosing to purchase products with lower cost:
“With the pandemic, open markets closed and the price of fruits and vegetables
ended up increasing in supermarkets here in Boa Vista. I had never seen the price
of these foods get so expensive ”; 14
14
Roraima, Boa Vista beneficiary´s statement collected at a virtual focus group in October 202026
“For my family it was a very big challenge to buy fruits and vegetables because
always in places that accepted the card it is more expensive than at feiras livres
and for me it still has a more complicated situation: the card is not accepted here
in Iracema, Roraima. So, we gathered a group of beneficiaries who rented a car to
go shopping in the neighboring city. So, we ended up buying what is cheaper and
we still have the expense of renting the car. That’s why we don´t consume so many
vegetables and fruits.” 15
“With the card, I learned how to manage my family´s budget, because when we
lived in Venezuela, my husband was doing this and now I am the one who controls
everything, so with the SAV-Ex card today I have bought the most expensive
foods like meats and chickens and sometimes fruits and vegetables that weren´t
that expensive, and now, with the pandemic, these vegetable products have
increased prices a lot. ” 16
“These foods that I receive with the card are essential for me to be able to feed my
three daughters, I know it is not enough, but with what we buy we supply the
family´s basic food needs. I always try to make the equitable distribution of the
types of food and thus balance the food in our home, but it is being very difficult
to acquire the healthiest foods at this time, as they became very expensive. I´m
getting the impression that eating now is more expensive here in Boa Vista.” 17
“Today I have managed to acquire eggs, pasta, beans, margarine and a little bit of
vegetables and cassava through the project. I think these are very nutritious foods
and have a tremendous number of vitamins. And here in Brazil I learned to value
a dish of rice and beans because I know that it cures many needs.” 18
This is the third food security program for this specific target public, however,
this reality is not only a challenge of food consumption for the program´s beneficiaries:
it is a reality about the food consumption of the most needy populations. According to
IBGE data, based on the latest survey by the Brazilian Scale of Food and Nutritional
Insecurity, published in September this year, it states that “expenditure on food points out
that the majority of spending between food groups decreases as levels increase of food
insecurity. In other words, people who have greater restrictions on access to food
consumption spend less on certain products, such as fruits, meats and dairy products.”
The sources of food acquired in the last seven days by the households shows how
households acquired the food consumed by them. These sources are divided into primary
and secondary sources and are divided into purchased, produced at home, exchanged,
borrowed, given by food aid organizations or other means.
Regarding the primary source of food, for purchase or food aid corresponds to
93% of the food consumed. Among secondary sources, purchased foods are the most
15
Roraima, Iracema beneficiary´s statement collected at a virtual focus group in October 2020
16
Roraima, Rorainopolis beneficiary´s statement collected at a virtual focus group in October 2020
17
Roraima, Boa Vista beneficiary´s statement collected at a virtual focus group in October 2020
18
Roraima, Rorainópolis beneficiary´s statement collected at a virtual focus group in October 2020You can also read