ELECTRIC BUS TECHNOLOGY - TRANSPORT RESEARCH REPORT - MRCagney
←
→
Page content transcription
If your browser does not render page correctly, please read the page content below

ELECTRIC BUS
                TECHNOLOGY
                         TRANSPORT RESEARCH REPORT
                                                                 June 2017

                                                          BETTER TRANSPORT • BETTER PLACES • BETTER CHOICES

                            in association with the Transport and Economic Research Institute
1   ATTACHMENT A - TTA17-005 RFQ: Passenger Transport Research and Strategic Advisory Services – March 2017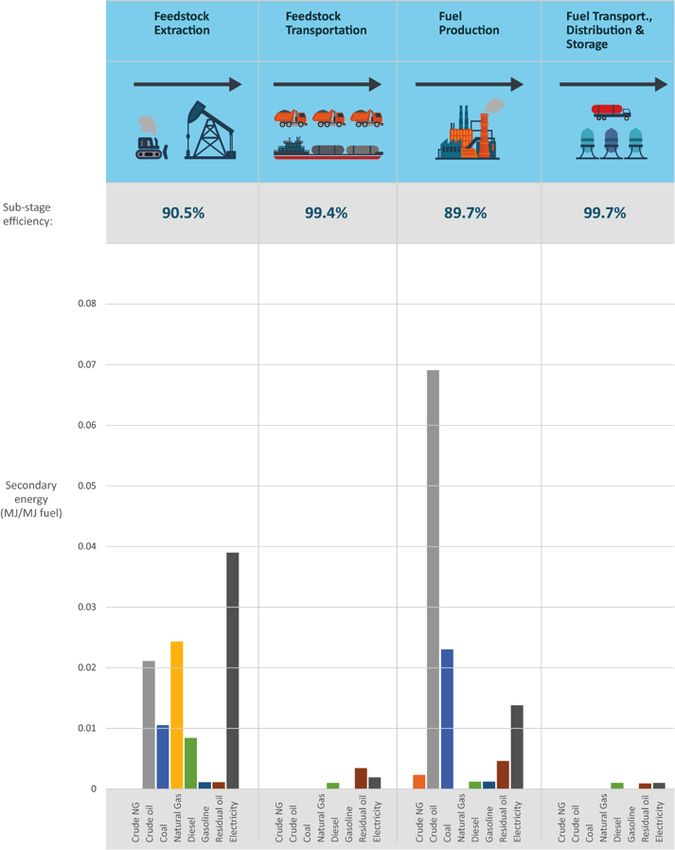
DOCUMENT INFORMATION

Acknowledgements

This research was undertaken with partial funding from Callaghan
Innovation.

For further information on the findings of this report please contact:

Australia                                           New Zealand
Leslie Carter                                       Jenson Varghese
Managing Director                                   Regional Manager New Zealand
lcarter@mrcagney.com                                jvarghese@mrcagney.com
+61 7 3320 3600                                     +64 9 377 5590

This report has been prepared by MRCagney Pty Limited (MRCagney). It is provided to the general public for information purposes only, and MRCagney makes no express or
implied warranties, and expressly disclaims all warranties of merchantability or fitness for a particular purpose or use with respect to any data included in this report. MRCagney
does not warrant as to the accuracy or completeness of any information included in the report and excludes any liability as a result of any person relying on the information set out
in the report. This report is not intended to constitute professional advice nor does the report take into account the individual circumstances or objectives of the person who reads
it.

www.mrcagney.com

ii Electric Bus Technology - Final Report - June 2017
CONTENTS
         ACRONYMS AND ABBREVIATIONS                                                        viii

1.       INTRODUCTION                                                                      1
1.1      Buses in Public Transport                                                         1
1.2      Why Electric Buses, Not Improved Diesel Buses?                                    1
1.3      Report Outline                                                                    2

2.       OVERVIEW OF TECHNOLOGIES                                                          3
2.1      Hybrid Electric Buses                                                             4
2.1.1    Hybrid Configurations                                                             5
2.1.2    Degree of Hybridisation                                                           7
2.1.3    Mechanisms for Improved Efficiency                                                7
2.1.4    Recent Developments in Hybrid Technology: Turbine Engines                         7
2.2      Fuel Cell Electric Buses                                                          8
2.2.1    Fuel Cell Configurations                                                          9
2.2.2    Competing Technology: Hydrogen as a Fuel Source for Internal Combustion Engines   9
2.3      Battery Electric Buses                                                            9
2.3.1    Battery Configurations                                                            10
2.3.2    Battery Electric Bus Categories                                                   11
2.4      Ultracapacitor Electric Buses                                                     11

3.       PERFORMANCE OF ALTERNATIVE BUS TECHNOLOGIES                                       13
3.1      Economic Performance                                                              13
3.1.1    Hybrid Electric Bus Costs                                                         13
3.1.2    Battery Electric Bus Costs                                                        14

iii Electric Bus Technology - Final Report - June 2017
CONTENTS 3.1.3 Fuel Cell Electric Bus Costs 15 3.1.4 Economic Performance Sensitivity 16 3.2 Operational Assessment 16 3.2.1 Hybrid Electric Buses 16 3.2.2 Battery Electric Buses 16 3.2.3 Fuel Cell Electric Buses 17 3.2.4 Impact of Increased Vehicle Mass 19 3.3 Environmental Assessment of Electric Buses and Energy Pathways 23 3.3.1 Environmental Assessment Details 23 3.3.2 Environmental Impact from Operation of Electric Buses 24 3.3.3 Environmental Impact from Non-Operational Processes 27 3.4 Life Cycle Assessment of Electric Bus Technology 27 3.5 Energy Efficiency 30 3.5.1 Bus WTW Energy Efficiency Data for China 32 3.6 Summary of Performance of Electric Bus Technologies 36 4. CURRENT AND PROJECTED MARKET SHARE 38 5. CONCLUSION 39 APPENDIX A: COMMON TERMS USED IN BUS ASSESSMENTS 40 APPENDIX B: INTERNATIONAL CASE STUDIES 41 B.1 BATTERY ELECTRIC BUS CASE STUDIES 41 iv Electric Bus Technology - Final Report - June 2017
CONTENTS

B.1.1   THE MILTON KEYNES DEMONSTRATION PROJECT                                      41
B.1.2   Foothill Transit In-Service BEB Fleet Assessment                             42
B.2     Fuel Cell Electric Bus Case Studies                                          44
B.2.1   Zero Emission Bay Area (ZEBA) Demonstration Project in Oakland, California   44
B.2.2   American Fuel Cell Bus Project in Coachella, California                      44
B.2.3   BC Transit Fuel Cell Bus Project in Whistler, Canada                         45
B.3     Hybrid Electric Bus Case Studies                                             45

APPENDIX C: REFERENCES                                                               48

v Electric Bus Technology - Final Report - June 2017
FIGURES
Figure 1:    The defining components of different types of electric buses                                            11
Figure 2:    Conventional diesel bus configuration                                                                   13
Figure 3:    Conventional series hybrid electric configuration                                                       13
Figure 4:    Alternative series hybrid electric configuration                                                        13
Figure 5:    Parallel hybrid configuration                                                                           14
Figure 6:    Mixed (series-parallel) hybrid configuration                                                            14
Figure 7:    Early fuel cell electric bus configuration                                                              17
Figure 8:    Hybridised fuel cell electric bus configuration                                                         17
Figure 9:    BEB configuration                                                                                       18
Figure 10:   Image showing rooftop gaseous hydrogen storage (Pocard & Reid, 2016)                                    26
Figure 11:   Bus kerb weight and range                                                                               28
Figure 12:   Adult passenger capacity under various axle limits, including benchmark of approximate capacity         29
Figure 13:   Required increase in axle limits for buses to operate at full capacity in Australia and New Zealand     29
Figure 14:   Relationship between fully loaded vehicle weight and range                                              30
Figure 15:   Different energy sources undergo different processes, leading to different well-to-wheel emissions      32
Figure 16:   Electric bus and DB LCA results in US context, (Cooney, Hawkins, & Marriott, 2013)                      36
Figure 17:   Electric bus and DB LCA results with use phase EB results reduced by 79%,
             to represent NZ electricity sources, (Cooney, Hawkins, & Marriott, 2013)                                37
Figure 18:   Secondary energy usage (and sub-stage efficiency) over the diesel WTT energy pathway in China           41
Figure 19:   Secondary energy usage (and sub-stage efficiency) over the hydrogen WTT energy pathway in China         41
Figure 20:   Primary (fossil based) energy use for three secondary energy sources (over the entire energy pathway)   42
Figure 21:   Hydrogen and diesel WTT energy efficiency: primary energy expenditure during each WTT sub-stage         42
Figure 22:   WTT, TTW and WTW energy consumption for in-operation buses in China                                     43
Figure 23:   Performance of alternative powertrain buses compared to diesel buses                                    44
Figure 24:   Volume and break-down of US electric bus market, (Mahmoud, Garnett, Ferguson, & Kanaroglou, 2016)       46

vi Electric Bus Technology - Final Report - June 2017
TABLES Table 1: Acronyms and abbreviations viii Table 2: Key for vehicle configuration figures 13 Table 3: Average costs of electric buses in published articles 22 Table 4: Overnight BEB TCO sensitivity to parameter adjustments 24 Table 5: WTT GHG emissions 33 Table 6: GHG emissions from DBs and electric buses 34 Table 7: Methods for quantification of bus energy efficiency 39 Table 8: Subscript and superscripts used in energy efficiency equations 39 Table 9: Summary of performance indicators 45 vii Electric Bus Technology - Final Report - June 2017
ACRONYMS AND ABBREVIATIONS

 Acronym                               Meaning                       Acronym      Meaning
 AFCB                                  American Fuel Cell Bus        KBRC         kilometres between road calls
 BEB                                   battery electric bus          kW           kilo Watt
 BEV                                   battery electric vehicle      kWh          kilo Watt hour
 CNG                                   compressed natural gas        L            litre
 CO2 eq                                carbon dioxide equivalent     LCA          life cycle assessment (or life cycle analysis)
 DB                                    diesel bus                    MBRC         miles between road calls
 DGE                                   diesel gallon equivalent      mi           mile(s)
 DOE                                   (U.S.) Department of Energy   MJ           mega joule(s)
 EM                                    electric motor                MJ/MJf       Mega joules per mega joule transported
 EV                                    electric vehicle              NG           Natural gas
 FCEB                                  fuel cell electric bus        NGSR         natural gas steam reforming (for H2
                                                                                  production)
 GGE                                   gasoline gallon equivalent    NOx          nitrogen oxides
 GHG                                   greenhouse gas                NREL         (U.S.) National Renewable Energy Laboratory
 g                                     grams                         PEMFCs       polymer electrolyte membrane fuel cells (or
                                                                                  proton exchange membrane fuel cells)
 H2                                    hydrogen                      PMx          particulate matter (also called particle
                                                                                  pollution) with a diameter of micrometres or
                                                                                  smaller
 HEB                                   hybrid electric bus           powertrain   the vehicle components that generate power
                                                                                  and deliver it to the wheels
 HEV                                   hybrid electric vehicle       TCO          total cost of ownership
 HFCV                                  hydrogen fuel cell vehicle    TTW          tank-to-wheel
 hp                                    horse power                   WTT          well-to-tank
 ICE                                   internal combustion engine    WTW          well-to-wheel
Table 1: Acronyms and abbreviations

viii Electric Bus Technology - Final Report - June 2017
1. INTRODUCTION
The purpose of this report is to summarise the current status of electric bus In doing so, we consider three main types of electric buses: the hybrid
technology for a New Zealand audience. The motivation for compiling this electric bus (HEB), the fuel cell electric bus (FCEB), and the battery electric
report reflects growing interest in electric vehicle technologies in general, as bus (BEB). This discussion focuses on aspects of the technologies, and
well as increasing support for electric public transport in particular. their potential market share, operational performance, and environmental
performance.
1.1 Buses in Public Transport 1.2 Why Electric Buses,
Buses are the dominant form of public transport in New Zealand. In Not Improved Diesel Buses?
2015, 112 million passengers were recorded boarding buses around New
Zealand (Ministry of Transport, 2016), which represented 78% of total All well-utilized buses, regardless of which type of powertrain
public transport boarding’s nationally1. Moreover, bus patronage is growing (mechanisms for generating bus propulsion) is used, offer an efficient
fast; between 2001 and 2015 bus patronage increased by 60%, or 3.4% public transportation method when compared to car usage; buses are
per annum (Ministry of Transport, 2016). These numbers exemplify the space, energy and emissions efficient (UITP - Union Internationale des
important contribution of buses to public transport in New Zealand’s cities Transports Publics, 2011). A diesel bus2 at 20% capacity, for example,
and towns. produces approximately one-third of the CO2 emissions per passenger
kilometre compared to the equivalent number of private vehicles3 required
Bus technology continues to develop as other technologies improve; to transport the same number of people. When the bus is at full capacity,
buses are constantly improving in energy efficiency, passenger comfort, the reduction in CO2 emissions increases to more than 90% (UITP - Union
and reducing air pollution. Some of these improvements in New Zealand Internationale des Transports Publics, 2011).
have been driven by regulatory standards for urban passenger buses
(NZ Transport Agency, 2014). More broadly, however, there seems to The first reason for considering electric buses rather than diesel is that
be heightened community awareness of the benefits of clean, while diesel buses are more efficient than private vehicles, they still make a
comfortable buses. significant contribution to GHG emissions, which could largely be reduced
by utilising electric buses. Many national and regional governments around
Given the important role of buses in New Zealand’s public transport the world are thus investigating measures to reduce GHG emissions from
networks, as well as changing technology and community expectations, their public transport fleets by investing in alternative powertrains.
this report seeks to provide an overview of current electric bus technology.
1
The remainder was made up of 26 million train passenger boardings (18%) and nearly 6 million ferry passenger boardings (4%).
2
12 metre standard bus with 80 passenger capacity.
3
Here passenger cars have an assumed efficiency of 8 litres/100km and an average occupancy of 1.2 passengers. As a reference: passenger vehicles (cars) in Australia, in 2014, had an
average fuel consumption of 10.7 litres/km (Australian Bureau of Statistics, 2015); new vehicles in the EU require an average emissions level of 130 grams of CO2 per kilometre (g CO2/km) –
equivalent to a fuel efficiency of about 5.6 litres/100km (Directorate-General for Climate Action, 2016).
1 Electric Bus Technology - Final Report - June 20171. INTRODUCTION
Electric buses are also attractive because they support efforts to reduce built by UK bus manufacturing company Wrightbus (London Assembly,
local air pollution (“Doctors call for ban on diesel engines in London,” 2016). 2016). Cape Town, Copenhagen, Hamburg, Los Angeles, New York, Oslo,
Urban air quality is attracting increasing attention globally, and several Rugao (China), Amsterdam, and San Francisco have also committed to zero
international cities are moving to ban diesel vehicles from inner city roads emission bus fleets. Collectively, these cities have agreed to adopt one-
over the next decade (Harvey, 2016). Even new, efficient diesel engines thousand “zero emission” buses in their public transport fleets over the next
emit dangerous substances such as nitrogen oxides (NOx) and particulate five-years (London Assembly, 2016).
matter (PM10). These pollutants are of particular concern in dense urban
areas with high numbers of pedestrians and cyclists, which are typical of the 1.3 Report Outline
conditions in which buses operate. Alternative bus powertrains that reduce
or remove the need for a diesel engine, while retaining the advantages of This report includes the findings on the research into electric bus
buses, are of growing interest, especially in dense urban environments. technology. In particular, this report comments on:
A third incentive to adopt electric buses in New Zealand is that they provide • Electric bus technologies which are currently available, and their recent
energy security and increase transport fuel diversity (Ally & Pryor, 2016). developments.
New Zealand’s transport industry uses oil to satisfy 98% of its energy
• Economic, operational, and environmental performance of electric buses.
demands (Ministry of Business, Innovation & Employment, 2016), while
approximately 70% of New Zealand’s oil is imported (Bartos, López-Bassols, • Life cycle analysis and energy efficiency analysis of electric buses.
Nishida, & Robertson, 2014). High dependence on imported fossil fuel • Current and predicted market share of electric buses.
makes New Zealand’s transport system more vulnerable to oil price changes
• A selection of electric bus trials around the world.
and shortages.
The advantages of electric buses have been recognised in the policies being
implemented in several major cities around the world. London has recently
announced that no new diesel buses will be purchased for its inner-city
routes from 2018 (London Assembly, 2016). Currently, London has three
fully electric bus routes, seventy-one zero emission buses in service, and has
purchased (in a joint EU-funded project) twenty hydrogen fuel cell buses,
2 Electric Bus Technology - Final Report - June 20172. OVERVIEW OF TECHNOLOGIES
Hybrid electric, fuel cell electric and full battery electric buses are currently • Hybrid electric buses (HEBs) generate electricity on-board during
being used in a number of public transport networks around the world. operation using a diesel engine.
Different types of electric bus technology vary in terms of whether electrical
• Fuel cell electric buses (FCEBs) use hydrogen fuel cells to generate
energy is generated or stored onboard, specifically:
electricity on-board during operation.
TYPES OF ELECTRIC BUSES
HYBRID ELECTRIC BUS D
Pump Diesel into bus ICE generates electrcity Battery stores electricity Bus is powered
FUEL CELL ELECTRIC BUS H
Pump Hydrogen into bus Fuel Cell generates electrcity Battery stores electricity Bus is powered
BATTERY ELECTRIC BUS
Charge bus with electricity Battery stores electricity Bus is powered
Figure 1: The defining components of different types of electric buses
4
Information source unless otherwise specified: (Varga, Iclodean, & Mariasiu, 2016).
3 Electric Bus Technology - Final Report - June 20172. OVERVIEW OF TECHNOLOGIES
• Battery electric buses (BEBs) store electricity on-board, and are charged 2.1 Hybrid Electric Buses
either overnight, or intermittently throughout the route (Mahmoud,
Garnett, Ferguson, & Kanaroglou, 2016). HEBs use both an internal combustion engine (ICE), which is usually diesel
powered, and an electric motor (EM) to power the vehicle. They are the most
Figure 1 outlines the main components involved in each electric bus common type of electric bus in operation globally, and continue to be the
technology option. Specific advantages and disadvantages to each type of most purchased type of new electric bus (Mahmoud et al., 2016).
powertrain will be discussed in their respective sections below, while a set
of common advantages and disadvantages across all types of electric buses The advantages and disadvantages of HEBs specifically are outlined here.
are outlined here4. Note the generic advantages and disadvantages of all electric bus types
mentioned at the start of Section 4.
ADVANTAGES
ADVANTAGES
• Emissions, less GHG and local pollutant emissions.
• Smaller technology changes, HEBs are a comfortable transition for many, as
• Reduced vibration, increasing passenger comfort and reducing damage to
they rely on much of the same technology as traditional DBs.
surrounding infrastructure.
• Noise, electric motors produce less noise than ICEs and do not keep
running when a bus is stationary.
DISADVANTAGES
• Fuel efficiency, all types of electric buses usually demonstrate increased • Heavy, powertrain components increase vehicle weight, potentially limiting
energy efficiency. what roads these buses can operate on.
DISADVANTAGES • Capacity, increased weight means that vehicle capacity is often reduced
due to maximum axle weight limits.
• Cost, electric bus options are currently more expensive to purchase than
their diesel alternatives. • Infrastructure, may require additional infrastructure, such as charging
• Infrastructure, electric bus options require different types of additional stations.
infrastructure. • Reliability, battery capacity and useful life may be reduced by extreme
temperatures (Buchmann, 2016).
4 Electric Bus Technology - Final Report - June 20172. OVERVIEW OF TECHNOLOGIES
2.1.1 Hybrid Configurations SERIES ARCHITECTURE
As well as an ICE and an EM, hybrid electric vehicle powertrains include In a series configuration (Figure 3 and Figure 4), the ICE never mechanically
an energy storage system (batteries or ultracapacitors), a generator, a propels the vehicle; instead it runs a generator to produce electrical energy,
power management system, and coupling elements to pair the mechanical which is then either delivered directly to the EM or sent to the energy
and electric systems. The configuration of these components takes three storage system for later use (Lajunen, 2014; Mahmoud et al., 2016).
main forms: series (serial), parallel, and series-parallel (mixed). In general, a
The main advantages of the series configuration include the freedom to
series configuration is more efficient for low speed operation and a parallel
place powertrain components almost anywhere within the chassis due to
configuration is more energy efficient for higher speed operation (Cobb,
the absence of a physical mechanical link between the ICE and the wheels
2014; Lajunen, 2014). Figure 2 shows the configuration of the components in
(Lajunen, 2014); and a more simplified energy management system, whereby
a standard diesel bus.
the generator simply generates energy to replenish the electricity storage
system, regardless of when that energy will be consumed by the vehicle
Acronym Meaning
AUX Auxiliary devices
EM Electric motor ICE GEN
FD Final drive (differential)
GEN Generator AUX EM TX FD
ICE Internal combustion engine
TC Torque coupler
BATTERY
Series
TX Transmission
Table 2: Key for vehicle configuration figures
Figure 3: Conventional series hybrid electric configuration
ICE GEN
EM
AUX ICE TX FD AUX
EM
Diesel BATTERY Series
(alt layout)
Figure 2: Conventional diesel bus configuration Figure 4: Alternative series hybrid electric configuration
5 Electric Bus Technology - Final Report - June 20172. OVERVIEW OF TECHNOLOGIES
(Lajunen, 2014). Varga et al. (2016) also notes the advantage of being able ICE can support it by directly supplying power to the wheels. Limitations
to position separate electric motors at each wheel delivering propulsion of the parallel configuration include the need to retain the mechanical
individually and removing the need for the final drive and transmission, as connection between the ICE and the wheels and the inability to directly
shown in Figure 4. charge the battery from the ICE.
The series configuration has two inherent disadvantages. Firstly, the electric
SERIES-PARALLEL ARCHITECTURE
motor(s), must be capable of delivering enough power to run the bus under all
operational conditions, as the ICE can never directly propel the bus (Varga et The series-parallel hybrid, or mixed hybrid, combines the configurations of
al., 2016). Secondly, the two instances of energy conversion in the series hybrid both the series and parallel architectures. As shown in Figure 6, the addition
powertrain reduce overall energy efficiency (Varga et al., 2016); kinetic energy of a generator and electrical pathway linking the ICE and on-board battery
produced by the ICE is converted into electrical energy by the generator, which allows for direct generation and storage of electricity, as occurs in the series
is then converted back into kinetic energy by the electric motor(s). The parallel hybrid architecture. Furthermore, a mechanical link from both the EM and
configuration does not experience this energy inefficiency. ICE to the wheels allows vehicle propulsion to be supplied independently, as
performed in the parallel configuration.
PARALLEL ARCHITECTURE
In the parallel hybrid drivetrain configuration, traction at the wheels can
ICE TX
be delivered by either the EM, the ICE, or a combination of both, shown in
TC
Figure 5. Unlike the series configuration discussed above, the ICE cannot
BATTERY EM FD
directly recharge the energy storage system. Instead, during deceleration
and braking, the electric motor is run in reverse and the electric energy AUX
generated is stored in the on-board batteries. In other words, unless the
Parallel
vehicle is capable of plug-in charging, which would allow it to be charged
from an external source, the only energy available for use by the electric
Figure 5: Parallel hybrid configuration
motor, is that which is stored during regenerative braking.
There are several advantages to the parallel architecture compared to the
series configuration. Most importantly, independent propulsion systems GEN ICE TX
allow the use of a propulsion source appropriate to the surroundings (Lowry TC
& Larminie, 2012). For example, a HEB with this configuration can use only BATTERY EM FD
the EM within the inner-city zones where reduced noise and air pollution
AUX
are important, and can switch to using the ICE once outside of the inner
city where faster acceleration and higher speeds might be important. Mixed
The parallel system also allows for a smaller electric motor, because if the
conditions require additional power beyond the capabilities of the EM, the Figure 6: Mixed (series-parallel) hybrid configuration
6 Electric Bus Technology - Final Report - June 20172. OVERVIEW OF TECHNOLOGIES
2.1.2 Degree of Hybridisation 2.1.4 Recent Developments in Hybrid Technology:
‘Degree of hybridisation’ is a term commonly used in discourse on hybrid Turbine Engines
electric vehicles, so it is useful to be aware of. Degree of hybridisation is Wrightspeed, a US based company started by Tesla, co-founder Ian Wright,
used in literature to describe both the proportion of maximum vehicle is producing serial hybrid electric motors that use an internal combustion
power delivered by the EM (Lowry & Larminie, 2012), and the amount of turbine engine instead of the usual internal combustion reciprocating
hybrid technology (e.g. stop-start technology5, regenerative braking, EM (piston) engine. Details from the Wrightspeed website claim their hybrids
propulsion) incorporated in a vehicle (Cobb, 2014). These two definitions reduce fuel consumption by approximately 70% and reduce criteria
are essentially the same, as the more relative power produced by the pollutants by up to 90% (“Wrightspeed Powertrains Official Website,” 2016).
EM, the more operational tasks it can perform. For example, hybrids with However, the validity of this data is unclear, as it has been released by the
larger batteries and more powerful EMs that allow plug-in charging can manufacturers and has not been independently verified.
rely more heavily on EM propulsion than other hybrids without these
features. Alternatively, some modern hybrid electric vehicles with “micro” Wrightspeed hybrid electric powertrains are designed for use in medium to
hybridisation may only use the EM to enable stop-start technology or to heavy weight vehicles that perform frequent stop-starts and often operate
support the powering of on-board auxiliary devices and therefore provide at slow speeds. The technology has been applied to delivery trucks, garbage
no propulsion assistance (Cobb, 2014). trucks, and buses; vehicles that often have poor fuel efficiency due to their
slow speeds and stop-start operating conditions, while still being required
2.1.3 Mechanisms for Improved Efficiency to travel very large distances per day (Abuelsamid, 2016b). Wrightspeed
Hybrid electric vehicles improve energy efficiency in several ways. The claims that full battery electric technology is not a solution for this vehicle
presence of an on board battery and electric motor gives access to both type due their high daily energy demand and inherent need to maximise
regenerative braking and start stop technologies5. Using an ICE to drive vehicle carrying capacity; the large weight and volume of the required
a generator, instead of directly driving the vehicle, means that the ICE battery capacity for full electric propulsion would significantly reduce the
can be smaller and can be run at the optimal speed and load more often performance and functionality of the vehicle (Abuelsamid, 2016b).
to improve efficiency. An on-board battery also gives the potential to
Their technology has been trialled by international companies such as
incorporate plug-in charging technology to further increase the relative
FedEx and Mack (Abuelsamid, 2016b). NZ Bus signed a US$30m deal with
contribution of the electric motor (Cobb, 2014).
Wrightspeed in early 2016. NZ Bus will be supplied with Wrightspeed hybrid
systems to both refit their suspended electric trolley buses and convert
existing conventional diesel bus systems (Abuelsamid, 2016a; Green, 2016).
It will be interesting to observe the performance of this technology in a
demanding New Zealand public transport context.
5
Stop-start technology refers to the ICE being automatically shut down when a vehicle is idle for a period of time.
7 Electric Bus Technology - Final Report - June 20172. OVERVIEW OF TECHNOLOGIES
2.2 Fuel Cell Electric Buses
Fuel cells use a chemical reaction between stored hydrogen and ambient DISADVANTAGES
oxygen to create electricity. In the case of a hydrogen fuel cell, the general • Infrastructure, extensive hydrogen storage and refueling infrastructure
reaction is 2H2 + O2 à 2H2O. There are a number of different types of
will be required to successfully incorporate FCEBs.
fuel cells, but the following section will only discuss polymer electrolyte
• High cost, FCEBs are currently around seven-times more expensive than
membrane fuel cells (PEMFCs), also referred to in some literature as proton
exchange membrane fuel cells, as they are considered most appropriate for both DBs and electric buses (Mahmoud et al., 2016), and the cost of
use in vehicle propulsion (Brandon, 2004; Lowry & Larminie, 2012). constructing a hydrogen refuelling station is approximately US$5 million
(Eudy & Post, 2014b).
Potential advantages and disadvantages of using polymer electrolyte
• System management, fuel cell components are very sensitive to heat
membrane fuel cells (PEMFCs) for vehicle propulsion are outlined below.
changes, water concentration levels, and impurities within the hydrogen
ADVANTAGES fuel. Poor management of these conditions can cause permanent fuel cell
damage (Lowry & Larminie, 2012).
• Low tailpipe emissions, at low operating temperatures6, almost
no criteria pollutants are created during vehicle operation
• Hydrogen density, hydrogen is less energy-dense than diesel, so more
storage space is required to match the range of diesel buses.
(Lowry & Larminie, 2012).
• Increased availability, theoretically, less maintenance should be required
due to the absence of internal moving parts (Brandon, 2004; Mekhilef,
Saidur, & Safari, 2012).
• Customisable power output, fuel cells can be coupled to easily customise
the power output (Brandon, 2004).
• Long range, hydrogen fuel cell vehicles do not suffer from the same range
issues that currently restrict battery electric vehicles (Lowry & Larminie,
2012).
6
If hydrogen is used as a fuel source at higher operating temperatures, the chemical reaction also produces criteria pollutants.
8 Electric Bus Technology - Final Report - June 20172. OVERVIEW OF TECHNOLOGIES
2.2.1 Fuel Cell Configurations 2.2.2 Competing Technology: Hydrogen as a Fuel
Early FCEBs were configured with the fuel cell directly connected to the Source for Internal Combustion Engines
electric motor, shown in Figure 7. More recent FCEBs use a hybrid electric Hydrogen fuel can be combusted in an ICE, instead of petrol or diesel, to
powertrain (Ammermann, Ruf, Lange, Fundulea, & Martin, 2015), which is directly create kinetic energy. Due to the higher operating temperature of
similar to the series hybrid configuration discussed in Section 4.1.1, replacing ICE’s, the emissions of this process are slightly different to hydrogen fuel cells;
the ICE with a fuel cell. Figure 8 shows the hybridised fuel cell configuration. the tailpipe pollutants will include small amounts of NOx (Lowry & Larminie,
Advantages of the fuel cell hybridisation include a reduction in the 2012). Direct combustion of hydrogen is relatively clean, and the ICEs are
required size of the fuel cell stack (which reduces the cost), and access to much cheaper and lighter than fuel cells. Hydrogen combustion in ICEs can
regenerative braking technology to increase fuel efficiency (Ammermann et also use impure hydrogen fuel (Pearson, Leary, Subic, & Wellnitz, 2011).
al., 2015; T. Hua et al., 2014).
Despite the aforementioned advantages of hydrogen combustion engines,
fuel cells generally continue to be preferred due to their potential to achieve
much higher energy efficiencies (Lowry & Larminie, 2012). Fuel cells are able
AUX to achieve higher efficiencies because of their lower operating temperatures
(Pearson et al., 2011). It is also expected that over time, the durability,
weight, and cost of fuel cells will continue to improve.
FUEL CELL EM TX FD
While the hydrogen combustion engine concept is a feasible one, it is
unlikely to become a commercial reality for two main reasons. Firstly, the
Fuel Cell
low maximum efficiency of the ICE would require a very large on-board
hydrogen storage space to achieve the normal daily distances travelled by
Figure 7: Early fuel cell electric bus configuration current public transport buses. Secondly, hydrogen fuel is very expensive;
without the increased fuel efficiency offered by fuel cells (or a significant
reduction in the cost of hydrogen,) hydrogen ICEs would have very high
FC GEN
operating costs.
AUX EM TX FD
2.3 Battery Electric Buses
Full battery electric buses (BEBs) store all required energy in an on-board
battery. Energy is transferred to the vehicle via electric charging systems,
BATTERY
Fuel Cell
while regenerative braking is used to recover kinetic energy during
operation.
Figure 8: Hybridised fuel cell electric bus configuration
9 Electric Bus Technology - Final Report - June 20172. OVERVIEW OF TECHNOLOGIES
Outlined below are some advantages and disadvantages specific to BEBs, 2.3.1 Battery Configurations
beyond the general advantages and disadvantages of all types of electric
The energy for a BEB is stored in a battery (or ultracapacitor) to be supplied
buses, which were mentioned at the start of Section 4.
to the electric motor, as shown in Figure 9. The potential to replace the final
drive and transmission with separate EMs at either wheel was discussed
ADVANTAGES in Section 4.1.1, and is applicable for BEBs as well. There are three types of
• No tailpipe emissions, and very low overall emissions if renewable energy batteries commonly used in BEBs: lithium iron phosphate, lithium-titanate,
sources are used. and nickel cobalt manganese lithium-ion (commonly shortened to NCM
Li-ion). Volvo and BYD use lithium iron phosphate batteries in their BEBs;
• Efficient, very high vehicle energy efficiency of the electric motor.
Proterra uses lithium-titanate; VDL Bus and Coach use NCM Li-ion
• Reduced operating cost, based on current electricity prices, the cost of (Thorpe, 2016).
operating BEBs would be much cheaper than DBs. This is true even if the
current fuel tax was added to the electricity price.
DISADVANTAGES AUX
• Low distance range, current BEBs are limited to a reasonably
BATTERY EM TX FD
small distance range. The effects of this can be reduced by rapid-
charging on-route.
• Heavy, current batteries are heavy, adding to the weight of the bus, Electric
potentially limiting what roads they would be able to operate on.
• Capacity, the increased weight means the vehicle capacity is reduced to Figure 9: BEB configuration
stay below maximum axle weight limits.
• Infrastructure, BEBs require charging infrastructure (either at depots, bus
stops, or both).
10 Electric Bus Technology - Final Report - June 20172. OVERVIEW OF TECHNOLOGIES
2.3.2 Battery Electric Bus Categories 2.4 Ultracapacitor Electric Buses
BEBs can be divided into two categories based on their range and charging This section will give a brief description of ultracapacitor (also known as
routine. The first category is the opportunity BEB, which has a shorter super-capacitor) use in electric buses. Relative to other advanced electric
range and can be rapidly charged throughout the day, at convenient bus technology such as BEBs and FCEBs, there is little published material
‘opportunities’. The second category is the overnight BEB, which has a about ultracapacitor buses. For this reason, the technology will not be
longer range to complete a day’s service, and is slowly charged overnight. discussed elsewhere in this report.
Opportunity BEBs have a shorter range than overnight BEBs, usually Ultracapacitors can be used in hybrid systems as the energy storage system
30-70 km, and can often recharge 80-100% in five to ten minutes alongside an ICE or a fuel cell, and they are often desirable for this purpose
(Mahmoud et al., 2016). as they charge quickly (Bubna, Advani, & Prasad, 2012). However, they can
also be used as the sole source of on-board energy, and can be recharged
Overnight BEBs are charged slowly overnight, and might also make use at charging stations, similar to opportunity BEBs (Hamilton, 2009).
of some opportunity charging throughout the day. Proterra7, a U.S. BEB
manufacturer, claims that its longest range BEB, the E2 max, has a nominal Ultracapacitors have similar features to batteries in general, however
range of 560km and a charge time of five hours. This Proterra BEB range is the different technology requires it to be considered separately. The
not independently verified and BEB ranges can vary greatly under different advantages and disadvantages of ultracapacitors are noted here, alongside
operating conditions; air conditioning load, average passenger volume, the general advantages and disadvantages of all electric buses that were
stopping frequency, driver behaviour, and route gradient are just a few mentioned at the start of Section 4.
examples of factors that can greatly affect a bus’s energy consumption and
potentially significantly reduce its overall range. ADVANTAGES
In practice, the range of a BEB is governed by the design choices of the • No tailpipe emissions, and low overall emissions if original energy sources
manufacturer. A BEB can be designed to have any reasonable range by are renewable.
installing different batteries. The two main consequences of increased • Fast charging, ultracapacitors can be rapidly charged without decreasing
range (by increasing battery size) are increased vehicle purchase price and
their overall capacity (Benz, 2015).
increased vehicle mass. The latter is of particular concern as it reduces
• Long life time, ultracapacitors can be discharged and recharged many
both vehicle passenger capacity and vehicle energy efficiency. This will be
discussed in more detail in Section 5. times without degrading their capacity (Chandramowli, 2014).
7
Founded in 2004 in Colorado, USA, Proterra produce both short and long range BEBs. Their current models are either 35-foot (10.7m) or 40-foot (12.2m) buses.
Proterra uses carbon-fibre-reinforced composite materials to produce the bus body as opposed to steel framing, which is used by other bus manufacturers. This reduces vehicle
weight and increases the lifetime of the vehicle body (“Proterra official website,” 2016).
11 Electric Bus Technology - Final Report - June 20172. OVERVIEW OF TECHNOLOGIES DISADVANTAGES • Short range, ultracapacitors discharge quickly, so have a small range, however this feature of them also enables them to be recharged very quickly (Benz, 2015). • Infrastructure, because ultracapacitors have a short range, they need to be recharged often, so significant infrastructure is required before they can be deployed on any route. • Not flexible, as ultracapacitors need to be recharged often, the locations of the charging infrastructure limit what routes the buses can follow. Operational buses that use ultracapacitors as their sole energy-source recharge regularly throughout a route. The common charging mechanism involves a boom (pantograph) on the roof of the bus which connects with fixed catenary wires positioned above bus stops (Chandramowli, 2014). Despite the ultracapacitors not being capable of storing a large amount of energy, their charge times are relatively very fast (Hamilton, 2009). A charge time of 30-90 seconds can give a bus enough charge to travel a further 5-10 km (Chandramowli, 2014), although some bus manufacturers claim even faster charge times than this (Howe, 2015). 12 Electric Bus Technology - Final Report - June 2017
3.      PERFORMANCE OF ALTERNATIVE BUS TECHNOLOGIES

3.1     Economic Performance                                                       3.1.1 Hybrid Electric Bus Costs
                                                                                   HEBs are the cheapest of all types of electric buses, and are around 50%
This section will discuss the economic performance of different types of
                                                                                   more expensive than DBs (Mahmoud et al., 2016). They usually have
electric buses, using DBs as a comparison. Economic performance will
                                                                                   increased fuel efficiency and therefore reduced running costs (Mahmoud
be assessed across five categories: purchase price, maintenance costs,
                                                                                   et al., 2016). The amount of increased fuel efficiency varies across different
operating costs, infrastructure costs, and total cost of ownership (TCO).
                                                                                   publications and is likely the result of HEB experimental data being
Costs considered in bus TCO include the aforementioned costs, as-well-as
                                                                                   collected from different operational contexts; different bus service routes,
other costs such as insurance, emission penalties, vehicle taxation, and end-
                                                                                   stages of technology development, degrees of hybridisation, different
of-life (vehicle resale value) (Mahmoud et al., 2016).
                                                                                   comparison DBs, or different hybrid configurations can all cause variations
Much literature on electric buses suggests that over the vehicle lifetime,         in fuel efficiency. Mahmoud and colleagues (2016) wrote that HEBs achieve
electric buses are more expensive to operate than diesel buses (Ally & Pryor,      an average well-to-wheel (WTW) energy loss of 22-26%. However, there
2016; Mahmoud et al., 2016; Williamson, 2012). However, these findings are         have also been instances where comparative trials found HEBs had higher
sensitive to factors such as advances in electric bus technology, changes          energy consumption; a 2011-2012 Sydney trial found the tested HEB to have
to fuel prices, perceived value of energy security, and emission taxes. It         a 4% increase in fuel consumption when compared with an advanced diesel
seems widely accepted that given current trends, electric buses will hold          technology control vehicle (Williamson, 2012).
a cost advantage over DBs in the future (Ally & Pryor, 2016). Increased
                                                                                   Mahmoud and colleagues (2016) also state that the maintenance costs
investment in electric buses globally, such as the US$30m NZ Bus deal
                                                                                   of HEBs are slightly lower than DBs, but more expensive than BEBs and
with Wrightspeed hybrid technology, and documented examples of well-
                                                                                   FCEBs. However, Ally and Pryor (2016) claim that HEBs will have higher
designed electric bus demonstration projects, such as the Milton Keynes
                                                                                   maintenance costs (almost double that of DBs) due to the high cost of
electric bus project (see Section B.1), suggests that electric bus solutions are
                                                                                   replacement parts and the addition of battery servicing costs.
becoming commercially viable options for public transport companies.
                                                                                   HEBs have the same infrastructure costs as DBs because there are no
Much of the costing data discussed in this section comes from a journal
                                                                                   additional infrastructure requirements, assuming plug-in technology is not
article authored by Mahmoud and colleagues (2016). The article presents
                                                                                   used (Mahmoud et al., 2016). As shown in Table 3, the average TCO of HEBs
average costing data on electric buses, collected from a range of published
                                                                                   is slightly higher than DBs, at 2.85 US$/km and 2.98 US$/km for parallel
sources. While this costing data helps to give an indication of the relative
                                                                                   and series HEBs respectively (Mahmoud et al., 2016).
economic performance of different electric buses, specific information
about the original sources and how the costing data was created is hidden
from readers of this report. This includes any assumptions, data generation
methodologies, author bias, and operational contexts. For this reason, care
should be taken when interpreting the generalised economic findings below.

13 Electric Bus Technology - Final Report - June 2017
3. PERFORMANCE OF ALTERNATIVE BUS TECHNOLOGIES
Powertrain Configuration Unit price $ Maintenance cost $/km Running cost $/km Infrastructure cost $/km TCO $/km
ICE Diesel 280,000 0.38 0.8 0.04 2.61
HEB Series 410,000 0.24 0.68 0.04 2.98
HEB Parallel 445,000 0.26 0.76 0.04 2.85
Table 3: Average costs of electric buses in published articles8
Ally and Pryor (2016) give a more in-depth analysis of HEB TCO in an Firstly, the running costs will be highly dependent on context, particularly
Australian context. Their study9 used operational data from a HEB in the relative diesel and electricity prices. For example, a comprehensive U.S.
Perth. The study found the TCO of HEBs to be almost AU$90,000 higher assessment of Foothill Transit’s BEBs found the per kilometre energy costs
than DBs; an increase of 11%. It was stated that the TCO of DBs and HEBs of the BEBs to be 70% higher than the CNG fuelled control buses, despite
converged when the fuel efficiency of HEBs increased by 43%, or when the BEBs having an operational energy efficiency four times greater than
diesel prices reached 3.20 AU$/L10, a value 2.5 times higher than current the CNG buses (Eudy, Prohaska, Kelly, & Post, 2016). Secondly, the lower
retail diesel prices in Australia11 (Ally & Pryor, 2016). These results were maintenance costs of BEB demonstration projects may be distorted by
echoed in another Australian study12 which took operational data from significant amounts of servicing and replacement parts that is unaccounted
a HEB used in the Sydney public transport network. The Sydney study for, as they are covered under warranty (Eudy, Prohaska, et al., 2016).
(Williamson, 2012) found the TCO of the HEB to be $114,000 greater than
that of the control DB despite the HEB having 15% better fuel efficiency. BEBs have very large infrastructure costs due to requiring overnight and/
or opportunity charging stations. For opportunity BEBs, the number of
3.1.2 Battery Electric Bus Costs on-route charging stations depends on the vehicle’s battery capacity and
the route used (Mahmoud et al., 2016). For example, charging infrastructure
Published data suggests BEBs have nearly twice the purchase price of DBs
for the Milton Keynes BEB project (discussed in Section B.1) consisted of
with the overnight BEB being more expensive than the opportunity BEB
two road-surface inductive charging platforms, placed 25 km apart and
due to its much larger battery capacity (Mahmoud et al., 2016). Mahmoud
an overnight charging system at the depot (Miles & Potter, 2014). Over the
and colleagues (2016) suggested that BEBs have the lowest maintenance
vehicle lifetime, Mahmoud and colleagues (2016) suggest that BEBs are 1.5
and running costs as there are fewer complexities in the system than in ICEs
times (opportunity BEBs) or 2.6 times (overnight BEBs) more expensive to
for DBs. However, caution should be taken when interpreting this statement.
operate than DBs.
8
Values are documented averages, compiled by Mahmoud and colleagues (2016) from a variety of sources. $ = USD.
9
The Perth CAT study assumed an operational lifetime of fifteen years and a yearly bus travelling distance of 30,000 km.
10
Ally and Pryor’s (2016) study found HEBs to have significantly higher maintenance costs. If HEB maintenance costs were set to be equal to DBs, the TCOs for HEBs and DBs converged at
a diesel price of 1.95 AU$/L.
11
The average weekly retail price for diesel fuel in Australia, during the week ending January 8th, 2017, was 1.28 AU$/L.
12
The Sydney study assumed an operational lifetime of twenty-five years and a yearly bus travelling distance of 70,000 km.
14 Electric Bus Technology - Final Report - June 20173. PERFORMANCE OF ALTERNATIVE BUS TECHNOLOGIES
3.1.3 Fuel Cell Electric Bus Costs prices are achieved, the next generation of FCEBs in the U.S. and Europe
would have purchase prices of US$1,000,000 (T. Hua et al., 2014) and
FCEBs have high costs across all economic performance categories and
US$700,000 (Pocard & Reid, 2016) respectively, which would have
over the vehicle lifetime are one of the most expensive electric buses to
significant impacts on the TCO of FCEBs.
operate (Mahmoud et al., 2016). Average published maintenance costs were
higher for FCEBs than all other vehicle types. Similarly, infrastructure costs Findings from the Perth study found the TCO of a FCEB to be AU$1.3m
were higher than all vehicle types except opportunity BEBs (Mahmoud et or 2.6 times greater than that of a diesel bus (Ally & Pryor, 2016). If the
al., 2016). These high costs are likely due to the need for hydrogen servicing 2020 performance and cost targets set by the U.S. Department of Energy
and refuelling facilities13, the high cost of fuel cell parts, and the early stage for hydrogen fuel cell technology are achieved, this difference would be
of development of fuel cell technology. While Mahmoud and colleagues significantly reduced. Under the Department of Energy targets, a FCEB
(2016) suggested that the running costs of FCEBs were slightly lower than would have a TCO AU$420,000 higher (only 1.5 times greater) than the
that of DBs and HEBs, the findings from two U.S. FCEB case studies did current DB TCO.
not agree with this result; one of these case studies found the per kilometre
fuel costs for FCEBs to be more than three-times greater than that of DBs, Despite the current high cost of FCEBs, there is an increasing global
which reflected the much greater cost of hydrogen over conventional fossil investment in the development and deployment of FCEBs (T. Hua et al.,
fuels (Eudy, Post, & Matthew, 2016). 2014). As of 2014, 100 FCEBs were in operation in demonstration projects
around the world (T. Hua et al., 2014). The persistent interest in fuel cell
FCEBs have very high initial purchase prices. North American case studies systems, undeterred by its relatively high cost, is likely because of inherent
from the last five years quoted purchase prices of US$2,400,000 and advantages of fuel cells over other electric bus systems; FCEBs have long
US$2,100,000 (Eudy & Chandler, 2013; Eudy & Post, 2014b). Ally and range potential, reasonably short refuelling times, near zero local emissions
Pryor (2016) gave a more conservative FCEB unit price of AUS$1,315,789 and do not require on-route infrastructure (Ammermann et al., 2015).
(approximately US$980,000 at current exchange rates). In Europe, FCEBs Furthermore, clean hydrogen production via water electrolysis can integrate
produced in 2010 had purchase prices ranging from US$1,433,000 to well with renewable electricity generation.
US$2,150,00014 (T. Hua et al., 2014). While historical purchase prices have
been very high, a 75% decrease in FCEB purchase price was observed
between 1990 and 2015 (Ammermann et al., 2015). If current target
13
Around US$5 million for just one hydrogen storage and refuelling facility (Eudy & Post, 2014b).
14
Converted from prices given in EUR using a January 1st, 2010 exchange rate of 1.433 USD/EUR.
15 Electric Bus Technology - Final Report - June 20173. PERFORMANCE OF ALTERNATIVE BUS TECHNOLOGIES
3.1.4 Economic Performance Sensitivity 3.2 Operational Assessment
A number of studies (Mahmoud et al., 2016; Nurhadi, Borén, & Ny, 2014)
have noted the high sensitivity of electric bus TCO to changes in the 3.2.1 Hybrid Electric Buses
predicted values used for the different parameters. Nurhadi and colleagues HEBs can achieve a similar range to DBs if they have a similar sized fuel
(2014) found that distance travelled per year, retirement age, purchase tank. They also require no additional infrastructure, unless plug-in hybrid
price, and maintenance costs were the four most influential factors (listed systems are used, in which case charging infrastructure gives valuable
from most to least influential) affecting electric bus TCO. To demonstrate benefits. The similar range capacity and lack of required additional
the different degrees in sensitivity, consider the following changes to infrastructure make the transition from DBs to HEBs an easy transition
the TCO for an overnight BEB: a decrease in BEB yearly mileage of 10- within existing networks. One operational disadvantage of using HEBs
30% leads to an increase in BEB TCO of 13-30%; whereas an increase in instead of conventional DBs is the increased vehicle kerb weight which may
electricity costs of 10-30% results in an increase in BEB TCO of only 2-4% decrease bus passenger capacity (Varga et al., 2016).
(Nurhadi et al., 2014). Other TCO sensitivities are presented in Table 4.
3.2.2 Battery Electric Buses
One of the main barriers to BEB usage in existing DB public transport
Factor % Change in factor cost TCO of overnight BEB
networks, is the trade-off between vehicle range and weight (Mahmoud et
Bus purchase cost + (10 to 30%) + (5 to 14%)
al., 2016; Miles & Potter, 2014). BEB range is mainly determined by on-board
Yearly distance - (10 to 30%) + (13 to 30%) battery capacity. Increasing the battery capacity results in an increased
travelled range, however this also increases the vehicle cost, increases kerb weight,
Years in service + (10 to 30%) - (8 to 34%) and decreases passenger capacity (due to the maximum axle weight limits
on roads). On the other hand, BEBs with a reduced battery capacity will
Electricity cost + (10 to 30%) + (2 to 4%)
generally require more charging infrastructure, which causes additional
Maintenance costs - (10 to 30%) - (2 to 5%) costs and barriers.
Table 4: Overnight BEB TCO sensitivity to parameter adjustments
(Nurhadi, Borén, & Ny, 2014)
If a BEB has sufficient range for their daily service, they only require
overnight charging stations, whereas an opportunity BEB needs charging
stations throughout its route as well as possibly requiring overnight
charging capacity at the depot. Opportunity charging can restrict
operational capabilities (Benz, 2015); opportunity BEBs are restricted to
routes where charging systems are installed, and in service charging times
must be factored into bus schedules and may lead to additional service
disruptions.
16 Electric Bus Technology - Final Report - June 20173. PERFORMANCE OF ALTERNATIVE BUS TECHNOLOGIES
There are several different charging systems available for BEBs including Overloading of the local electricity grid is another infrastructure challenge
overhead systems, direct plug-in systems, and inductive energy transfer that arises through BEB implementation, especially if large numbers of
(Mahmoud et al., 2016). Plug-in systems are relatively low cost and opportunity BEBs are used in one area (Mahmoud et al., 2016). Energy
are common for overnight charging, but are cumbersome for regular delivery speeds will also require ongoing development to see BEBs become
opportunity charging scenarios. Inductive energy transfer is more effective more appealing. While charger power ratings continue to increase with
for opportunity charging; it is easy to use, requires low driver responsibility, time, the charge times of most BEBs are still much slower than the diesel
and is aesthetically unobtrusive when installed at bus stops. However, there refuelling times of conventional buses.
are energy losses incurred through induction that reduce the overall well-
to-wheel energy efficiency of the vehicle (Benz, 2015). Burst charging at 3.2.3 Fuel Cell Electric Buses
bus stops, with longer charging at bus depots and layover points has been To achieve large ranges, FCEBs require a very large fuel storage space to
employed using overhead wires and pantographs by ABB and in a joint account for the much smaller energy density of hydrogen, despite it having
venture between Siemens and Rampini (Benz, 2015), and is a common around three times the specific energy (energy per unit mass) of diesel
system for ultracapacitor buses. The disadvantage of this type of system is (Elert, 2017). The FCEBs operating in Whistler, Canada, carried 56kg of
that it requires a lot of infrastructure (Benz, 2015). Another type of overhead hydrogen and had an average range of 360km15 (Eudy & Post, 2014b). FCEBs
system lowers a charger head to meet a contact point on the bus’s roof. This from a Portland trial (the Zero Emission Bay project) had greater average
type of system is used by Proterra’s opportunity BEBs (Ruoff, 2016). fuel efficiency16 than the Whistler buses, travelling approximately 350km17 on
just 40kg of hydrogen (Eudy, Post, & Matthew, 2016). 40kg of hydrogen at
Battery swapping technology is also mentioned in discourse whereby
5000 psi requires a storage capacity of approximately 1400 litres18 (1.4m3),
depleted on-board batteries would be removed from the vehicle and
not including the tank wall thickness, valves, or any other components19. On-
replaced by fully-charged batteries during daily operation (Mahmoud et
board storage of hydrogen in liquid form would reduce the hydrogen volume
al., 2016). If this system were optimised for speed, it could allow an in-
by more than half to 565 litres (U.S. Department of Energy, 2015), but liquid
service bus to operate over large daily distances, without the need to either
hydrogen still falls well short of the energy density of diesel.
regularly charge the batteries during service, or carry sufficient battery
capacity for an entire day’s service. However, BEB batteries are large, very Based on the Portland trial, a FCEB requires at least 565 litres of tank space
heavy, and often stored in several different places throughout the bus. to be capable of travelling 350km, while the control diesel buses in the
Therefore, comprehensive infrastructure would be required to quickly same study required a tank size of just under 200 litres to achieve the same
replace the batteries in an in-service bus, and it is generally agreed that this range20.
solution may be infeasible.
15
Range calculated using the Whistler FCEB fleet’s average energy efficiency of 15.48 kg / 100 km and total on-board hydrogen capacity of 56 kg (Eudy & Post, 2014b).
16
Reduced average fuel efficiency of the Whistler fleet (compared to the Portland fleet) is possibly due to more demanding operating conditions. Suggested factors include, colder winter
temperatures, greater cumulative elevation gain, higher average ridership.
17
Range calculated using the Portland FCEB fleet’s average energy efficiency of 11.36 kg / 100 km and total on-board hydrogen capacity of 40kg.
18
Calculated using volumetric data on hydrogen gas at room temperature from the U.S. Department of Energy website (U.S. Department of Energy, 2015) and the ideal gas law (PV = nRT).
19
Hau and colleagues (2010) state that 24% of the volume of a type III, 6kg hydrogen storage tank, is made up by tanks materials other than the gas itself.
20
The control Gillig diesel buses had an average fuel economy of 55.3 L/100km. The FCEBs have an average range of 352km.
17 Electric Bus Technology - Final Report - June 20173. PERFORMANCE OF ALTERNATIVE BUS TECHNOLOGIES
Some early generation FCEBs stored on-board hydrogen in liquid state21, Hydrogen distribution, storage, and refuelling infrastructure is an additional
but due to the extreme low temperatures required to store liquid hydrogen, operational requirement for FCEBs. Some FCEB studies also discuss local
recent models have preferred gaseous hydrogen (Rose, Gangi, & Curtin, or on-site hydrogen production from either water electrolysis (Ally & Pryor,
2013). On-board storage pressures for gaseous hydrogen range from 200 to 2016; Eudy, Post, et al., 2016) or through natural gas using steam reforming
450 bar (2900 to 6527psi respectively) (Rose et al., 2013). Hydrogen storage (Eudy & Chandler, 2013). The fuelling stations in the U.S. and Canadian FCEB
at greater pressures or in liquid form would reduce the amount of on-board studies we have explored have purchased liquid hydrogen from external
storage space required for fuel, however the expected improvements to producers (Eudy & Post, 2014b; Eudy, Post, et al., 2016). The supplied fuel
fuel cell efficiency could avoid such changes being necessary. The FCEBs remained in liquid form on-site, with conversion to intermediate, low capacity
in the Portland trial had an average fuel consumption of 11.36 kg/ 100 km, gaseous storage taking place prior to delivery to the buses.
while the next generation of FCEBs are expected to be capable of achieving
an average fuel consumption of just 8 kg/100 km (T. Hua et al., 2014). If
the Portland FCEBs were capable of this fuel consumption, their level of
hydrogen storage would give them a range of about 500 km.
Large vehicle weights are another operational disadvantage for FCEBs.
As discussed for both HEBs and BEBs, increased bus kerb weight reduces
passenger carrying capacity due to the maximum axle weight limits on
roads. The kerb weights of FCEBs can exceed that of DBs by 2.5 tonnes or
more (T. Hua et al., 2014). Assuming the kerb weight of a 12 metre DB to be
approximately 12 tonnes22, the Portland and Whistler FCEBs were 2.2 tonnes
and 3.5 tonnes heavier than this (Eudy & Post, 2014b; Eudy, Post, et al., 2016).
Hua and colleagues (2014) suggest that FCEB kerb weights will eventually
match that of conventional buses as fuel economy increases (reducing the
weight of the fuel and its storage tanks) and design improvements reduce
the weight of the vehicle powertrain.
Figure 10: Image showing rooftop gaseous hydrogen storage (Pocard & Reid, 2016)
21
Trials using liquid on-board hydrogen storage included: Lisbon, Portugal, 2002-2003; Copenhagen, Denmark, 2002-2003; Berlin, Germany, 2002-2003; Berlin, Germany, 2006-present
(Rose, Gangi, & Curtin, 2013).
22
Public transport DB kerb weights for a set of bus models ranged from 11.45 to 12.82 tonnes (Varga et al., 2016).
18 Electric Bus Technology - Final Report - June 2017You can also read