Effects of neighboring transitions on the mechanisms of electromagnetically induced absorption and transparency in an open degenerate multilevel ...
←
→
Page content transcription
If your browser does not render page correctly, please read the page content below
www.nature.com/scientificreports
OPEN Effects of neighboring
transitions on the mechanisms
of electromagnetically induced
absorption and transparency
in an open degenerate multilevel
system
Zeeshan Ali Safdar Jadoon1, Heung‑Ryoul Noh2* & Jin‑Tae Kim1*
In this study, optical Bloch equations with and without neighboring hyperfine states near the
degenerate two-level system (DTLS) in the challenging case of 85Rb D2 transition, which involves the
Doppler broadening effect, are solved. The calculated spectra agree well with the experimental results
obtained based on the coupling-probe scheme with orthogonal linear polarizations of the coupling
and probe fields. The mechanisms of electromagnetically induced absorption (electromagnetically
induced transparency) for the open Fg = 3 → Fe = 2 and 3 transitions (open Fg = 2 → Fe = 2 and
3 transitions) are determined to be the effect of the strong closed Fg = 3 → Fe = 4 transition line
(strong closed Fg = 2 → Fe = 1 transition line); this finding is based on a comparison between the
calculated absorption profiles of the DTLS without neighboring states and those of all levels with
neighboring states, depending on the coupling and probe power ratios. Furthermore, based on the
aforementioned comparison, the crucial factors that enhance or reduce the coherence effects and
lead to the transformation between electromagnetically induced absorption and electromagnetically
induced transparency, are (1) the power ratios between the coupling and probe beams, (2) the
openness of the excited state, and (3) effects of the neighboring states due to Doppler broadening in a
real atomic system.
Since the initial reports on electromagnetically induced absorption (EIA)1 and electromagnetically induced
transparency (EIT)2,3, numerous studies4–19 have been conducted on the transition between EIT and EIA and the
mechanisms of these transitions, which result from quantum coherence and interference between coupled atomic
states in coupling-probe and Hanle-type experiments. However, the mechanism of transition between EIAs and
EITs in terms of powers and the polarization configurations of the coupling and probe beams, the openness of
the transitions, and neighboring effects with Doppler broadening remain u nclear4–19. The mechanisms of EIA
transition from EIT depending on the coupling and probe powers in the case of the Fe = Fg − 1 open system of
the 85Rb D2 line have not been sufficiently elucidated, and such EIAs at weak coupling and probe powers have
not been observed to date.
Lezama20 established three necessary EIA conditions for a degenerate two-level system (DTLS) based on
initial investigations of EIA r esonance1 using coupling and probe lasers: (1) the ground state must be degenerate;
(2) Fe = Fg + 1; (3) the Fg → Fe transition must be closed, without considering the contributions to absorption
or transmission coherence strength from neighboring states embedded in the Doppler broadening profiles, the
power ratios between the coupling and probe beams, the polarization configurations, and the openness of the
excited state.
In-depth studies have been conducted on EIAs in a DTLS that partially violate the three aforemen-
tioned conditions4–6,8–17,19; similarly, studies have also focussed on EITs in a DTLS that partially satisfy these
conditions7,9,10,18 have been performed. Thus, the aforementioned conditions for EIAs are satisfied in specific
1
Department of Photonic Engineering, Chosun University, Gwangju 61452, Korea. 2Department of Physics,
Chonnam National University, Gwangju 61186, Korea. *email: hrnoh@chonnam.ac.kr; kimjt@chosun.ac.kr
Scientific Reports | (2022) 12:145 | https://doi.org/10.1038/s41598-021-04038-5 1
Vol.:(0123456789)www.nature.com/scientificreports/
scenarios such that EIA and EIT can be observed depending on the coupling and probe powers, the openness
of the transition, the polarization configurations, and effects of neighboring states in the cases of Fe = Fg + 1,
Fe = Fg , and Fg − 1.
Several studies have also been conducted on the transitions between EIA and EIT depending on the general
EIA conditions of the Fe = Fg + 1 open system4–7,12,14–17. However, expected EITs in the DTLS in the weak power
regime and in the case of Fe ≤ Fg , which violate the established EIA c onditions20, transforming into genuine and
symmetric EIAs considering the Doppler broadening effect have still not been reported. The first EIA resonances
in the case of Fe ≤ Fg of the D1 and D2 transitions of 85,87Rb were observed in the Hanle configuration, without
any theoretical calculations for bright fluorescence profiles; these resonances violate condition (3) associated
with closed transitions4.
Kim et al.8 subsequently reported EIA resonances without a theoretical analysis in open systems of the D1
lines of 85Rb and 87Rb, violating conditions (2) and (3). These EIA results were obtained only from strong coupling
and probe powers exceeding the saturation power observed by several other g roups5,8,12,13,15–17; they result from
enhanced absorption governed by strong coupling and probe powers and are different from the EIAs for the same
transition configuration of Fe = Fg − 1 and Fg observed in this study using weak coupling and probe powers.
Chou et al.11 qualitatively interpreted these EIA anomalies in open systems using a crude model in a high-
power regime without a clear quantitative explanation. Zibrov et al.12 also observed EIA (EIT) resonances at
open transitions Fe = Fg + 1 of the D1 and D2 lines of an 87Rb atom upon artificially shifting the laser frequency
toward the blue (red) end from the center of the Doppler profile in both Hanle and coupling-probe experiments,
except in the cases of Fe = Fg − 1 and Fe = Fg . Zhao et al.13 observed EIA resonances in the strong coupling-
probe regime for closed and open D2 transitions Fg = 4 → Fe = 3, 4, and 5 of Cs in a coupling-probe experi-
ment with an additional laser; they referred to Goren et al.’s theoretical a nalysis14 for the EIA anomalies at open
transitions without considering the effects of neighboring states.
Auzinsh et al. observed EIA resonances in an atomic vapor cell in the case of the open Fe = Fg + 1 transi-
tion of 85,87Rb-D1 lines16. Strong coupling and probe frequencies with powers greater than 100 mW/cm 2 were
blue-shifted to escape the neighboring dark resonance in the Hanle experiment, wherein only strong coupling
and probe powers govern the absorption phenomenon. The researchers also confirmed that the resonance fluo-
rescence observed in the extremely thin cell that escaped neighboring effects owing to the Doppler broadening
could not reveal such EIA r esonances17. Auzinsh et al. also observed sign reversals of bright resonances into
dark resonances at closed transitions of the D2 lines of 85Rb and 87 Rb owing to high power and temperature in
the Hanle experiment18.
Grewal et al.19 reported on the influence of closed neighboring hyperfine levels with strong EIA features owing
to the increased ellipticities of the polarizations of coupling and probe lasers at the Fe ≤ Fg open transitions of the
D2 lines of 87Rb in the case of the Hanle configuration. However, they could not theoretically explain the absorp-
tion profiles, because of the computational complexity involved when considering the Doppler effect. Calculating
the absorption profiles for D2 transitions of 85Rb has been proven to be particularly challenging because of the
strong neighboring effects of Doppler profiles; in such cases, the total absorption of D2 transition lines should
be calculated while considering the Doppler effect and all hyperfine levels of the ground and excited states.
In this study, we deduce that clear explanations for the transition of EIT into EIA in the case of 85Rb D2
transition can be obtained based on a comparison of the calculated absorption profiles of the DTLS without
neighboring states and all energy levels of neighboring states, with respect to the power ratios between the
coupling and probe powers. To investigate the effects of power on coherence, a coupling-probe experiment with
two orthogonal linear polarizations from a single laser combined with two acousto-optic modulators (AOMs)
is more suitable than a Hanle-type experiment, because the power ratios of the coupling and probe lasers or a
wide scan of the frequency cannot be obtained in the latter.
Theoretical calculation
In this section, we present a method for calculating EIA spectra while considering the neighboring effect. As
the details of the calculation have been reported previously21–25, we describe the calculation method briefly. The
energy-level diagram of the D2 transition line of 85Rb atoms is presented in Fig. 1. The coupling and probe beams
that are linearly polarized with orthogonal directions propagate in the same directions. The Rabi frequency and
effective detuning of the coupling (probe) beam are denoted by c ( p ) and δc (δp ), respectively. The effective
detunings are expressed as δc = dc − kv and δp = dp − kv , where dc (dp) denotes the frequency detuning of the
coupling (probe) beam, k(= 2π/ ) is the wave vector, is the resonance wavelength of the lasers, and v is the
atomic velocity. Here, dc and dp are the detunings relative to the resonance transition line under consideration.
Because the energy separation between the hyperfine states in the 5S1/2 ground state is approximately six
times the Doppler linewidth of the atoms, we can calculate the EIA spectra for the Fg = 3 → Fe = 2, 3, and 4
transitions and for the Fg = 2 → Fe = 1, 2, and 3 transitions separately. In the description of the calculation
method, the Fg = 3 → Fe = 2, 3, and 4 transitions are assumed. In a frame rotating with the coupling beam’s
frequency, the density matrix describing the internal dynamics of the atoms is
i
ρ̇ = − [H0 + V , ρ] + ρ̇relax , (1)
where ρ is the density operator, and H0 (V) is the atomic (interaction) Hamiltonian.
In Eq. (1), the atomic Hamiltonian is
Scientific Reports | (2022) 12:145 | https://doi.org/10.1038/s41598-021-04038-5 2
Vol:.(1234567890)www.nature.com/scientificreports/
(a) (b)
d0 -4 -3 -2 -1 0 1 2 3 4
5P3/2 Fe=4
120.6 MHz d 0 0 d
d0
Fe=3
63.4 MHz
Fe=2
29.4 MHz
Fe=1
5S1/2 Fg=3
-3 -2 -1 0 1 2 3
3036 MHz
Fg=2
-2 -1 0 1 2
Figure 1. (a) Energy-level diagram of D2 transition lines of an 85Rb atom, wherein the red and blue lines
indicate transitions by the probe and coupling beams, respectively. (b) Transition scheme with two linearly
polarized coupling and probe beams in the case of Fg = 3 → Fe = 4 transition, where “0” (blue lines) and “δd ”
(red lines) denote the transitions excited by the coupling and probe beams, respectively. To avoid confusion, the
excitations for the Fg = 3 → Fe = 2 and 3 transitions are not shown.
4
H0 = − δc |Fe = 4, m��Fe = 4, m|
m=−4
3
− (δc + �43 )|Fe = 3, m��Fe = 3, m| (2)
m=−3
2
− (δc + �42 )|Fe = 2, m�Fe = 2, m|,
m=−2
where 4j is the frequency spacing between the hyperfine states |Fe = 4� and |Fe = j� ( j = 2 and 3). In Eq. (1),
the interaction Hamiltonian is expressed as
1
4 3
Fe ,m+q
V = �p e−iδd t aq C3,m |Fe , m + q��Fg , m|
2
q=−1 Fe =2 m=−3
4 3
(3)
Fe ,m
+ �c C3,m |Fe , m��Fg , m| + h.c.,
2
Fe =2 m=−3
where Fg = 3, and h.c. denotes the Hermitian conjugate. √ Because the direction of the electric field of the coupling
beam is selected as the quantization axis, a±1 = ∓1/ 2 and a0 = 0 in Eq. (3), where CFFge ,m ,mg is the normalized
e
transition strength between states |Fe , me � and |Fg , mg �22, and δd (≡ δp − δc = dp − dc ) is the difference between
the detunings of the probe and coupling beams. In Eq. (1), ρ̇relax represents the terms related to the relaxation
mechanism, such as the spontaneous emission and transit time d ecay23,24. Notably, we used a transit-time relaxa-
tion method while considering the finite interaction time between the atoms and laser light in the calculation24.
As reported previously21–25, the density matrix elements are decomposed into various oscillation components.
In the case of the orthogonal linear polarization configuration, the coupling and probe beams excite the transi-
tions with m = 0 and m = ±1, respectively, where m is the difference in the magnetic quantum number
between the sublevels under consideration. In Fig. 1, “0” and “δd ” indicate the transitions excited by the coupling
and probe beams, respectively. As stated earlier, δd is the effective frequency of the probe beam relative to the
frequency of the coupling beam. The method of determining the oscillation frequencies of the density matrix
elements for the orthogonal linear polarization configuration have been described in detail elsewhere25. Herein,
only an explicit expansion of the density matrix elements responsible for the probe absorption is provided:
(1) (2)
ρeFe =ρ Fe e−iδd t +ρ Fe eiδd t , (4)
m±1 ,gm em±1 ,gm em±1 ,gm
Scientific Reports | (2022) 12:145 | https://doi.org/10.1038/s41598-021-04038-5 3
Vol.:(0123456789)www.nature.com/scientificreports/
where the simplified notation for the density matrix elements is
ρeFe ,g ≡ �Fe , me |ρ|Fg = 3, mg �.
me mg
We considered all the density matrix elements between the sublevels that are connected via a maximum of
three photons. For example, the connection between the states |Fe = 4, me = m ± 4� and |Fg = 4, mg = m� is
neglected because at least five photons are needed to connect these two states. In addition, only two oscillation
frequencies (±δd ) exist in the density matrix elements in Eq. (4) that connect the states |Fe , me = m ± 1� and
|Fg , mg = m�. When we consider the five-photon interactions, the density matrix elements in Eq. (4) would
have one more oscillation frequency (−3δd ). The absorption coefficient of the probe beam is thus expressed as
3 2 Nat ∞ dv
�
2
α =− √ e−(v/vmp )
2π �p −∞ π vmp
(5)
4 � 1 3
F ,m+q (1)
� �
∗ e
× Im aq C3,m ρ Fe ,
em+q ,gm
Fe =2 q=−1 m=−3
where Nat is the atomic number density in the cell, and vmp is the most probable speed in the cell. The parameters
used in the calculation are as follows: the power of the probe beam is 15 µW and that of the coupling beam is 50
µW or 4 mW; the diameter of the laser beams is 4 mm, and the temperature of the vapor cell is 20 ◦C.
Results
We compare the experimental results with the theoretical results obtained considering the resonant and all neigh-
boring transitions resulting in EIAs and EITs. We theoretically and experimentally investigate the resonance spec-
tra for two spectrally unresolved groups of hyperfine transitions of the 85Rb D2 lines, i.e., Fg = 3 → Fe = 2, 3,
and 4 and Fg = 2 → Fe = 1, 2, and 3, as shown in Figs. 2 and 3, respectively. The probe and coupling beams
are linearly polarized in orthogonal directions. The power of the probe beam is 15 µW and that of the coupling
beam is 50 µW or 4 mW. The probe laser frequency is locked to a desired transition line, and the coupling laser
frequency is scanned around each transition line. For simplicity, we use simplified notations for the transitions;
e.g., the Fg = 3 → Fe = 4 transition is expressed as 3 → 4′ , where the unprimed (primed) integers represent
the angular momentum quantum numbers in the ground (excited) states.
Figure 2 presents a comparison of the calculated spectra considering (a) a pure DTLS with transitions reso-
nant at 3 → 2′ , 3 → 3′ , and 3 → 4′ ; (b) a transition resonant at 3 → 2′ with neighboring hyperfine transitions
of 3 → 3′ and 4′ , a transition resonant at 3 → 3′ with neighboring hyperfine transitions of 3 → 2′ and 4′ , and a
transition resonant at 3 → 4′ with neighboring hyperfine transitions of 3 → 2′ and 3′ ; (c) experimentally meas-
ured spectra with transitions resonant at 3 → 2′ , 3 → 3′ , and 3 → 4′ for two different weak (50 µW) and strong
(4 mW) coupling powers, as shown in the top and bottom traces, respectively.
First, we explain the cases of a weak coupling power, as shown in the top trace of Fig. 2. In the pure two-
level calculations on the left side of the top trace, a closed 3 → 4′ transition satisfies all three necessary EIA
conditions20 and presents a relatively strong EIA amplitude with a linewidth of 57 kHz, as expected. For open
transitions 3 → 3′ and 3 → 2′ , EIT spectra with small amplitudes and a linewidth resolution of 46 kHz and 41
kHz, respectively, are obtained. Considering all the neighboring states near the resonant transitions of 3 → 2′ ,
3 → 3′ , and 3 → 4′ , as shown in the upper trace of Fig. 2b, all the resonant transitions exhibit strong EIAs with
similar amplitudes owing to a nearby closed 3 → 4′ transition. The calculated spectra in Fig. 2b exhibit trends
strikingly similar to those observed for the measured spectra in Fig. 2c, although the observed spectra are wider
than the calculated ones. Measured ultra-narrow EIA dips at a low coupling power are resolved with linewidths
of 163 kHz, 156 kHz, and 167 kHz; in contrast, the linewidths obtained using all the neighboring transitions
calculation are 60 kHz, 60 kHz, and 58 kHz at the 3 → 4′ , 3′ , and 2′ transitions, respectively.
Second, we explain the case of a strong coupling power, as shown in the bottom trace of Fig. 2. In pure two-
level calculations on the left side of the bottom trace, a closed 3 → 4′ transition satisfies all three necessary EIA
conditions20 and indicates a relatively strong EIA amplitude with a wide linewidth of 1.06 MHz; an EIA dip
splits into two broad dips at the center of the spectra, resulting in the emergence of a narrow EIT-like peak with
a 117 kHz linewidth resolution. These EIA spectra at a strong coupling power is attributed to the contributions
of Autler-Townes effects in case of orthogonal polarizations; this results in two identical EIA spectra separated
at the right center after thermal averaging21. It should be noted that Autler-Townes splitting also exists in the
absence of Doppler b roadening26. EIT spectra with small amplitudes and wide linewidths of 194 kHz and 122
kHz for open transitions 3 → 3′ and 3 → 2′ , respectively, are obtained, as shown in the lower traces in Fig. 2a.
Including all the other adjacent transitions, such a symmetric EIA is transformed into asymmetric line profiles
owing to the strong neighboring effects, which differ in the red and blue detuning regions. Considering all the
neighboring states near the resonant transitions of 3 → 2′ , 3 → 3′ , and 3 → 4′ , as shown in the lower trace in
Fig. 2b, owing to a nearby closed 3 → 4′ transition, all the resonant transitions exhibit strong EIAs with similar
amplitudes, and remarkably similar trends in the spectra compared with the measured spectra for the closed
3 → 4′ transition. Asymmetric dips due to two separated EIAs at a strong power in the calculation (the meas-
urement) are broad—with linewidths of 870 kHz, 848 kHz, and 842 kHz (607 kHz, 606 kHz, and 603 kHz)—in
the red detuning and are narrow with linewidths of 297 kHz, 292 kHz, and 287 kHz (439 kHz, 402 kHz, and 377
kHz)—in the blue detuning at the 3 → 4′ , 3′ , and 2′ transitions, respectively. A down-shift in relative strength
of the amplitude is evident from the narrow blue detuned side at the 3 → 4′ transition to the broad red detuned
side at the 3 → 2′ transition because of the frequency shifts toward those transitions.
Scientific Reports | (2022) 12:145 | https://doi.org/10.1038/s41598-021-04038-5 4
Vol:.(1234567890)www.nature.com/scientificreports/
Figure 2. Comparison of calculated and measured spectra considering (a) pure two-level resonant transitions,
i.e., 3 → 2′, 3 → 3′ and 3 → 4′; (b) a transition resonant at 3 → 2′ with neighboring hyperfine transitions of
3 → 3′ and 4′, a transition resonant at 3 → 3′ with neighboring transitions of 3 → 2′ and 4′, and a transition
resonant at 3 → 4′ with neighboring transitions of 3 → 2′ and 3′; (c) experimentally measured spectra for
resonant transitions 3 → 2′, 3 → 3′, and 3 → 4′.
The amplitude of the total spectra across the 3 → 4′ , 3′ , and 2′ transitions decreases with Fe . The theoretical
model that considers all neighboring hyperfine states (the lower trace in Fig. 2b) and the experimental results
(the lower trace in Fig. 2c) agree well in terms of contrast and asymmetry. However, there are deviations in the
linewidths of approximately 100 kHz in both power regimes; these can be attributed to the effect of the magnetic
field, imperfect alignment of laser beams, and other effects that are not included in the calculation.
We further analyze the spectrally unresolved group of hyperfine transitions 2 → 1′ , 2′ , and 3′ of the 85Rb D2
lines instead of Fg = 3. Figure 3 presents a comparison of the calculated and measured spectra considering (a)
pure two-level resonant transitions, i.e., 2 → 1′ , 2 → 2′ and 2 → 3′ ; (b) a transition resonant at 2 → 1′ with
neighboring hyperfine transitions of 2 → 2′ and 3′ , a transition resonant at 2 → 2′ with neighboring hyperfine
transitions of 2 → 1′ and 3′ , a transition resonant at 2 → 3′ with neighboring hyperfine transitions of 2 → 1′
and 2′ ; (c) experimentally measured spectra for the resonant transitions of 2 → 1′ , 2 → 2′ and 2 → 3′ for both
weak (50 µW) and strong (4 mW) coupling powers as shown in the top and bottom traces, respectively.
The calculation for a DTLS in the low-power regime clearly reproduces ultra-narrow EIT resonances, as
expected, at the 2 → 1′ , 2 → 2′ and 2 → 3′ transitions, as shown in the upper traces in Fig. 3. The obtained EIT
spectra differ in relative amplitude with the dominant EIT amplitude at the 2 → 1′ transition, as shown in the
upper traces in Fig. 3a. The obtained linewidth resolutions of the EIT spectra are 90 kHz, 60 kHz, and 130 kHz
at the 2 → 3′ , 2′ , and 1′ hyperfine transitions, respectively.
The EIT spectra calculated considering all the neighboring states near the resonant state are similar in ampli-
tude and contrast owing to the strong EIT amplitude at the 2 → 1′ neighboring hyperfine transition, as shown in
the upper traces of Fig. 3b. The trend of the measured spectra, shown in Fig. 3c, exhibits a striking similarity in
terms of amplitude and a contrast that matches well with the calculation, as shown in Fig. 3b, when considering
Scientific Reports | (2022) 12:145 | https://doi.org/10.1038/s41598-021-04038-5 5
Vol.:(0123456789)www.nature.com/scientificreports/
Figure 3. Comparison of calculated and measured spectra considering (a) pure two-level resonant transitions,
i.e., 2 → 1′ , 2 → 2′, and 2 → 3′; (b) transition resonant at 2 → 1′ with neighboring hyperfine transitions of
2 → 2′ and 3′, a transition resonant at 2 → 2′ with neighboring transitions of 2 → 1′ and 3′, and a transition
resonant at 2 → 3′ with neighboring transitions of 2 → 1′ and 3′; (c) experimentally measured spectra for
resonant transitions 2 → 1′, 2 → 2′, and 2 → 3′.
neighboring states. The resolved linewidth in the low-coupling-power regime is approximately 114 kHz across
the 2 → 3′ , 2′ , and 1′ transitions for all the neighboring calculations, as shown in Fig. 3b; the experimentally
determined resolved linewidths (Fig. 3c) are 157 kHz, 158 kHz, and 163 kHz at the 2 → 3′ , 2′ , and 1′ transitions,
respectively.
In the strong-coupling-power regime (the lower traces of Fig. 3), the calculation considering the resonant
states shows an increase in the amplitudes and linewidths of the obtained spectra at the 2 → 1′ and 2 → 2′ hyper-
fine transitions. However, in violation of condition (3), a weak-amplitude EIA with a linewidth resolution of 285
kHz is obtained at the 2 → 3′ hyperfine transition, as highlighted in the inset image of the lower traces in Fig. 3a.
Asymmetric EIT spectra of relatively similar amplitudes and linewidth resolutions are obtained owing to the
contributions of all the neighboring hyperfine states with the resonant transition, as shown in the lower traces
in Fig. 3b; this agrees with the trend of the measured spectra, shown in the lower traces in Fig. 3c. However,
Scientific Reports | (2022) 12:145 | https://doi.org/10.1038/s41598-021-04038-5 6
Vol:.(1234567890)www.nature.com/scientificreports/
the experimentally measured spectra at higher powers do not reflect the fine contrast, unlike the calculation
with all the neighboring transitions shown in the lower traces in Fig. 3b. There is a dent on the right side of the
calculated spectrum at higher power regime, but we were not able to observe this dent in the experiment. In a
preliminary study we find that the transit-relaxation rate affects the absorption profiles substantially. We will
perform a detailed experimental and theoretical study on the effect of the transit-relaxation rate on the trans-
mission spectra. The resolved linewidths are 388 kHz, 407 kHz, and 435 kHz (441 kHz, 418 kHz, and 479 kHz)
when using all the neighboring calculations (experiment).
The sign-inverting anomalies present at open transitions 3 → 3′ and 3 → 2′ in the previous cases, as shown in
Fig. 2b,c, are not relevant to the 2 → 1′ , 2′, and 3′ group of spectrally resolved transitions, because EIT resonances
at the 2 → 3′ , 2′, and 1′ transitions are expected. Instead, anomalies in the relative strength of the amplitudes and
linewidths at 2 → 3′ , 2′ , and 1′ are evident in the calculation considering all the neighboring transitions and in
the experiment, as shown in the lower traces in Fig. 3b,c, respectively.
From both cases of Fg = 2 and 3, we observe that the power ratios between the coupling and probe beams,
the openness of the excited state, and effects of neighboring states due to Doppler broadening are crucial factors
in enhancing or reducing the coherence effects associated with transformations between EIA and EIT.
Discussion
In this study, we solved the optical Bloch equations with and without neighboring hyperfine states for all hyper-
fine transitions of the 85Rb D2 lines both in weak- and strong-coupling-power regimes while considering the
Doppler effect in an ordinary vapor cell. The calculated spectra matched well with the observed spectra. Theo-
retical models based on time-dependent density matrix equations of a degenerate (a) two-level (resonant transi-
tions) and (b) multilevel system including all neighboring hyperfine transitions were considered for calculating
coherence effects, such as EIT and EIA, using thermal averaging over the Doppler profile. EITs without neigh-
boring effects in the case of open 3 → 2′ and 3′ transitions, i.e., a DTLS that violates Lezama’s EIA conditions,
transform into genuine and symmetric EIAs owing to a strong 3 → 4′ EIA line with Doppler broadening in the
weak coupling and probe power regime. This phenomenon had remained theoretically unexplained and had not
been observed previously in the case of 85Rb D2 lines. Moreover, asymmetric and split EIAs were observed from
calculated weak EITs in a DTLS in a weak probe and strong-coupling-power regime. The previously reported
EIA resonances without clear quantitative explanations for open systems of the D1 lines of 85Rb and 87Rb, which
violate Lezama’s EIA conditions (2) and (3), are merely enhanced absorption phenomena governed by a strong
coupling power7,8,11,13,16–18. These are different from the EIAs in the same transition configuration of Fe = Fg − 1
and Fg observed and explained in this study using weak coupling-probe powers.
The EITs without neighboring effects in the DTLS in the case of 2 → 1′ (2 → 2′ ) are not transformed, owing
to the 2 → 2′ ( 2 → 1′ ) EIT line with the Doppler broadening in the weak probe and strong-coupling-power
regime. In contrast, weak EIAs at the 2 → 3′ transition in the weak probe and strong-coupling-power regime,
which violate Lezama’s EIA conditions because of openness, transform into EITs. Lezama’s EIA conditions in
the cycling case of 3 → 4′ with Fg < Fe are also confirmed in strong coupling and weak probe regimes. With
the comparisons of the calculated absorption profiles between a DTLS without neighboring states and all levels
with neighboring states, the power ratio between the probe and coupling beams, the openness of the excited
state, and effects of neighboring states due to Doppler broadening are crucial factors that enhance or reduce the
coherence effects associated with transformations between EIA and EIT.
Methods
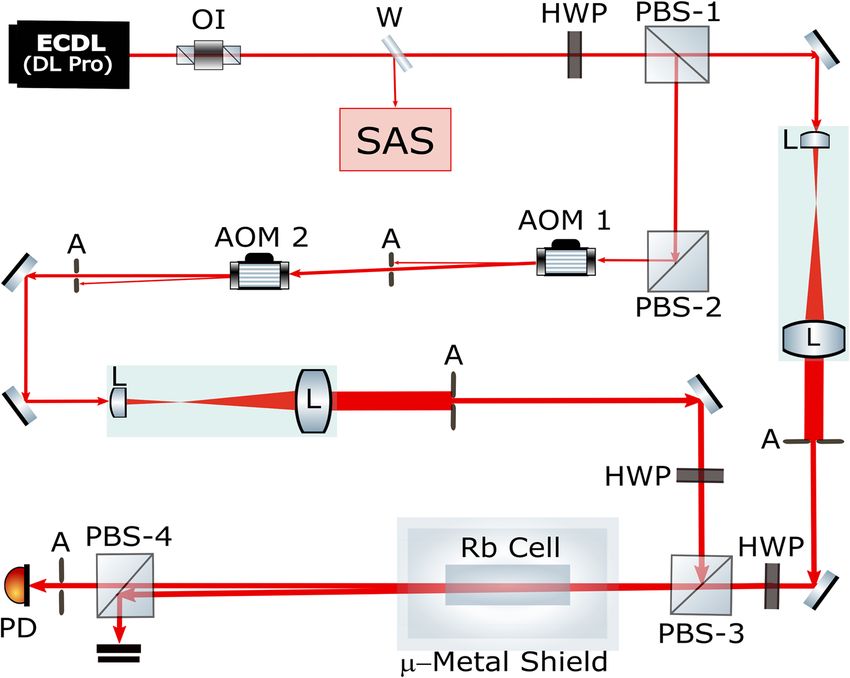
The coupling and probe beams were generated using a single laser (DLPro, Toptica Inc.) combined with two
AOMs in a single-pass configuration, as shown in Fig. 4. A combination of a half-wave plate (HWP) and polar-
izing beam splitter 1 (PBS-1) controls the ratio between the intensities and polarizations of the coupling and
probe beam. The probe and coupling beams were linearly polarized in orthogonal directions. A weak-probe-beam
power of 15 µW and a coupling beam with a scanning frequency of 5 MHz at a low coupling power of 50 µW and
strong coupling power of 4 mW were used. The coupling and probe beams were expanded by five times to obtain
a uniform intensity across a 4-mm diameter. The coupling beam with the scanning detuning ( ) from AOM-2
was combined with the weak probe at PBS-3 and co-propagated with the orthogonal linear polarizations while
maintaining an angle of intersection of approximately 0.1 mrad through the vapor cell, which was shielded with
five layers of µ-metal sheets. PBS-4 eliminated the coupling beam before the detection of the probe intensity at
a photodiode (PD). The probe laser frequency was locked to a desired 5S1/2 → 5P3/2 transition of the 85Rb D2
hyperfine line, i.e., 3 → 2′ , 3 → 3′ , 3 → 4′ , 2 → 1′ , 2 → 2′ , or 2 → 3′ using a saturation absorption spectros-
copy (SAS) setup. The coupling laser frequency was scanned around each resonance line. The experiments were
performed with 85Rb atoms in a vapor cell at a temperature of 20 ◦C.
Scientific Reports | (2022) 12:145 | https://doi.org/10.1038/s41598-021-04038-5 7
Vol.:(0123456789)www.nature.com/scientificreports/
Figure 4. Experimental setup. Component symbols: OI: optical isolator; W: window; SAS: saturation
absorption spectroscopy; HWP: half-wave plate; PBS: polarizing beam splitter; A: aperture; QWP: quarter-wave
plate; L: lens; PD: photodiode; AOM: acousto-optic modulator. Figure 4 is drawn by the first author (Zeeshan
Ali Safdar Jadoon) using free open-source scalable vector graphics editor Inkscape (Version: 1.0.2-2) available at:
https://inkscape.org/.
Received: 10 July 2021; Accepted: 8 December 2021
References
1. Akulshin, A. M., Barreiro, S. & Lezama, A. Electromagnetically induced absorption and transparency due to resonant two-field
excitation of quasidegenerate levels in rb vapor. Phys. Rev. A 57, 2996–3002. https://doi.org/10.1103/PhysRevA.57.2996 (1998).
2. Harris, S. E., Field, J. E. & Imamoğlu, A. Nonlinear optical processes using electromagnetically induced transparency. Phys. Rev.
Lett. 64, 1107–1110. https://doi.org/10.1103/PhysRevLett.64.1107 (1990).
3. Boller, K.-J., Imamoğlu, A. & Harris, S. E. Observation of electromagnetically induced transparency. Phys. Rev. Lett. 66, 2593–2596.
https://doi.org/10.1103/PhysRevLett.66.2593 (1991).
4. Dancheva, Y., Alzetta, G., Cartaleva, S., Taslakov, M. & Andreeva, C. Coherent effects on the zeeman sublevels of hyperfine states
in optical pumping of R b by monomode diode laser. Opt. Commun. 178, 103–110 (2000).
5. Alzetta, G. et al. Coherent effects on the Zeeman sublevels of hyperfine states at the D1 and D2 lines of Rb. J. Opt. B Quantum
Semiclass. Opt. 3, 181–188. https://doi.org/10.1088/1464-4266/3/3/317 (2001).
6. Failache, H., Valente, P., Ban, G., Lorent, V. & Lezama, A. Inhibition of electromagnetically induced absorption due to excited-state
decoherence in Rb vapor. Phys. Rev. A 67, 043810. https://doi.org/10.1103/PhysRevA.67.043810 (2003).
7. Papoyan, A., Auzinsh, M. & Bergmann, K. Nonlinear hanle effect in Cs vapor under strong laser excitation. Eur. Phys. J. D Atom.
Mol. Opt. Plasma Phys. 21, 63–71. https://doi.org/10.1140/epjd/e2002-00178-y (2002).
8. Kim, S. K., Moon, H. S., Kim, K. & Kim, J. B. Observation of electromagnetically induced absorption in open systems regardless
of angular momentum. Phys. Rev. A 68, 063813. https://doi.org/10.1103/PhysRevA.68.063813 (2003).
9. Brazhnikov, D. V. et al. Effect of the polarization of counterpropagating light waves on nonlinear resonances of the electromag-
netically induced transparency and absorption in the hanle configuration. JETP Lett. 91, 625–629. https://doi.org/10.1134/S0021
364010120039 (2010).
10. Saprykin, E. G., Chernenko, A. A. & Shalagin, A. M. Polarization phenomena in the transparency and adsorption effects induced
by the field of counterpropagating waves. J. Exp. Theor. Phys. 119, 196–205. https://doi.org/10.1134/S1063776114070140 (2014).
11. Chou, H.-S. & Evers, J. Dressed-atom multiphoton analysis of anomalous electromagnetically induced absorption. Phys. Rev. Lett.
104, 213602. https://doi.org/10.1103/PhysRevLett.104.213602 (2010).
12. Zibrov, A. S. & Matsko, A. B. Induced absorption resonance on the open Fg = 1 → Fe = 2 transition of the D1 line of the 87 Rb
atom. J. Exp. Theor. Phys. Lett. 82, 472–476. https://doi.org/10.1134/1.2150864 (2005).
13. Jian-Ming, Z., Yan-Ting, Z., Tao, H., Lian-Tuan, X. & Suo-Tang, J. Observation of EIA in closed and open caesium atomic system.
Chin. Phys. 14, 725–728. https://doi.org/10.1088/1009-1963/14/4/015 (2005).
14. Goren, C., Wilson-Gordon, A. D., Rosenbluh, M. & Friedmann, H. Electromagnetically induced absorption due to transfer of
coherence and to transfer of population. Phys. Rev. A 67, 033807. https://doi.org/10.1103/PhysRevA.67.033807 (2003).
15. Auzinsh, M., Ferber, R., Gahbauer, F., Jarmola, A. & Kalvans, L. F -resolved magneto-optical resonances in the D1 excitation of
cesium: Experiment and theory. Phys. Rev. A 78, 013417. https://doi.org/10.1103/PhysRevA.78.013417 (2008).
16. Auzinsh, M., Ferber, R., Gahbauer, F., Jarmola, A. & Kalvans, L. Nonlinear magneto-optical resonances at D1 excitation of 85 Rb
and 87 Rb for partially resolved hyperfine F levels. Phys. Rev. A 79, 053404. https://doi.org/10.1103/PhysRevA.79.053404 (2009).
Scientific Reports | (2022) 12:145 | https://doi.org/10.1038/s41598-021-04038-5 8
Vol:.(1234567890)www.nature.com/scientificreports/
17. Auzinsh, M. et al. Nonlinear magneto-optical resonances at D1 excitation of 85 Rb and 87 Rb in an extremely thin cell. Phys. Rev. A
81, 033408. https://doi.org/10.1103/PhysRevA.81.033408 (2010).
18. Auzinsh, M. et al. Conversion of bright magneto-optical resonances into dark resonances at fixed laser frequency for D2 excitation
of atomic rubidium. Phys. Rev. A 85, 033418. https://doi.org/10.1103/PhysRevA.85.033418 (2012).
19. Grewal, R. S. & Pattabiraman, M. Hanle electromagnetically induced absorption in open Fg → Fe Fg transitions of the 87 RbD2
line. J. Phys. B Atom. Mol. Opt. Phys. 48, 085501. https://doi.org/10.1088/0953-4075/48/8/085501 (2015).
20. Lezama, A., Barreiro, S. & Akulshin, A. M. Electromagnetically induced absorption. Phys. Rev. A 59, 4732–4735. https://doi.org/
10.1103/PhysRevA.59.4732 (1999).
21. Rehman, H.-U., Adnan, M., Noh, H.-R. & Kim, J.-T. Spectral features of electromagnetically induced absorption in 85 Rb atoms. J.
Phys. B Atom. Mol. Opt. Phys. 48, 115502. https://doi.org/10.1088/0953-4075/48/11/115502 (2015).
22. Choi, G.-W. & Noh, H.-R. Sub-doppler DAVLL spectra of the d1 line of rubidium: A theoretical and experimental study. J. Phys.
B Atom. Mol. Opt. Phys. 48, 115508. https://doi.org/10.1088/0953-4075/48/11/115008 (2015).
23. Rehman, H. U., Mohsin, M. Q., Noh, H.-R. & Kim, J.-T. Electromagnetically induced absorption due to transfer of coherence and
coherence population oscillation for the Fg = 3 → Fe = 4 transition in 85 Rb atoms. Opt. Commun. 381, 127–134 (2016).
24. Choi, G.-W. & Noh, H.-R. Line shapes in sub-doppler davll in the 87 Rb − D2 line. Opt. Commun. 367, 312–315 (2016).
25. Jadoon, Z. A. S., Noh, H.-R. & Kim, J.-T. Multiphoton nonlinear frequency mixing effects on the coherent electromagnetically
induced absorption spectra of 85 Rb atoms under a longitudinal magnetic field: Theory and experiment. Phys. Rev. A 102, 063714.
https://doi.org/10.1103/PhysRevA.102.063714 (2020).
26. Goren, C., Wilson-Gordon, A. D., Rosenbluh, M. & Friedmann, H. Atomic four-level n systems. Phys. Rev. A 69, 053818. https://
doi.org/10.1103/PhysRevA.69.053818 (2004).
Acknowledgements
This work was supported by the National Research Foundation of Korea (NRF) grant funded by the Korea
government (MSIT) (No. 2020R1A2C1005499 and No. 2021R1F1A1052487) and research fund from Chosun
University (2021).
Author contributions
Z.J., J.K., and H.N. wrote the main manuscript text and Z.J.. prepared figures 1–4. All authors reviewed the
manuscript.
Competing interests
The authors declare no competing interests.
Additional information
Correspondence and requests for materials should be addressed to H.-R.N. or J.-T.K.
Reprints and permissions information is available at www.nature.com/reprints.
Publisher’s note Springer Nature remains neutral with regard to jurisdictional claims in published maps and
institutional affiliations.
Open Access This article is licensed under a Creative Commons Attribution 4.0 International
License, which permits use, sharing, adaptation, distribution and reproduction in any medium or
format, as long as you give appropriate credit to the original author(s) and the source, provide a link to the
Creative Commons licence, and indicate if changes were made. The images or other third party material in this
article are included in the article’s Creative Commons licence, unless indicated otherwise in a credit line to the
material. If material is not included in the article’s Creative Commons licence and your intended use is not
permitted by statutory regulation or exceeds the permitted use, you will need to obtain permission directly from
the copyright holder. To view a copy of this licence, visit http://creativecommons.org/licenses/by/4.0/.
© The Author(s) 2022
Scientific Reports | (2022) 12:145 | https://doi.org/10.1038/s41598-021-04038-5 9
Vol.:(0123456789)You can also read