Effect of Er on Microstructure and Mechanical Properties of 5052 Aluminum Alloy with Big Width-To-Thickness Ratio
←
→
Page content transcription
If your browser does not render page correctly, please read the page content below
materials
Article
Effect of Er on Microstructure and Mechanical
Properties of 5052 Aluminum Alloy with Big
Width-To-Thickness Ratio
Xinwei She 1,2 , Xianquan Jiang 1,2, *, Bao Qi 1   and Kang Chen 1
 1   School of Materials and Energy, Southwest University, Tiansheng Road 2, Beibei District,
     Chongqing 400715, China; 13983073429@163.com (X.S.); qibao17830909705@163.com (B.Q.);
     chenkang@cqut.edu.cn (K.C.)
 2   Advanced Materials Research Center, Chongqing Academy of Science and Technology, Yangliu Road 2,
     Chongqing 401123, China
 *   Correspondence: jsq89@swu.edu.cn

 Received: 11 December 2019; Accepted: 20 January 2020; Published: 24 January 2020

 Abstract: The effect of Er on microstructure and mechanical properties of the 5052 aluminum alloy
 with a big width-to-thickness ratio was investigated by a metallurgical microscope, scanning electron
 microscope and tensile testing machine. The results showed that the precipitates were slightly refined
 after Er addition and Al3 Fe was transformed into Al6 Fe and AlEr with/without a small amount of Fe
 or Si. The effect of Er on grain refinement was related to its content. When Er content was lower or
 higher than 0.4%, the grain would coarsen. Homogenization could refine the grain by controlling Er
 content and distribution in the Al matrix. Long time homogenization at high temperature would
 significantly reduce the strength of the 5052 aluminum alloy and 5052 aluminum alloys with low Er
 content, but help to improve the plasticity of those with high Er content. The ultimate tensile strength,
 yield strength and elongation of the as-cast 5052 aluminum alloy were 197 MPa, 117 MPa and 22.5%
 respectively. The strength was the highest, when Er content was 0.4 wt. % and the elongation was the
 best at 0.1 wt. % Er content.

 Keywords: aluminum alloy; Er; microstructure; mechanical properties

1. Introduction
      With the continuous innovation of aviation, aerospace and other high-techs, people have put
forward higher and higher requirements for the performance of aluminum alloys in recent years [1–3].
Aluminum alloys are developing towards great strength, high toughness and excellent corrosion
resistance, and alloying or micro-alloying is one of the most effective methods [4–7]. A large number
of literatures show that the addition of rare earth elements to aluminum alloys can play a positive role
in optimizing the microstructure and mechanical properties. Among them, Sc is the most prominent,
and others like Er, La, Ce, Yb, etc. also have a good development potential [8–15].
      5XXX series aluminum alloys are widely used in aerospace, automobile and ship due to their
low density, high specific strength, good corrosion resistance and easy processing [16–19]. The 5052
aluminum alloy is one of the most typical and commonly used aluminum alloys in the 5XXX series only
containing Mg as a strengthening element. It is easy to crack in plastic deformation, which greatly limits
its application space [20,21]. At present, a 5052 aluminum alloy ingot with a big width-to-thickness
ratio is prone to edge crack because of the serious segregation along the width direction, which makes
it difficult to meet the requirements of large deformation. Therefore, it seems a new research topic in
the 5052 aluminum alloy to improve its strength and reduce its cracking tendency.

Materials 2020, 13, 568; doi:10.3390/ma13030568                              www.mdpi.com/journal/materials
Materials 2020, 13, 568                                                                           2 of 13

     In this paper, the microstructure and mechanical properties of the 5052 aluminum alloy with a big
width-to-thickness ratio in as-cast, homogenized and cold-rolled states are studied by adding trace Er
into a 5052 aluminum alloy, in order to provide a theoretical basis for improving the deformability of
(ultra) wide 5052 aluminum alloy plates.

2. Materials and Methods
     The materials are 5052 aluminum alloys with/without different Er content cast by a metal model.
The chemical composition is shown in Table 1.

                          Table 1. Chemical composition of 5052 aluminum alloys (wt. %).

                                                              Elements
  Alloy
                Si        Fe        Cu       Mn        Mg        Cr        Zn        Ti    Er     Al
    A0         0.052      0.27     0.066    0.072      2.30     0.17      0.070    0.013    0    Other
    A1         0.042      0.26     0.070    0.071      2.37     0.16      0.065    0.010   0.1   Other
    A2         0.044      0.26     0.066    0.070      2.34     0.16      0.082    0.009   0.2   Other
    A3         0.053      0.26     0.064    0.068      2.42     0.18      0.085    0.010   0.4   Other
    A4         0.055      0.27     0.065    0.069      2.39     0.17      0.087    0.009   0.8   Other

      Figure 1 shows the ingot prepared by a metal model and the sampling method. A set of
metal models made of heat-resistant die steel was designed to simulate the forming process and
microstructure characteristics of (ultra) wide aluminum alloy ingots. The wall and the base with a
thickness of 15 mm were assembled by a mechanical connection (Figure 1a). First, an energy saving
industrial furnace (SG 2-12-10, Dongtai, China) was used to heat alloy raw materials to 750 ◦ C for
melting. Then, heat preservation and standing for 30 min after mixing evenly. Finally, the casting
temperature was controlled at 700–720 ◦ C, and the ingot size was 300 mm × 200 mm × 50 mm (length
× width × thickness; Figure 1b). A laboratory electric furnace (SRX 2-12-12, Chongqing, China) was
used for homogenization with a temperature of 550 ◦ C and a holding time of 20 h. The ingot was
cooled with furnace cooling. After homogenization, the ingot was milled and its dimension before
rolling should be controlled at 220 mm × 180 mm × 40 mm. The four-rollers non reversing rolling mill
(Φ 350, Wuxi, China) was used for hot rolling and cold rolling of the ingot with a total reduction of
36 mm. Three sample plates were cut along the casting direction at the edge of the ingot or rolling
plate, and processed into tensile specimens according to GB/T 228-2002 standard. The ultimate tensile
strength (UTS), yield strength (YS) and elongation (EL) were measured by tensile testing machine
(CMT4503, Shanghai, China) at room temperature with a tensile speed of 2 mm/min and their average
values were calculated. Metallographic specimen with a size of 10 mm × 10 mm × 10 mm was cut
from the undeformed end of tensile specimens for mechanical grinding and electrolytic polishing.
Metallurgical microscope (ZEISS, Oberkochen, Germany) was used to observe the second phase and
grain (Figure 1c). Scanning electron microscope (JEOL, Tokyo, Japan) was applied to observe the
microstructure of metallographic specimen and fracture morphology of tensile specimen. Meanwhile,
energy dispersive spectrometer (X-Max, Oxford, UK) was taken to identify phase composition and
element distribution.
Materials 2020, 13, 568                                                                                 3 of 13

      Figure 1. Ingot and sampling method: (a) metal model assembled by mechanical connection; (b) ingots
      cast at 700–720 ◦ C and (c) sampling method, mainly wire cutting.

3. Results and Discussion

3.1. Microstructure
     Figure 2 shows the metallographic structure of as-cast 5052 aluminum alloys. A0 was mainly
composed of α-Al and the second phase distributed along the grain boundary. The second phase with
a dimension of about 50 µm had two main morphologies, acicular and Chinese script (Figure 2a1).
After adding Er, the second phase was slightly refined. With the increase of Er content, the number
of the second phase increased. When Er content was lower than 0.4%, the second phase mostly
presented acicular, and when it was higher than 0.4%, the Chinese script phase was obviously
increased (Figure 2b1–e1). Furthermore, when Er content was 0.2%, the second phase suddenly
grew up to 80 µm, when it increased to 0.4%, the second phase abruptly became fine, approximately
30 µm, and when further increasing, the second phase began to grow up again and the impurities
increased (Figure 2c1–e1). The addition of an appropriate amount of Er was conducive to refining
the microstructure and the increase of Er content could promote the transformation of the second
phase from acicular to Chinese script [22]. It could be seen that the transition point was 0.4%. The
grain of A0 was nearly equiaxed and its size distribution was uneven, about 116 µm (Figure 2a2). This
was mainly due to the faster cooling rate and the larger temperature gradient at the edge of the ingot,
resulting in a different growth rate of grain. After the addition of Er, the grain size had an obvious
change. When Er content was less than 0.4%, the grain presented coarsened and its size was more than
400 µm. Moreover, the grain tended to be equiaxed with the increase of Er content (Figure 2b2,c2).
When Er content was 0.4%, the grain was rapidly refined to 159 µm and its size distribution was also
inhomogeneous, and when it reached 0.8%, the grain exceptionally grew again with a mean size of 243
µm, accompanied by dendrite formation (Figure 2d2,e2). It could be inferred that the refining effect of
Er on grain was related to its content.
Materials 2020, 13, 568 4 of 13
Figure 2. Metallographic structure of as-cast 5052 aluminum alloys with embedded graphs to reflect
the local characteristics on the top right of images: (a1,a2) A0 without Er; (b1,b2) A1 with 0.1% Er;
(c1,c2) A2 with 0.2% Er; (d1,d2) A3 with 0.4% Er and (e1,e2) A4 with 0.8% Er.
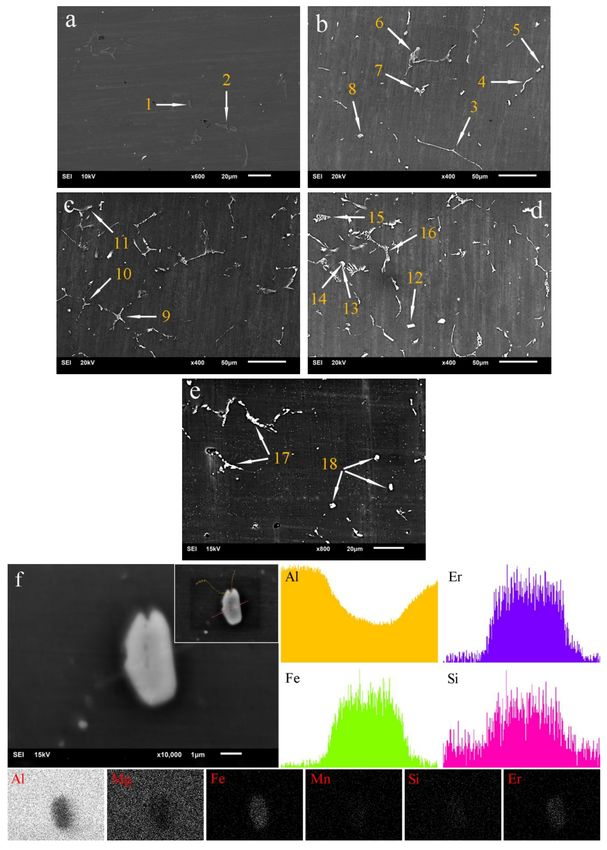
Figure 3 shows the metallographic structure of homogenized 5052 aluminum alloys. Compared
with the as-cast microstructure, the second phase was mildly refined and distributed more dispersively.
This was mainly due to the re-dissolution of the second phase in the homogenization process, which
was reflected in the roundness of edge and corner (Figure 2a1–e1; Figure 3a1–e1). Homogenization
had little effect on grain size of the 5052 aluminum alloy (A0), but it could improve the uniformity
of size distribution (Figures 2a2 and 3a2). For 5052 + Er aluminum alloys (A1–4), homogenization
could significantly refine the grain (Figure 2b2–e2; Figure 3b2–e2). Especially when Er content was
0.8%, the grain size was reduced to about 112 µm and the dendrite in the grain was almost eliminated
(Figures 2e2 and 3e2). These evidences showed that homogenization could activate Er.
Materials 2020, 13, 568                                                                                       5 of 13

      Figure 3. Metallographic structure of homogenized 5052 aluminum alloys with embedded graphs to
      reflect the local characteristics on the top right of images: (a1,a2) A0 without Er; (b1,b2) A1 with 0.1%
      Er; (c1,c2) A2 with 0.2% Er; (d1,d2) A3 with 0.4% Er and (e1,e2) A4 with 0.8% Er.

     Previous studies showed that the refinement effect of Er on the grain of pure aluminum first
appeared when Er content was 0.2%. For the Al-4.5Mg alloy, it should reach 0.4%. When Er content
continued to increase, the grain would be further refined. Additionally, the effect of homogenization on
grain size could be ignored [23,24]. These results indicated that the refining effect of Er was primarily
related to its solid solubility in aluminum alloys. When Er content was low, it mainly existed in the Al
matrix in the form of a solid solution, which would not produce a grain refinement effect. When Er
content was high, part of Er reacted with Al to form primary Al3 Er, which increased heterogeneous
nucleation sites on the one hand and blocked the movement of the grain boundary on the other hand [25].
In the experiment, only when Er content was 0.4%, the grain size was close to that of A0 (Figure 2a2,d2).
Lower or higher than this content, it could not refine the grain, but resulted in coarsening, which
maybe had a close relationship with the composition undercooling induced by the addition of Er
(Figure 2b2–e2). In particular, the grain size of 5052 + Er aluminum alloys was greatly reduced after
homogenization and the size distribution became uniform. When Er content was excessive (0.8%), the
effect of grain refinement could be excited violently (Figures 2e2 and 3e2). Considering the melting
point of the formed AlEr was much higher than that of aluminum alloys, it could not completely
re-dissolve into the Al matrix during homogenization, but only released a small amount of Er through
the corner rounding of Er-containing phases (Figure 3e1). Of course, the disappearance of intragranular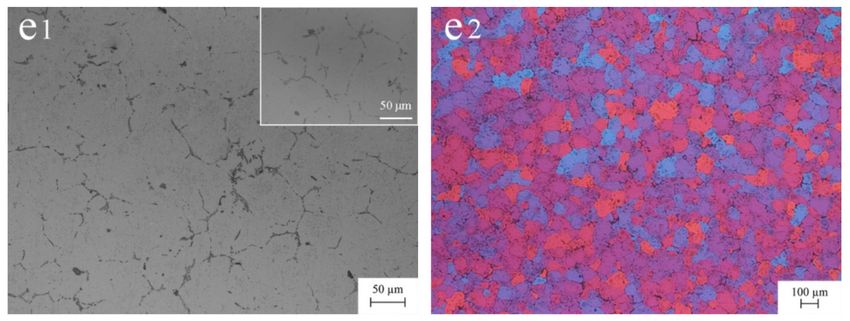
Materials 2020, 13, 568                                                                                       6 of 13

dendrite also proved this view partly (Figure 3e2). Essentially, homogenization refined the grain by
controlling Er content and distribution in the Al matrix. The results of this experiment were quite
different from the previous research mostly due to the difference of microstructure caused by the
forming method of aluminum alloy ingots with a big width-to-thickness ratio.
      Figure 4 shows the metallographic structure of cold-rolled 5052 aluminum alloys. After hot
rolling and cold rolling, the second phase with a size of approximately 10 µm was elongated or
broken along the rolling direction, and evenly distributed in the Al matrix. It could be found that
when Er content was 0.1%, the precipitation of the second phase seemed almost the same as that of
A0 (Figure 4a1,b1). With the increase of Er content, the distribution of the second phase was more
dispersive (Figure 4b1–e1). The grain change was similar to the second phase. Concretely, the fibrous
grain of A0 was broken seriously with a length of less than 200 µm and showed regular layered
distribution (Figure 4a2). After Er was added, the arrangement of grain did not change. However, the
grain boundary was gradually blurred with the increase of Er content, suggesting the deformation
degree of grain was increasing (Figure 4b2–e2).

      Figure 4. Metallographic structure of cold-rolled 5052 aluminum alloys with embedded graphs to
      reflect the local characteristics on the top right of images: (a1,a2) A0 without Er; (b1,b2) A1 with 0.1%
      Er; (c1,c2) A2 with 0.2% Er; (d1,d2) A3 with 0.4% Er and (e1,e2) A4 with 0.8% Er.

      Figure 5 shows the SEM image of as-cast and homogenized 5052 aluminum alloys.
EDS composition analysis was carried out for the second phase with different morphologies in
5052 aluminum alloys, and their types were determined based on relevant literatures [26]. The EDS
test results are shown in Table 2. It could be observed that there were two different second phases with
a size of 10–20 µm in A0. Both the coarse short-acicular phase (arrow 1) and the irregular phase (arrow
Materials 2020, 13, 568                                                                               7 of 13

2) were Al3 Fe, indicating Mg had basically dissolved into the Al matrix (Figure 5a). A2 consisted
of six different second phases with various morphologies. Among them, the long-acicular phase
(arrow 3), the bent rod phase (arrow 4) and the irregular phase (arrow 6) should be Al6 Fe, while the
dot phase (arrow 5) and the E-type phase (arrow 7,8) should be primary AlEr adsorbing a little Fe
or/and Si (Figure 5b). A3 was mainly composed of three different second phases in morphologies
of Chinese character (arrow 9), arborization (arrow 10) and feather (arrow 11) with a size of 30–50
µm, all of which were primary AlEr with/without a small amount of Fe or Si (Figure 5c). At this
point, the grain refinement began to appear (Figure 2b2–d2). A4 mostly had a variety of second
phases with four morphologies. The block phase (arrow 12) was AlCrMg with a little Er. Both the
flower-like phase (arrow 15) and the Chinese character phase (arrow 16) were primary AlEr containing
no/trace Fe and Si. In particular, the bone phase composition was not uniform, i.e., a large number
of Er and a small amount of Si were found at the end of the phase (arrow 14), while only Si was
detected at the bone rod (arrow 13; Figure 5d). When casting with the metal model, there would
always be component fluctuation and energy fluctuation in molten metal. This was especially true for
the preparation of the 5052 aluminum alloy ingots with a big width-to-thickness ratio. In the process
of solidification, supersaturated Er and Fe were expelled from grain and accumulated at the front of
interface between solid and liquid, promoting the transformation of the dot phase and E-type phase
into the Chinese character phase, flower-like phase and so on. After homogenization, the second
phase in A3 disintegrated due to re-dissolution, and the size was reduced to 5–20 µm (Figure 5e). The
composition analysis of long bar phases (arrow 17) and dot phases (arrow 18) showed that both were
AlFeSiEr, but had a different morphology. Meanwhile, it could be found that dot phases here were
quite different from those in Figure 5b–d, which was necessary to have an in-depth study. By EDS
line scanning, it could be observed that Fe, Er and Si were the main elements in the center of the dot
phase on the far right where Al concentration decreased significantly. The EDS surface scanning could
also obtain a similar result (Figure 5f). Some studies showed that Er was easy to gather with Fe, Mn
and other elements, but it was difficult to form intermetallic compounds. Er had a strong interaction
with Al or Si, and the Gibbs free energy of Er5 Si3 precipitation was smaller than that of Al3 Er, i.e., Er
reacted with Si preferentially and the excess would combine with Al to form Al3 Er [27–29]. Generally,
in Al–Mg alloys, Fe preferred to react with Al in the early stage of solidification [26]. Therefore, the dot
phase was probably a mixture of ErSi, AlEr and AlFe. The morphology and distribution of AlEr in the
homogenized structure was obviously different from that in the as-cast structure, which should be
secondary. At this time, the grain refinement was more significant Figures 2d2 and 3d2).
Materials 2020, 13, 568                                                                                   8 of 13

      Figure 5. Microstructure of 5052 aluminum alloys observed via SEM: as-cast (a) A0 without Er, (b) A2
      with 0.2% Er, (c) A3 with 0.4% Er, (d) A4 with 0.8% Er; homogenized (e) A3 with 0.4% Er and (f) a dot
      phase analyzed via EDS line scanning and surface scanning.
Materials 2020, 13, 568                                                                                         9 of 13

       Table 2. EDS results of the second phase of as-cast and homogenized 5052 aluminum alloys (at. %).

                                                               Elements
     Arrow
                           Al           Fe              Mg                Si              Er             Cr
         1                70.86       29.14               -                 -             -                -
         2                71.24       27.82             0.94                -             -                -
         3                86.68       11.85             1.26                -             -              0.21
         4                89.00        8.70             1.88              0.42            -                -
         5                85.65          -              2.37              1.13         10.85               -
         6                90.28        7.99             1.73                -             -                -
         7                91.33        0.29             1.56                -           6.82               -
         8                91.28        0.41             2.01              0.73          5.57               -
         9                92.90          -              2.95                -           4.15               -
        10                93.33       0.80              2.82                -          3.05                -
        11                91.82          -              3.08              0.85         4.25                -
        12                85.38          -              7.25                -          1.92              5.45
        13                93.58          -              3.57              2.85            -                -
        14                90.88          -              2.29              0.96         5.87                -
        15                93.57          -              2.82                -          3.61                -
        16                87.51       0.90              1.49              0.88         9.22                -
        17                79.27       12.89             0.30              0.81         6.73                -
        18                80.21       11.27             1.38              0.82         6.32                -

3.2. Mechanical Properties
      Figure 6 shows the mechanical properties of 5052 aluminum alloys. It could be observed that the
UTS, YS and EL of as-cast A0 were 197 MPa, 117 MPa and 22.5% respectively. After adding Er, the UTS
and YS slightly increased, the highest A3 increased by 5.58% and 19.66%. While, the change of EL
fluctuated greatly, the best A1 increased by 16%. It was worth noting that when Er content was 0.8%,
the EL decreased by 40.44%, which might be due to the high Er content, resulting in the formation of
coarse Er-containing phases and impurities at the grain boundary (Figures 2e1 and 5d). The strength
of the 5052 aluminum alloy (A0) and 5052 aluminum alloys with low Er content (A1, A2) would be
significantly reduced by long time homogenization at high temperature. However, those with high Er
content (A3,A4) would not be affected and their plasticity would be improved. A3 showed a trend
of strength decreasing and EL increasing and A4 exhibited an increase in UTS and EL, which were
the result of grain refinement and grain growth inhibition caused by the precipitated Er-containing
phases (Figure 3d2,e2). After rolling, the strength and EL of 5052 + Er aluminum alloys were higher
than those of the 5052 aluminum alloy, especially the EL, increasing by 35.47–92.44%. When Er content
increased, the strength increased and the EL decreased. All test results are shown in Table 3.

      Table 3. Mechanical properties of 5052 aluminum alloys (ultimate tensile strength (UTS), yield strength
      (YS) MPa and elongation (EL) %).

                            As-Cast                     Homogenized                        Cold-Rolled
   Alloy
                 UTS            YS     EL        UTS           YS          EL      UTS         YS           EL
    A0           197            117   22.5        183          111        18.0      329        319         1.72
    A1           198            131   26.1        194          114        24.3      337        325         3.31
    A2           197            141   21.4        184          115        17.1      334        323         2.75
    A3           208            140   23.9        204          117        24.2      344        333         2.59
    A4           199            137   13.4        202          125        23.8      347        339         2.33
Materials 2020, 13, 568 10 of 13
Figure 6. Mechanical properties of 5052 aluminum alloys tested via tensile testing machine: (a) UTS;
(b) YS and (c) EL.
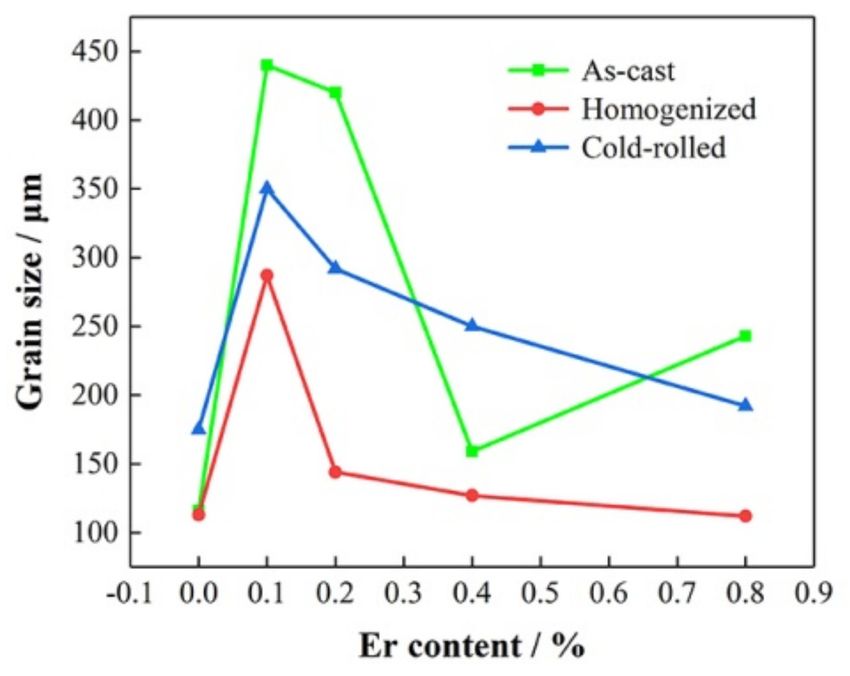
Figure 7 shows the relation between grain size and Er content of 5052 aluminum alloys. It could
be seen that the mechanical properties (especially the UTS and YS) of 5052 aluminum alloys in as-cast
and homogenized states were not decreased, but slightly increased, even though the grain became
coarsened after adding Er. In fact, the addition of Er could slightly improve the room temperature
strength of Al–Mg alloys and the effect was not as obvious as that on the high temperature strength
due to the stability of Al3 Er at elevated temperature [24]. For the 5052 aluminum alloy, it was not only
the grain size that could affect the strength, but also the number, size, morphology and distribution of
precipitates. It was clear that Er addition helped to refine the second phase, promote the transformation
of Al3 Fe into Al6 Fe and AlEr with/without a small amount of Fe or Si and make precipitates more
dispersive, which were conducive to improving the plasticity. Possibly, the dispersion of the second
phase made up for the negative effect of grain coarsening on the strength. The statistical results of
grain size are shown in Table 4.
Table 4. Grain size of 5052 aluminum alloys (µm).
Grain Size
Er Content
As-Cast Homogenized Cold-Rolled
0 116 113 175
0.1% 440 287 350
0.2% 420 144 292
0.4% 159 127 250
0.8% 243 112 192
Figure 8 shows the fracture morphology of cold-rolled 5052 aluminum alloys. The fracture section
of 5052 aluminum alloys could be divided into three regions from the surface to the center. Taking A0
as an example, the three regions were the necking region (NR), brittle fracture region (BFR) and ductile
fracture region (DFR) respectively (Figure 8a). NR was characterized by some parallel sliding steps
with an angle of 40 degrees to the transverse direction. BFR mainly presented river patterns. DFR
consisted of a large number of dimples. Generally for aluminum alloys, the wider the DFR or NR, and
the narrower the BFR were, the better plasticity would be [30–32]. When Er was added, the DFR wasMaterials 2020, 13, 568 11 of 13
widened obviously, the NR became flat, and the transition between the adjacent regions got smoother,
suggesting the plasticity was improved. With the increase of Er content, the width and the average
dimple size of DFR were steadily decreasing, while the width of BFR was slowly increasing, indicating
the plasticity was reducing (Figure 8b–e).
Figure 7. Relation between grain size and Er content of 5052 aluminum alloys.
Figure 8. Fracture morphology of cold-rolled 5052 aluminum alloys with embedded graphs to reflect
the local characteristics on the right of images observed via SEM: (a) A0 without Er; (b) A1 with 0.1% Er;
(c) A2 with 0.2% Er; (d) A3 with 0.4% Er and (e) A4 with 0.8% Er.
4. Conclusions
The microstructure and mechanical properties of the 5052 aluminum alloy with a big
width-to-thickness ratio in as-cast, homogenized and cold-rolled states were studied by addingMaterials 2020, 13, 568 12 of 13
trace Er to clarify the grain refinement of Er and the relationship between Er content and alloy strength
and plasticity. The following conclusions could be drawn:
(1) The microstructure of the as-cast 5052 aluminum alloy with a big width-to-thickness ratio was
mainly composed of α-Al and Al3 Fe. After adding Er, the second phase was slightly refined, and
Al3 Fe was transformed into Al6 Fe and AlEr with/without a small amount of Fe or Si. The effect
of Er on grain refinement was related to its content. When Er content was lower or higher than
0.4%, the grain would coarsen.
(2) Homogenization had little effect on the grain size of the 5052 aluminum alloy with a big
width-to-thickness ratio, but it could improve the uniformity of grain size distribution.
Homogenization was conducive to refining the grain by controlling Er content and distribution
in the Al matrix. AlFeSiEr with a refining effect might be a mixture of multiple phases blending
with each other.
(3) The ultimate tensile strength, yield strength and elongation of the as-cast 5052 aluminum alloy
with a big width-to-thickness ratio were 197 MPa, 117 MPa and 22.5% respectively. The strength
was the highest, when Er content was 0.4% and the elongation was the best at 0.1% Er content.
Long time homogenization at high temperature would significantly reduce the strength of the
5052 aluminum alloy and 5052 aluminum alloys with low Er content, but help to improve the
plasticity of those with high Er content.
(4) The fracture morphology of cold-rolled 5052 aluminum alloys with a big width-to-thickness ratio
was composed of a necking region, brittle fracture region and ductile fracture region. With the
increase of Er content, the width and the average dimple size of DFR were gradually decreasing,
while the width of BFR was slowly increasing, which was consistent with the change of elongation.
Author Contributions: Literature search, X.S.; Figures, X.S. and B.Q.; Study design, X.J. and X.S.; Data collection,
X.S., B.Q. and K.C.; Data analysis, X.S.; Data interpretation, X.S. and X.J.; Writing, X.S. and X.J. All authors have
read and agreed to the published version of the manuscript.
Funding: This research is funded by the National Natural Science Foundation of China (51971183), Natural
Science Foundation of Chongqing, China (cstc2019jcyj-msxmX0594) and Performance Incentive and Guidance
Program of Scientific Research Institutions of Chongqing, China (cstc2018jxjl50006).
Conflicts of Interest: The authors declare no conflict of interest.
References
1. Zhang, X.M.; Deng, Y.L.; Zhang, Y. Development of high strength aluminum alloys and processing techniques
for the materials. Acta Metall. Sin. 2015, 51, 257–271.
2. Yang, H.; She, X.W.; Tang, B.B.; Li, C.M.; Jiang, X.Q. Study of the microstructure and ring element segregation
zone of spray deposited SiCp /7055Al. Materials 2019, 12, 1299. [CrossRef] [PubMed]
3. Yu, T.Y.; Hyer, H.; Sohn, Y.H.; Bai, Y.L.; Wu, D.Z. Structure-property relationship in high strength and
lightweight AlSi10Mg microlattices fabricated by selective laser melting. Mater. Des. 2019, 182, 108062.
[CrossRef]
4. Shabestari, S.G. The effect of iron and manganese on the formation of intermetallic compounds in
aluminum-silicon alloys. Mater. Sci. Eng. A 2004, 383, 289–298. [CrossRef]
5. Suarez-Pena, B.; Asensio-Lozano, J. Influence of Sr modification and Ti grain refinement on the morphology
of Fe-rich precipitates in eutectic Al-Si die cast alloys. Scr. Mater. 2006, 54, 1543–1548. [CrossRef]
6. Liao, Y.G.; Han, X.Q.; Zeng, M.X.; Jin, M. Influence of Cu on microstructure and tensile properties of 7xxx
series aluminum alloy. Mater. Des. 2015, 66, 581–586. [CrossRef]
7. Zykova, A.; Martyushev, N.; Skeeba, V.; Zadkov, D.; Kuzkin, A. Influence of W addition on microstructure
and mechanical properties of Al-12%Si alloys. Materials 2019, 12, 981. [CrossRef]
8. Tzeng, Y.C.; Wu, C.T.; Bor, H.Y.; Horng, J.L.; Tsai, M.L.; Lee, S.L. Effects of scandium addition on iron-bearing
phases properties of Al-7Si-0.6Mg alloys. Mater. Sci. Eng. A 2014, 593, 103–110. [CrossRef]
9. Jiang, Y.; Liu, F. Effects of Sc or/and Ge addition on microstructure and mechanical properties of as-cast 6016
Al alloy. J. Alloy. Compd. 2019, 809, 151829. [CrossRef]Materials 2020, 13, 568 13 of 13
10. Pandee, P.; Patakham, U.; Limmaneevichitr, C. Microstructural evolution and mechanical properties of
Al-7Si-0.3Mg alloys with erbium additions. J. Alloy. Compd. 2017, 728, 844–853. [CrossRef]
11. Guo, T.B.; Wang, B.; Zhang, Z.F.; Sun, Q.Z.; Jin, Y.H.; Ding, W.W. Effect of micro-scale Er on the microstructure
and fluidity of ZL205A alloy. Materials 2019, 12, 1688. [CrossRef] [PubMed]
12. Zhang, X.; Wang, Z.H.; Zhou, Z.H.; Xu, J.M. Effects of cerium and lanthanum on the corrosion behavior of
Al-3.0 wt.%Mg alloy. J. Mater. Eng. Perform. 2016, 25, 1122–1128. [CrossRef]
13. Qiu, C.R.; Miao, S.N.; Li, X.R.; Xia, X.C.; Ding, J.; Wang, Y.N.; Zhao, W.M. Synergistic effect of Sr and La on
the microstructure and mechanical properties of A356.2 alloy. Mater. Des. 2017, 114, 563–571. [CrossRef]
14. Wen, S.P.; Gao, K.Y.; Huang, H.; Wang, W.; Nie, Z.R. Role of Yb and Si on the precipitation hardening and
recrystallization of dilute Al-Zr alloys. J. Alloy. Compd. 2014, 599, 65–70. [CrossRef]
15. Li, Q.L.; Li, J.B.; Li, B.Q.; Zhu, Y.Q.; Liu, D.X.; Lan, Y.F.; Wang, S. Mechanical properties and microstructural
evolution of Yb-modified Al-20%Si alloy. J. Mater. Eng. Perform. 2018, 27, 3498–3507. [CrossRef]
16. Golumbfskie, W.J.; Tran, K.T.; Noland, J.M.; Park, R.; Stiles, D.J.; Grogan, G.; Wong, C. Survey of detection,
mitigation, and repair technologies to address problems caused by sensitization of Al-Mg alloys on navy
ships. Corrosion 2016, 72, 314–328. [CrossRef]
17. Engler, O.; Marioara, C.D.; Hentschel, T.; Brinkman, H.J. Influence of copper additions on materials properties
and corrosion behaviour of Al-Mg alloy sheet. J. Alloy. Compd. 2017, 710, 650–662. [CrossRef]
18. D’Antuono, D.S.; Gaies, J.; Golumbfskie, W.; Taheri, M.L. Direct measurement of the effect of cold rolling on
beta phase precipitation kinetics in 5xxx series aluminum alloys. Acta Mater. 2017, 123, 264–271. [CrossRef]
19. Choi, I.K.; Cho, S.H.; Kim, S.J.; Jo, Y.S.; Kim, S.H. Improved corrosion resistance of 5xxx aluminum alloy by
homogenization heat treatment. Coatings 2018, 8, 39. [CrossRef]
20. Wang, B.; Chen, X.H.; Pan, F.S.; Mao, J.J.; Fang, Y. Effect of cold rolling and heat treatment on microstructure
and mechanical properties of AA 5052 aluminum alloy. Trans. Nonferr. Met. Soc. China 2015, 25, 2481–2489.
[CrossRef]
21. Cui, X.L.; Wang, X.S.; Yuan, S.J. Formability improvement of 5052 aluminum alloy tube by the outer cladding
tube. Int. J. Adv. Manuf. Technol. 2017, 90, 1617–1624. [CrossRef]
22. Che, H.M.; Jiang, X.Q.; Qiao, N.; Liu, X.K. Effect of Er/Sr/Cu additions on the microstructure and mechanical
properties of Al-Mg alloy during hot extrusion. J. Alloy. Compd. 2017, 708, 662–670. [CrossRef]
23. Xing, Z.B.; Nie, Z.R.; Zou, J.X.; Gao, X.D. Existing form and effect of erbium in Al-Er alloy. J. Chin. Rare Earth
Soc. 2007, 25, 234–238.
24. Wen, S.P.; Xing, Z.B.; Huang, H.; Li, B.L.; Wang, W.; Nie, Z.R. The effect of erbium on the microstructure and
mechanical properties of Al-Mg-Mn-Zr alloy. Mater. Sci. Eng. A 2009, 516, 42–49. [CrossRef]
25. Zhu, S.D.; Huang, H.; Nie, Z.R.; Wen, S.P.; Zhang, Z.J. Formation and evolution of Al3 Er phase in Al-Er alloy.
Chin. J. Rare Metals 2009, 33, 164–169.
26. Wang, Z.T.; Tian, R.Z. Aluminum Alloy and Processing Manual; Central South University Press: Changsha,
China, 2005.
27. Wang, X.D.; Lin, S.P.; Tang, Z.L.; Nie, Z.R. Existing morphology and precipitate characteristics of Er in
Al-Mg-Mn-Zr-Er alloy. Spec. Cast. Nonferr. Alloy. 2010, 30, 965–968.
28. Wang, W.; Tang, Z.L.; Zhan, C.Y.; Nie, Z.R. Calculations of formation enthalpies of Al-RE intermetallics. Rare.
Metal. Mat. Eng. 2009, 38, 2100–2105.
29. Sun, S.P.; Yi, D.Q.; Chen, Y.; Wu, C.P. Thermodynamic properties of binary alloys of Al-Er and Si-Er. Chin. J.
Nonferr. Metals 2009, 19, 1580–1586.
30. Zhong, Q.P.; Zhao, Z.H. Fractography; Higher Education Press: Beijing, China, 2006.
31. Hilders, O.A.; Pena, N.D.; Ramos, M.; Saenz, L.; Berrio, L.; Caballero, R.A.; Quintero, A. Stress triaxiality
dimple fracture morphology and fractal dimension relations for several aluminum alloys. Mater. Sci. Forum
2002, 396–402, 1321–1328. [CrossRef]
32. Karamouz, M.; Azarbarmas, M.; Emamy, M.; Alipour, M. Microstructure, hardness and tensile properties of
A380 aluminum alloy with and without Li additions. Mater. Sci. Eng. A 2013, 582, 409–414. [CrossRef]
© 2020 by the authors. Licensee MDPI, Basel, Switzerland. This article is an open access
article distributed under the terms and conditions of the Creative Commons Attribution
(CC BY) license (http://creativecommons.org/licenses/by/4.0/).You can also read