ECOSYSTEM ASSESSMENT OF THE TRISTAN DA CUNHA ISLANDS
←
→
Page content transcription
If your browser does not render page correctly, please read the page content below
ECOSYSTEM ASSESSMENT OF
               THE TRISTAN DA CUNHA ISLANDS
                           NATIONAL GEO GR A PHIC PR IST IN E SE AS,
                   ROYAL SOCIET Y FO R PR OT E C T ION OF BIR DS A N D
                                TRISTAN DA C U N HA GOV E R N M E N T

                                          Expedition Report | July 2017

Jennifer E. Caselle, Scott L. Hamilton, Kathryn Davis, Marthán Bester, Mia Wege, Chris Thompson, Alan Turchik, Ryan Jenkinson,
  Douglas Simpson, Juan Mayorga, Paul Rose, Mike Fay, Dan Myers, James Glass, Trevor Glass, Rodney Green, Julian Repetto,
      George Swain, Katrine Herian, Ian Lavarello, Jonathan Hall, Andy Schofield, Sam Dews, David McAloney, Enric Sala
HOW TO CITE THIS REPORT:

Caselle J.E., Hamilton S.L., Davis K., Bester M.,
Wege M., Thompson C., Turchik A., Jenkinson R.,
Simpson D., Mayorga J., Rose P., Fay M., Myers D.,
Glass J., Glass T., Green R., Repetto J., Swain G.,
Herian K., Lavarello I., Hall J., Schofield A.,
Dews S., McAloney D., and Sala E. 2017. Ecosystem
Assessment of the Tristan Da Cunha Islands.
National Geographic Pristine Seas, Royal Society
for Protection of Birds and Tristan da Cunha
Government. Expedition Report. July 2017.
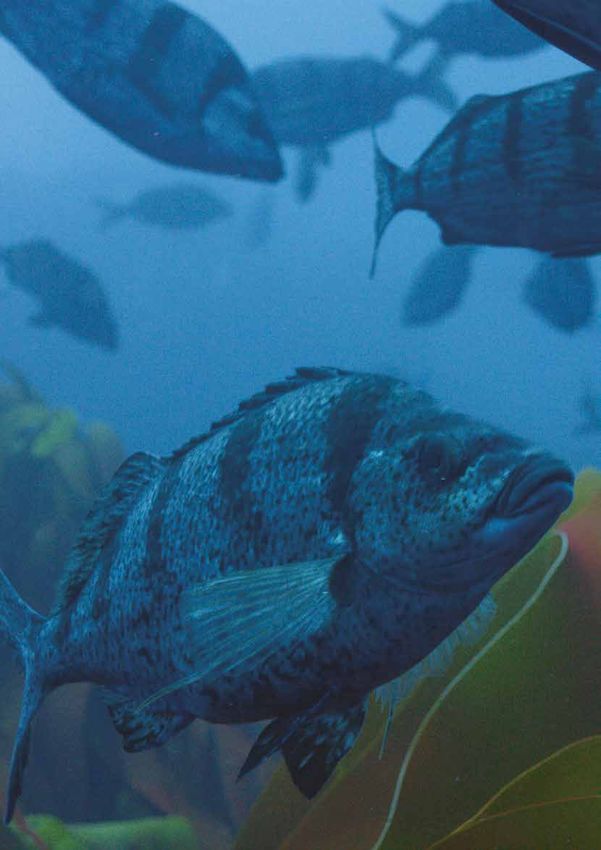
TABLE OF
CONTENTS
EXECUTIVE SUMMARY  .  .  .  .  .  .  .  .  .  .  .  .  .  .  .  .  .  .  .  .  .  .  .  .  .  .  .  .  .  .  .  .  .  .  .  . 3

INTRODUCTION .  .  .  .  .  .  .  .  .  .  .  .  .  .  .  .  .  .  .  .  .  .  .  .  .  .  .  .  .  .  .  .  .  .  .  .  .  .  .  .  .  . 11

OBJECTIVES .  .  .  .  .  .  .  .  .  .  .  .  .  .  .  .  .  .  .  .  .  .  .  .  .  .  .  .  .  .  .  .  .  .  .  .  .  .  .  .  .  .  .  .         17

RESULTS .  .  .  .  .  .  .  .  .  .  .  .  .  .  .  .  .  .  .  .  .  .  .  .  .  .  .  .  .  .  .  .  .  .  .  .  .  .  .  .  .  .  .  .  .  .  .   21
Nearshore Kelp Forest Scuba Surveys
Deep Sea and Pelagic Camera Surveys
Shark Research – Movement Studies
Invasive Species Research – Surveys, Diet and Life History Studies
Microplastics – Methods and Results
Pinniped Research
Fishing Effort and Vessel Traffic
Oceanography

DISCUSSION .  .  .  .  .  .  .  .  .  .  .  .  .  .  .  .  .  .  .  .  .  .  .  .  .  .  .  .  .  .  .  .  .  .  .  .  .  .  .  .  .  .  .            59

RECOMMENDATIONS .  .  .  .  .  .  .  .  .  .  .  .  .  .  .  .  .  .  .  .  .  .  .  .  .  .  .  .  .  .  .  .  .  .  .  .  .                         71

DETAILED METHODS .  .  .  .  .  .  .  .  .  .  .  .  .  .  .  .  .  .  .  .  .  .  .  .  .  .  .  .  .  .  .  .  .  .  .  .  . 75
Landsat Kelp Imagery
Nearshore Kelp Forest SCUBA Survey Techniques
Pelagic and Deep Drop Camera Survey Techniques
Data Analysis for SCUBA, Deep Sea and Pelagic Camera surveys
Shark Tagging Methods
Pinniped Methods
Invasive Species Research – Methods
Oceanographic Research

EXPEDITION TEAM  .  .  .  .  .  .  .  .  .  .  .  .  .  .  .  .  .  .  .  .  .  .  .  .  .  .  .  .  .  .  .  .  .  .  .  .  .                        83

REFERENCES .  .  .  .  .  .  .  .  .  .  .  .  .  .  .  .  .  .  .  .  .  .  .  .  .  .  .  .  .  .  .  .  .  .  .  .  .  .  .  .  .  .  . 84
EXECUTIVE SUMMARY
3

EXECUTIVE
SUMMARY
Tristan da Cunha is a remote group of islands in the South Atlantic,
situated approximately 2,700km from South Africa and 3,700km
from the nearest shores of South America. The northern island group
is composed of Tristan da Cunha, Inaccessible and Nightingale
Islands while the southernmost and most isolated island, Gough,
lies 380km to the south southeast. Tristan da Cunha is part of the
United Kingdom Overseas Territory of Saint Helena, Ascension
and Tristan da Cunha. The wide spaces between the islands in
the group give Tristan da Cunha a very large Exclusive Economic
Zone (EEZ) of approximately 754,000km2 which includes a broad
range of oceanographic features and offshore habitats, such as
seamounts. The Tristan Islands sit at the confluence of two major
ocean currents, with a resulting temperature boundary or front
(Subtropical Front). Consequently, Gough Island sea surface
temperature is on average 3–4°C colder than the northern islands
and likely experiences enhanced nutrient availability.

              ECOSYSTEM ASSESSMENT OF THE TRISTAN DA CUNHA ISLANDS   |   EXPEDITION REPORT   |   JULY 2017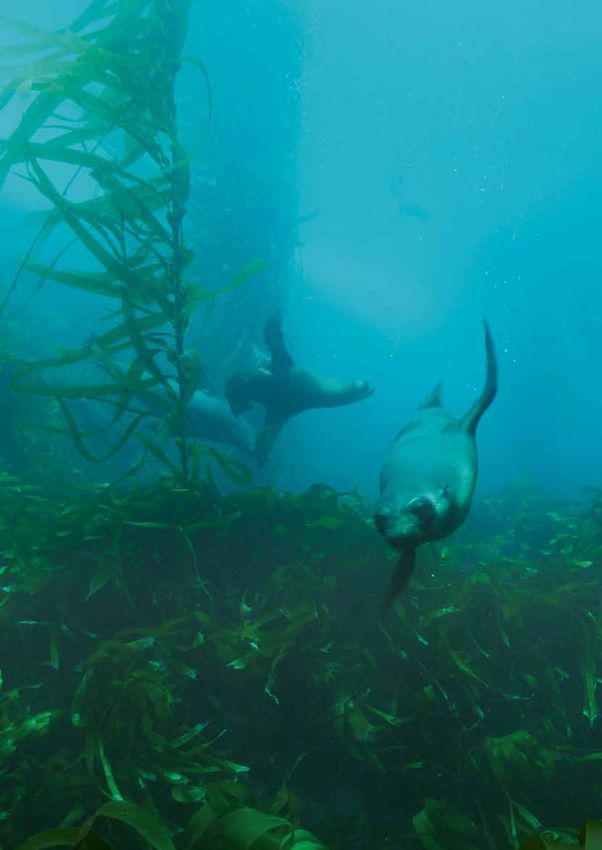
4
The Tristan archipelago is a hotspot of terrestrial endemic biodiversity. Both Gough
and Inaccessible Islands have been given UNESCO World Heritage Site status for their
near-pristine environments and unique wildlife populations. The marine environment
has been less well studied. The marine environment has lower biodiversity than
terrestrial habitats but high biomass of several important species, including the Tristan
rock lobster (Jasus tristani) that is the target of a sustainably certified fishery. The
fishery provides an important source of revenue for the islanders as well as providing
transportation to and from the island via the larger fishing vessel. While all of the Tristan
island’s ecosystems appear relatively intact and healthy, there are numerous threats,
including introductions of non-native and invasive species, shipping and illegal fishing.
Finally, climate change effects on this precarious system are unknown at present but
could potentially alter Tristan’s marine and terrestrial ecosystems in dramatic ways.
In January–February 2017, National Geographic’s Pristine Seas project, in collaboration
with the Royal Society for the Protection of Birds (RSPB) and the Tristan da Cunha
Government (including the Fisheries and Conservation Departments) conducted a
21-day expedition to Tristan da Cunha, Nightingale, Inaccessible and Gough Islands.
The primary goals of the expedition were to conduct comprehensive quantitative
surveys of the health of the archipelago’s largely unknown marine environment to
assist the Government and people of Tristan da Cunha in planning marine protection.
The results of the expedition highlight the unique marine ecosystem of this
archipelago, particularly the pelagic and deep-sea environments, which were virtually
unstudied and documented scientifically. The work presented in this report is meant
to complement ongoing research at Tristan da Cunha and provide a springboard to
help inform the Tristan Government about potential protection schemes that protect
both important fisheries and unique biodiversity of the archipelago.
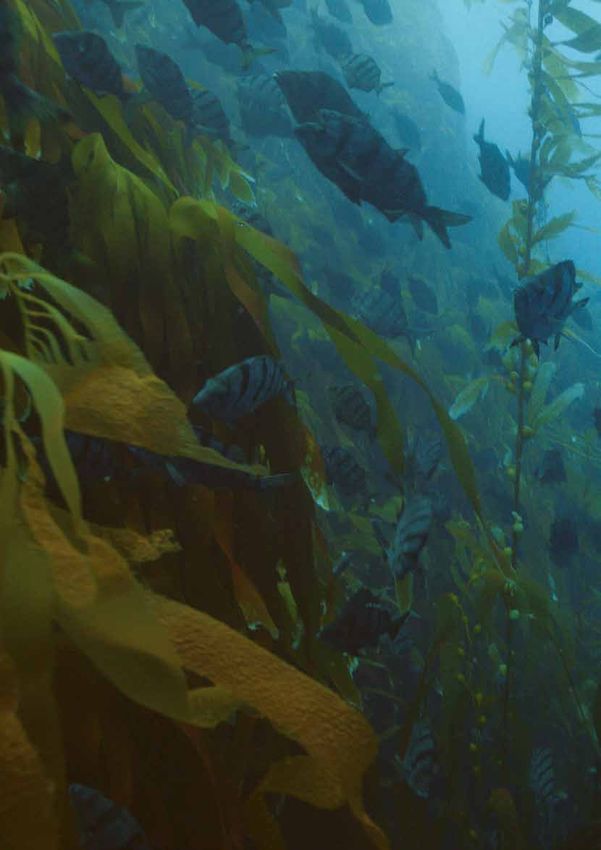
NEARSHORE ROCKY REEFS AND KELP FORESTS
In general, the Tristan da Cunha Islands have very low faunal biodiversity in nearshore
marine habitats, likely due to extreme isolation and lack of any island stepping
stones with appropriate habitat between the islands and any continental landmass.
We conducted quantitative SCUBA surveys focused on the abundant, conspicuous
and strongly interacting members of the kelp forest communities including fishes,
kelps, lobsters and any organisms that might interact with lobsters. We targeted kelp-
dominated boulder reefs and found that within this habitat type, there was very little
variation in substrate type or physical relief with most areas containing high relief,
boulders covered in kelps or sandy areas between the boulder reefs.
We measured fish biomass (tonnes/ha) and density (no./100m2) for all observed fish
species at each island. Total fish biomass ranged between 1.5–2.75 tonnes/ha, which
indicates a healthy fish assemblage. Five finger (Nemadactylus monodactylus) were
dominant both numerically and in terms of biomass at all four islands. Interisland
differences in biomass were driven by yellowtail amberjack (Seriola lalandi) which
were abundant at the northern islands but absent at Gough. At Gough, where most
fish were larger on average, false jacopever (Sebastes capensis) and telescope fish
EXECUTIVE SUMMARY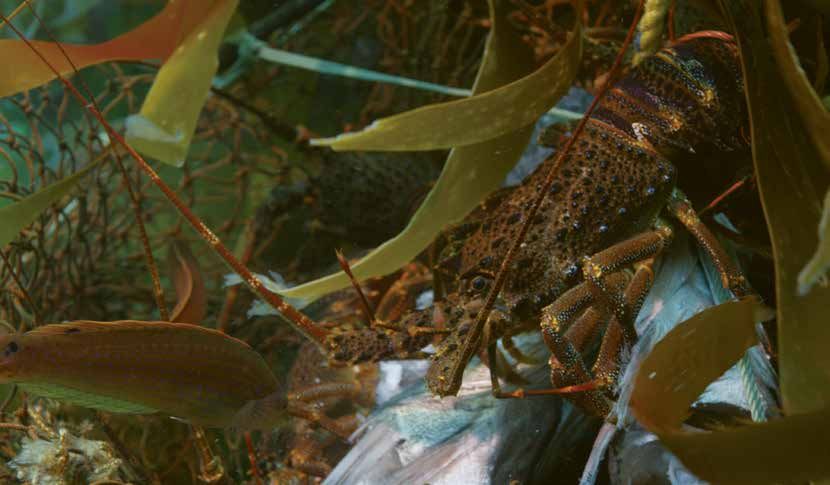
5
(Mendosoma lineatum) contributed to the differences in the biomass estimates
between island groups. The strong differences in species composition between the
northern islands and Gough drove statistically significant variation in both biomass
and density at the island scale.
Lobster (Jasus tristani) biomass and density both varied significantly among islands,
sites within island, and biomass also varied by depth. Interestingly, the density and
biomass patterns were inversely related across islands. For example, lobsters were most
numerous at Tristan and Inaccessible Islands but biomass was largest at Gough and
Nightingale. This was due to size structure differences, with larger lobsters at Gough
and Nightingale and smaller lobsters at Tristan and Inaccessible. Lobster carapace
length averaged 8.1cm at Gough compared to 6.7, 7.5 and 6.6cm at Inaccessible,
Nightingale and Tristan respectively. Several fish species including false jacopever and
five finger were also much larger at Gough than the other islands.
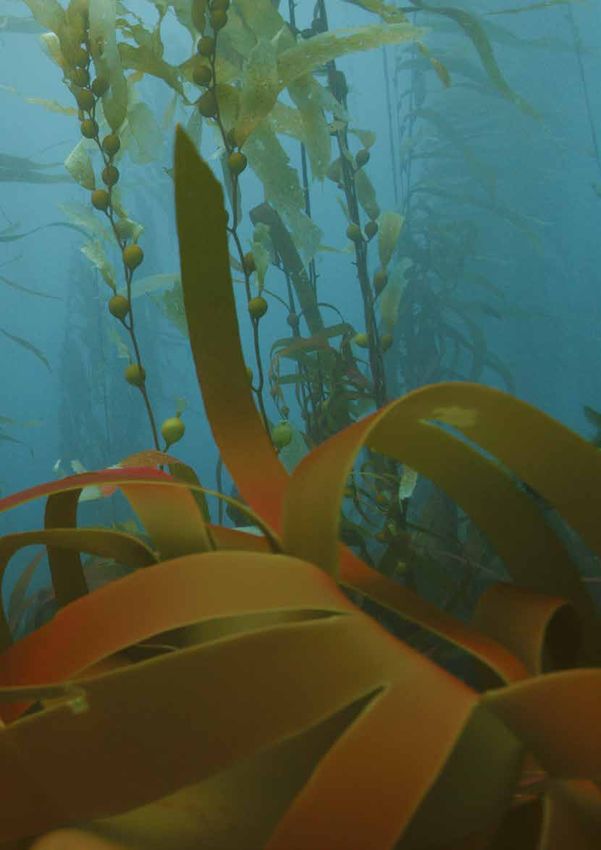
The major habitat forming species, giant kelp (Macrocystis pyrifera) was the least
variable among islands with no consistent differences in either plant or stipe density,
even between the northern islands and Gough. We did find significant site to site
variation and depth variation for kelp plant density and stipe density, however, the
range in site to site variation for kelp was less than that for fishes and invertebrates.
We found a significant effect of depth on giant kelp which was due to much greater
density of both plants and stipes at the shallow zone at Gough Island relative to the
deep zone. At the northern islands, this depth stratification was not apparent. Pale
kelp (Laminaria pallida) was the other major component of the kelp forests at Tristan
islands. Unlike giant kelp, pale kelp densities varied significantly across islands, with
this warm water tolerant species showing higher densities at the northern islands,
relative to colder Gough Island.
Kelp forest communities at the Tristan Islands are not species rich and the trophic
structure is simple compared to more diverse kelp forests in other parts of the world.
Surprisingly, we found no relationship between giant kelp (primary producer) and
urchins (grazer) but a strong inverse relationship between pale kelp and urchins.
During survey and non-survey SCUBA dives, we never observed urchins grazing or
resting on giant kelp but we did observe urchins both on the holdfasts and blades
of the pale kelp. Lobster density and biomass also showed no clear relationship with
urchins (their putative prey) or octopus (their putative predators) but did show
similarly low levels of variation among islands as giant kelp.
We surveyed the wreck site of the MV Oliva at Nightingale. Surveys took place on
natural habitat just inshore of the wreck and deeper habitat directly over much of the
structure of the wreck. In general, we saw no dramatic differences relative to other
sites at Nightingale (apart from the structure of the wreck itself). The community
structure analysis of the benthic community did distinguish this site from the other
sites but this was due to high abundance of barnacles (common on the structure of
the wreck) and pale kelp and very low abundance of giant kelp and urchins. Most of
the remaining structure is covered completely with benthic turfing and foliose algae
and pale kelp (L. pallida).
ECOSYSTEM ASSESSMENT OF THE TRISTAN DA CUNHA ISLANDS | EXPEDITION REPORT | JULY 2017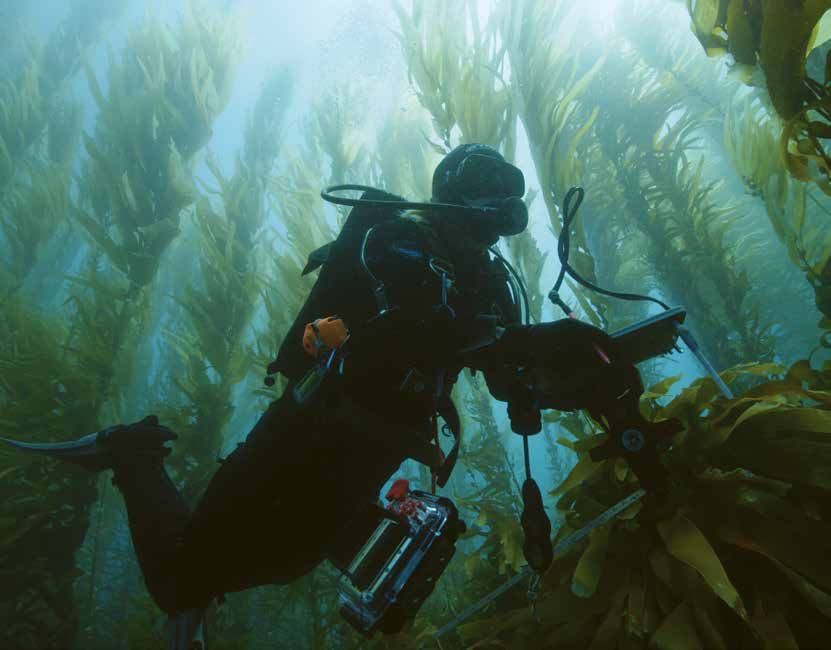
6

                    DEEP SEA

                    National Geographic deep-water drop cameras were deployed at a total of 23 sites
                    across all islands to depths ranging from 164m to 1,414m. We observed a total of
                    21 species or species groups. Common species included: bluenose (Hyperoglyphe
                    antarctica); lantern sharks (Etmopyerus sp.); bluntnose sixgill shark (Hexanchus griseus);
                    grenadiers (family Macrouridae); deepwater cod (Physiculus karrerae); and cutthroat
                    eels (Synaphobranchus sp.). Interestingly, a southern elephant seal (Mirounga leonina)
                    was observed on a camera drop at 190m depth. The benthos varied from sand/mud
                    substrate to moderate and high rock relief and the common biotic habitat forming
                    organisms included whip corals, gorgonians, sea pens and sea fans. We observed a
                    non-significant trend for higher species richness on rocky substrate and a significant
                    positive effect of rock habitat on total Nmax. We characterized drop camera stations into
                    two different depth zones (0–750m and > 750m depth) and found that the deep-water
                    fish assemblages differed significantly between the shallower and deeper strata, but
                    did not differ among islands. Communities shallower than 750m were characterized
                    by the presence of soldiers (family Sebastidae), bluefish, wreckfish (Polyprion
                    oxygeneios), small seabass (Lepidoperca coatsii) and roughy (Beryx decadactylus),
                    while communities deeper than 750m were composed of deepwater and antimora
                    cods (family Moridae), cusk eels (Ophidiidae), rattails (Macrouridae), cutthroat eels
                    (Synaphobranchus sp.), and lantern shark (Etmopyerus sp.). Species richness and total
                    Nmax did not differ between depth zones.

                    PELAGIC ZONE

                    Mid-water baited remote underwater video systems (BRUVS) were deployed at
                    27 sites across all islands at a distance of approximately 5km from shore. We recorded
                    402 individual pelagic fishes, marine mammals, birds and turtles, representing
                    14 species from 11 families. The most abundant species was a horse mackerel (Trachurus
                    sp. likely T. longimanus) with 198 individuals observed across 44.5% of sites and the
                    yellowtail amberjack (Seriola lalandi) with 69 individuals observed, although this
                    species was observed primarily in large schools and thus was only present across
                    7.4% of sites, all of which were in the northern islands. Blue sharks (Prionace glauca)
                    were observed at 55.6% of sites both in the northern group and at Gough Island, with
                    23 individuals observed. We recorded a number of very small blue sharks, at a size
                    reported for newly born individuals. We also recorded a new record for Tristan da
                    Cunha (porbeagle shark, Lamna nasus), and the first video evidence of two Shepherd’s
                    beaked whales (Tasmacetus shepherdi) off Inaccessible Island. One Shepherd’s beaked
                    whale was measured at 2.5m. This is much less than their maximum reported size of
                    7.1m, suggesting that it may be a young individual.

                    OCEANOGRAPHY

                    We measured various properties of the water column at 11 sites using a profiling CTD
                    attached to the deep-water drop cameras. As expected, temperature and salinity were
                    different at Gough relative to the northern islands; Gough waters were colder and less
                    saline. The depth at which both temperature and salinity equilibrated among islands

EXECUTIVE SUMMARY
7

was approximately 600–750m, the same depth range at which we saw a divergence in
community structure from the deep-sea drop cameras. Patterns of dissolved oxygen
were more difficult to interpret and less variable among islands.

PINNIPEDS

Research undertaken on this expedition is a continuation of a well-established and long-
term research program on the Subantarctic fur seal (Arctocephalus tropicalis) conducted
by Marthán Bester, Mia Wege and colleagues. Accomplishments on this expedition
included: collection of scats and tissues for diet analyses, deployment of satellite tags
for tracking movements of lactating females, and partial island counts. Counts of pups
at Gough island were compared to a baseline survey done in January 1978. Over the
approximately 40 year period, uncorrected pup numbers at the Tumbledown Beach area
(n = ~24 vs. 591), Buttress Rock to Dell Rocks (n = a few at most vs. 724) and the north-east
beaches north of Deep Glen (n = 0 vs. 5,199) have increased exponentially, while other
small (Seal Beach, n = 1 vs. 2) and large open beaches (Reef Point to Deep Glen, n = 0 vs. 16;
Capsize Sands, n = 0 vs. 8) have shown virtually no increases.

SHARKS

The status of sharks at Tristan da Cunha Islands is unknown. Several species have been
observed in Tristan’s offshore waters including blue sharks (Prionace glauca), shortfin
mako sharks (Isurus oxyrinchus) and hammerheads (not observed on this expedition).
For the first time in Tristan’s waters, we tagged and will track movements of blue sharks
and shortfin mako sharks in and around the archipelago and beyond. Using miniPAT
pop-up archival transmitting tags we tagged three female blue sharks at Gough Island
that ranged in size from 189 to 217cm TL. One shortfin mako shark was tagged following
the expedition and an additional four tags were left with the Tristan Fisheries and
Conservation Department heads and will be deployed near Tristan. Movement data will
be available when the tags release from the animals around mid- to late-August, 2017.

INVASIVE MARINE SPECIES

The wreck of an oil platform in 2006 on the south coast of Tristan introduced a
non-native fish, the South American silver porgy (Diplodus argenteus argenteus), that
had spread throughout Tristan Island at the time of our surveys. On this expedition, we
documented its spread to Inaccessible Island where it was present at four of the seven
sites sampled and at all depths of SCUBA surveys (from 20 to 10m). While we did not
record this species at Nightingale Island, the proximity to Tristan and Inaccessible make
it likely that the porgy will spread to that island at some point in the future. We also
performed targeted collections for diet studies using gut contents, and stable isotopes
as well as age and growth measurement. Preliminary results of analysis of gut contents
of the Porgy showed that the species is almost solely herbivorous at Tristan Island. The
only evidence of invertebrates appeared to be epiphytic organisms, likely living on the
ingested algae. We found a single larval lobster in the gut of one porgy. However, we also
sampled guts of other fish species and did find recently ingested juvenile lobsters in the
guts of both the false jacopever (Sebastes capensis) and the five finger (Nemadactylus
monodactylus). Stable isotope and age and growth studies are ongoing.

                    ECOSYSTEM ASSESSMENT OF THE TRISTAN DA CUNHA ISLANDS   |   EXPEDITION REPORT   |   JULY 2017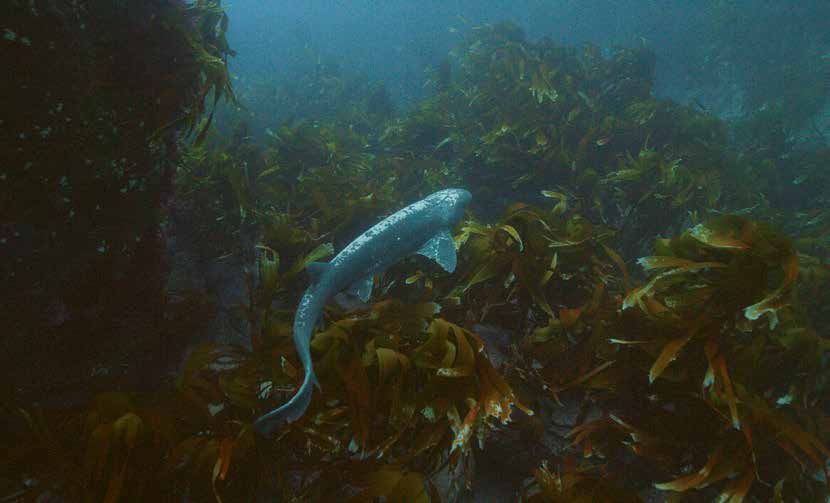
8

                    FISHING VESSELS

                    Using data from Global Fishing Watch (GFW; 2014–2016), we examined the magnitude
                    and spatial distribution of the behavior and fishing effort of industrial fishing vessels
                    in and around Tristan’s EEZ. The results reveal that up to 253 vessels from 12 different
                    nationalities transited the northern region of the EEZ; spending a total of 1495 vessel
                    days in the last three years within the EEZ. However, we see likely fishing activity on
                    only 7% of those days, mostly by vessels from the UK and Japan operating in the
                    eastern region of the EEZ. This suggest that there is little industrial fishing activity
                    inside Tristan’s EEZ, relative to the surrounding waters near seamounts to the
                    southeast and southern boundary. In these adjacent waters, we observed 62 fishing
                    vessels from eight different flag states that spent a cumulative 1,987 fishing days
                    during the entire time period.

                    MICROPLASTICS

                    Given the increasing levels of plastic pollution of the oceans it is important to better
                    understand the distribution and impact of microplastics in the ocean food web. We
                    collected seawater samples at 19 locations, slightly offshore of SCUBA survey sites.
                    Two samples were collected from the rock pools immediately adjacent to the Harbor
                    at Edinburgh of the Seven Seas (i.e. the settlement) by the students of St. Mary’s
                    school. Microplastics were found in 15 of the 19 samples. The number of microplastic
                    pieces per liter of water ranged from 0 to 2.3 (overall mean 0.83 pieces/L).

                    SUMMARY AND RECOMMENDATIONS
                    Tristan da Cunha Islands are a unique archipelago with healthy marine ecosystems —
                    although with low species diversity, likely due to extreme isolation. This remote
                    temperate archipelago provides one of the few places in the world to establish a
                    baseline for unimpacted temperate systems. Quantitative data from the kelp forests
                    was lacking while pelagic habitat and deep benthos were mostly unexplored prior to
                    this expedition. We found that, despite an important commercial fishery for lobster and
                    subsistence fishing for local islanders, marine habitats and biota appeared in very good
                    condition. Biomass of fishes and lobster in particular were high. However, this unique
                    marine ecosystem is not without potential threats: shipping traffic leading to wrecks
                    and species introductions, pressure to increase fishing effort beyond sustainable levels
                    and climate change all could potentially increase in the coming years. Currently, the low
                    population density, difficult access to the marine environment and a proactive, well-
                    managed lobster fishery provide a level of protection to nearshore habitats. However,
                    offshore areas including seamounts would benefit from strong, enduring protection.

                    Specific recommendations include:

                    Due to Tristan’s location in the South Atlantic Ocean, its EEZ includes a range of unique
                    oceanographic features:
                    n
                        To ensure a comprehensive protection regime, we recommend the creation of
                        strongly protected marine reserves in both the northern and southern portions of the
                        EEZ/MPA.

EXECUTIVE SUMMARY
9
n
We recommend the highest level of protection practicable for as many seamounts
as possible throughout the EEZ, again making sure to include both northern and
southern regions.
The nearshore waters of Tristan’s Islands are healthy and sustain a well-managed
lobster fishery with some take of finfish by local islanders for consumption and bait.
n
Existing protection (from shore to 50nm) should be credited when designing
additional protection schemes for Tristan and this area should remain permanently
closed to foreign non-lobster vessels.
n
We recommend that no additional spatial closures for lobster are needed as long as
the fishery remains well managed (e.g. maintaining MSC certification). Monitoring
and research on the fishery should continue.
n
If nearshore spatial closures for finfish and other non-lobster resources are considered,
due to low variation in habitat, they could be located in most locations around the
islands and achieve similar protection of the habitat.
n
Tristan Islands currently have a large amount of de facto protection, both temporally
and spatially, but this could change with increased vessel capability or improved
weather condition. We recommend a process be developed for regular assessment
of access to fishing sites from Tristan islanders and non-locals.
n
Future impacts from climate change and human pressure are increasing globally and
might pose unanticipated challenges for Tristan’s ecosystems and fishery.
n
Future ocean warming and associated declines in productivity may affect nearshore
ecosystems and fisheries. We recommend continued monitoring of temperature (in
situ and remote sensing) combined with predictive modeling of climate change.
n
Low levels of biological diversity in nearshore areas result in a simple, short-chain
food web with very few key interacting species, making this system very sensitive
to perturbations. We recommend future studies be conducted on predicting climate
change effects for this region (from global models) at least for populations of the key
species (giant kelp, lobsters, urchins), and major drivers (productivity, sea and land
temperature, changes in storm frequency).
n
Despite a documented expansion of the non-indigenous silver porgy (Diplodus
argenteus) to Inaccessible Island from Tristan island, we found low density at most
sites. Considering the density and the dietary habits (herbivory) of this species, we
recommend that the populations continue to be tracked, but we would not prioritize
active removal efforts at this time.
n
Redistribution of species is one predicted effect of climate change. We recommend
ongoing monitoring of species distributions and careful attention to the potential for
development of new fisheries.
ECOSYSTEM ASSESSMENT OF THE TRISTAN DA CUNHA ISLANDS | EXPEDITION REPORT | JULY 2017INTRODUCTION
11

INTRODUCTION

Tristan da Cunha is a group of islands in the South Atlantic, and
also the name of the main island in that group. The archipelago
lies over 2,700km from South Africa and 3,700km from the
nearest shores of South America. The island of Saint Helena is
the closest land, 2,400km to the north. This makes the Tristan
archipelago one of the most geographically isolated island
groups in the world. The northern group (37°04’S, 12°18’W) is
composed of Tristan da Cunha, Inaccessible and Nightingale
Islands. Inaccessible and Nightingale lie approximately 30km
to the southwest and south of Tristan da Cunha respectively
(Figure 1). The southernmost and most isolated island, Gough
(40°19’S, 9°57’W), lies 380km to the south-southeast. Politically,
the United Kingdom Overseas Territory of Tristan da Cunha is
administered under the governorship of Saint Helena by a
UK-appointed Administrator, and has an elected Island Council.

             ECOSYSTEM ASSESSMENT OF THE TRISTAN DA CUNHA ISLANDS   |   EXPEDITION REPORT   |   JULY 2017
12
15°0'0"W 10°0'0"W
FIGURE 1.
Map showing
35°0'0"S
35°0'0"S
location of Tristan
da Cunha islands
in the south
Atlantic. EEZ
is shown and
seamounts
within the EEZ.
40°0'0"S
40°0'0"S
Depth
0 5000m
50 nautical mile
no fishing zone
200 nautical mile
exclusive economic zone
Bathymetry data from GeoMapp App
www.geomapapp.org
15°0'0"W 10°0'0"W
The Tristan group and Gough are volcanic islands formed from the outer slopes
of the Mid-Atlantic Ridge (Heydorn and Lutjeharms 1980) and range in age from
200,000 years (Tristan) to around 18 million years (Nightingale) (Baker et al. 1962,
Scott 2016). Tristan da Cunha Island is a near perfectly circular volcanic cone that rises
abruptly from the Atlantic Ocean (with eruptions recorded as recently as 2004). The
island is 12km in diameter at its widest point and over 2,060m at its highest peak, the
summit of Queen Mary’s Peak. A narrow coastal plain in the northwest of the island
provides approximately 6km2 of flat land. The population of 270 Tristanians live in a
single settlement, ‘Edinburgh of the Seven Seas’, making Tristan da Cunha arguably
the most remote inhabited island in the world.
The wide spaces between the islands in the group give Tristan da Cunha a very large
Exclusive Economic Zone (EEZ) of approx. 754,000km2, which includes a broad range
of oceanographic features and offshore habitats, such as seamounts (Figure 1). The
seabed around the islands is steeply sloping, reaching depths of more than 2,000m
in less than a few kilometers from the coastline. Consequently, the majority of the
seafloor within the EEZ is significantly deeper than 300m. The EEZ contains a number
of seamounts including McNish, RSA, Crawford and the recently discovered Esk Guyot.
Some of these rise to as shallow as 143m below sea surface. The Tristan Islands are
located roughly at the boundary between the Southern ocean and the South Atlantic
and sit at the confluence of two major ocean currents. The northern group (Tristan,
Inaccessible and Nightingale) sits north of the Subtropical Front (STF) or convergence
which is characterized by sharp differences in sea temperature and salinity (Doolittle
et al. 2008). Gough sits on or below this front. Consequently, Gough Island sea surface
temperature (SST) is on average 3–4°C colder than the northern islands and likely
experiences enhanced nutrient availability. While the exact position and width of the
INTRODUCTION13
STF varies (Deacon 1982, Doolittle et al. 2008), these types of ‘fronts’ are locations
of enhanced productivity (Lutjeharms et al. 1985, Laubscher et al. 1993) and often are
hotspots for marine organisms such as sharks, pinnipeds, cetaceans, and seabirds due
to aggregations of prey species (Etnoyer et al. 2004, Bakun 2006, Weng et al. 2008,
Bost et al. 2009, Raymond et al. 2010, Block et al. 2011, Robinson et al. 2012, Queiroz
et al. 2016). Fishery species also tend to aggregate at fronts (Polovina et al. 2001,
Zainuddin et al. 2006), increasing the probability of direct (bycatch, entanglement)
and indirect (competition for prey) negative interactions between fisheries and marine
megafauna and seabirds (reviewed in Scales et al. 2014).
The Tristan archipelago is a hotspot of endemic biodiversity primarily in terrestrial
systems and to a lesser extent in marine systems (although this may increase with further
study and species identification (Scott and Holt in prep). The degree of endemism varies
greatly among taxonomic groups, with marine algae showing the highest diversity
(over 120 species present at the top islands) and the highest levels of endemism (Scott
2016). Other marine groups such as fishes, crustaceans and echinoderms are much less
diverse, which is a common pattern on isolated islands. The Tristan rock lobster (Jasus
tristani) is the most valuable commercial species, and is the target of an MSC-certified
sustainable lobster fishery that provides over 80% of the island’s GDP, employs over a
quarter of the population at peak times, and provides an essential source of human and
cargo transportation via fishing boats travelling to and from South Africa (see Fisheries
below). The nearshore kelp forests (Macrocystis pyrifera, Laminaria pallida) that provide
critical habitat for lobster and other species are of particular interest, especially as the
northern group of islands experience summer temperatures that are near the limits of
thermal tolerance for Macrocystis (Tegner et al. 1996, Steneck et al. 2002, Valdez et al.
2003). Offshore waters are also home to a number of pinnipeds, sharks and cetaceans
(Bester 1990, Andrew et al. 1995, Best et al. 2009). Blue sharks (Prionace glauca) and
shortfin mako sharks (Isurus oxyrinchus) are commonly observed in offshore waters
while Broadnose sevengill sharks (Notorynchus cepedianus) inhabit the nearshore kelp
forests (Andrew et al. 1995). Large and increasing numbers of Subantarctic fur seal
Arctocephalus tropicalis breed at the islands and a very small southern elephant seal
(Mirounga leonina) population exists at their only known breeding location at Gough
Island (Bester et al. 2006 , Bester and Ryan 2007). Offshore waters also support
populations of dusky dolphins (Lagenorhynchus obscurus), the rare Shepherd's beaked
whale (Tasmacetus shepherdi), and are also known to be a nursery area for southern
right whales (Eubalaena australis), (Best et al. 2009).
The terrestrial environment is home to seven endemic land bird species. It also
provides key breeding sites for a large number of seabirds including three species
of albatross (Andrew and Ryan 2007). The islands are also home to many species of
endemic plants and invertebrates (Ryan 2007). Two of the endemic bird species, the
Tristan albatross and the Gough bunting, are classified as Critically Endangered and
small populations of several other species make them imperiled as well. Terrestrial
biodiversity surveys (transects) were done by Mike Fay as part of the Pristine Seas
expedition and are covered in a separate report (Fay 2017).
ECOSYSTEM ASSESSMENT OF THE TRISTAN DA CUNHA ISLANDS | EXPEDITION REPORT | JULY 201714
There are three fisheries at Tristan da Cunha: a MSC certified lobster fishery, a longline
and trawl fishery for bottom fish such as bluefish, and a pelagic longline fishery for
southern Bluefin tuna. The lobster fishery is the mainstay of the Tristan economy, while
the other fisheries are limited in scope and conducted solely by foreign vessels via
permits from the Tristan government. The lobster fishery is the only inshore fishery and
provides 70–90% of the island’s income, essential for economic independence for the
islands. A variety of traps are used in the lobster fishery, ranging in size and materials
from smaller hoop nets to large, steel framed “monster” traps (Glass 2014, Scott 2016).
Total allowable catches (TAC) are set annually, are generally precautionary and at
least in recent years have rarely been exceeded. Catch rate (CPUE) and size structure
are measured annually but long term interpretation of data has been challenging
because of many changes in gear types, vessel capabilities and seasonal changes over
time. Recent catches average approximately 371 tons annually. The lobster fishery is
licensed to a single company, Ovenstone Agencies, under a long-term concession.
This unique situation gives a large amount of local control and oversight, in part
resulting in MSC certification. Lobsters are processed onshore in a modern factory
and shipped to buyers primarily in Japan and the US, although markets in Australia
and Europe are emerging. Details on the regulations and current fishery can be found
in Best et al. (2009), MacAlister Elliott and Partners Ltd. (2011), and Scott (2016). The
pelagic longline fishery for southern bluefin tuna (SBT) is currently allocated to a
single vessel in Tristan’s EEZ. Southern bluefin tuna are managed as a single stock and
while catches in Tristan’s waters will count against the CCSBT limits of this critically
endangered species (Collette et al. 2011), they are likely to be low and thus unlikely to
have significant effects on the global conservation status of SBT. However, catches of
SBT in Tristan’s EEZ might affect local economics and may also have harmful bycatch
effects (long-lines are known to catch sharks and seabirds — Brothers 1991, Francis et
al. 2001, Anderson et al. 2011, Gallagher et al. 2014), Thus, fishing for SBT in Tristan’s
EEZ is unlikely to have significant effects on the global conservation status of SBT,
but may have serious negative consequences for other Tristan species that rely on
longline-free waters.
Both Gough and Inaccessible Islands have been given UNESCO World Heritage Site
status for their near-pristine environments and vast wildlife populations. While all of
the Tristan Islands ecosystems appear relatively intact and healthy, there are numerous
threats, some urgent and some emerging. On both land and in the water, non-native
and invasive species are of primary concern for these isolated islands. Mice and rats
are a serious and urgent concern (Angel and Cooper 2006, Brown 2007). Plans are
underway to conduct an eradication of mice on Gough Island (Tristan da Cunha
Government and RSPB 2012) where the only substantial breeding population of the
critically endangered Tristan albatross currently exists and is severely threatened by
mouse predation on chicks. In the marine environment, the recent groundings of an oil
rig in 2006 and a cargo ship in 2011 brought numerous non-native marine species as well
as damage from spilled fuel. In particular, the oil rig stranding led to the introduction
of a non-native fish, the South American silver porgy (Diplodus argenteus argenteus),
that has become established around Tristan da Cunha. The cargo ship dumped
INTRODUCTION15
1,500 tons of heavy fuel into the water (along with 65,000 tons of soy cargo), killing over
3,000 rockhopper penguins (Scott 2016). The spill also closed the essential lobster
fishery for the 2011/12 season and forced a reduction in the Total Allowable Catch (TAC)
at Nightingale for that year. Increases in shipping traffic around the islands threaten
the native ecosystems in the future. Legal and illegal longline fishing even outside
of Tristan’s EEZ threatens more mobile animals such as seabirds and sharks. Recent
work has shown high overlap in space use of pelagic sharks and the longline fleet in
the North Atlantic and it is likely that the South Atlantic shows similar patterns. There
is also a high level of spatial overlap in foraging of the critically endangered Tristan
albatross and longline fisheries, potentially causing substantial mortality (Cuthbert et
al. 2005). Future threats include development of additional fisheries, both inshore and
at the seamounts. Little is known about these habitats and the organisms occupying
them, and any development of new fisheries must proceed with caution because
seamounts are hotspots for pelagic species of conservation concern that can interact
with fisheries (Worm et al. 2003, Morato et al. 2010), and seamount habitats and
associated fishery species are highly vulnerable to degradation from fishing (Morato
et al. 2006, Clark and Koslow 2007). Finally, climate change is the ultimate stressor
on marine and terrestrial ecosystems with largely unpredictable effects in relatively
unstudied systems such as Tristan da Cunha.
For a complete review of the physical setting, ecology, biology and conservation
threats for the Tristan da Cunha archipelago, see Scott (2016).
ECOSYSTEM ASSESSMENT OF THE TRISTAN DA CUNHA ISLANDS | EXPEDITION REPORT | JULY 2017OBJECTIVES
17

OBJECTIVES

The primary scientific goals of the National Geographic Pristine
Seas project are to explore, document and protect the last wild
places in the ocean. It is essential that we let the world know that
these places exist, that they are threatened, and that they deserve
to be protected. To this end, National Geographic Pristine Seas,
in collaboration with the Royal Society for the Protection of Birds
(RSPB) and the Tristan da Cunha Government (including the
Fisheries and Conservation Departments) conducted a 21-day
expedition to Tristan da Cunha, Nightingale, Inaccessible and
Gough Islands in January–February 2017. Primary scientific goals
of the expedition were to conduct comprehensive quantitative
surveys of the health of the archipelago’s largely unknown
marine environment, and to assist the Government and people
of Tristan da Cunha in planning for marine protection.

              ECOSYSTEM ASSESSMENT OF THE TRISTAN DA CUNHA ISLANDS   |   EXPEDITION REPORT   |   JULY 2017
18
The core scientific research included:
n
quantitative surveys of shallow flora and fauna using scuba diving surveys,
n
documentation of pelagic (open ocean) communities using baited stereo-cameras,
n
documentation of deep-sea habitats using specially built deep-water drop cameras,
n
movement studies on sharks, birds and seals using satellite transmitters,
n
basic ecological studies (e.g. food habits, growth) on key species in the
marine ecosystems,
n
documentation of the spatial spread and ecological function of a recently
colonized, non-native fish species,
n
documentation of the presence/absence of microplastics in the water,
n
evaluation of the status of pinniped populations at the islands including
quantitative surveys, and assessment of diet and condition.
The results of the expedition highlight the unique marine ecosystem of this archipelago,
particularly the pelagic and deep-sea environments, which are virtually unstudied
and documented scientifically, yet potentially impacted by shipping, fishing, climate
change and other stressors. Strong partnership with the Tristan Island Conservation
and Fisheries departments and Royal Society for the Protection of Birds (RSPB) will
ensure ongoing communication and collaboration into the future. The work presented
here is meant to complement ongoing research at Tristan da Cunha and provide a
springboard to help inform the Tristan Government about potential protection schemes
that protect both important fisheries and unique biodiversity of the archipelago. The
intent of these results is to provide a scientific baseline to underpin further research
that can help inform Tristan's future marine protection.
OBJECTIVES19
Expedition Partners:
n
Tristan da Cunha Fisheries & Tristan da Cunha Conservation Departments
n
Royal Society for the Protection of Birds (RSPB)
n
The University of California, Santa Barbara (UCSB)
n
Centre for Marine Futures, University of Western Australia (UWA)
n
Moss Landing Marine Laboratories (MLML)
n
Mammal Research Institute, University of Pretoria (UP)
ECOSYSTEM ASSESSMENT OF THE TRISTAN DA CUNHA ISLANDS | EXPEDITION REPORT | JULY 2017RESULTS
21

RESULTS

Nearshore Kelp Forest Scuba Surveys

DIVERSITY AND HABITAT
In general, the Tristan da Cunha Islands have very low faunal biodiversity (species
richness) in nearshore marine habitats, likely due to extreme isolation and lack of any
island stepping-stones with appropriate habitat between the islands and any continental
landmass. Taxonomic diversity and regional and global affiliations are currently being
investigated through Darwin Initiative projects (Scott 2016). Consequently, we focused
our quantitative surveys on the more abundant, conspicuous and strongly interacting
members of the kelp forest communities, focusing particularly on lobsters and any
organisms that might interact with lobsters.

These islands lack broad diversity in habitat types, with most nearshore areas
comprised of high relief, boulder reefs covered in kelps or sandy areas between
the boulder reefs. Prior to the expedition, we utilized LANDSAT imagery to create
predictive maps of canopy forming giant kelp (see methods) around all four islands
(Figure 2). These maps helped us to identify locations for sampling which were
chosen both on the presence of kelp canopy and a roughly even distribution around
each island (Figure 3).

Detailed methods for SCUBA surveys can be found at the end of this report. Briefly, we
used standardized methods adapted from the Partnership for Interdisciplinary Studies
of Coastal Oceans (PISCO; www.piscoweb.org). At each site four divers counted
and estimated sizes for all fish species and the lobster (J. tristani) on four transects
across two depth zones (10 and 20m). Conspicuous invertebrates and kelps were also
counted and benthic substrate type and physical relief were measured.

                  ECOSYSTEM ASSESSMENT OF THE TRISTAN DA CUNHA ISLANDS   |   EXPEDITION REPORT   |   JULY 2017
22
FIGURE 2.
A B
Predicted kelp
distributions for
(A) Tristan,
(B) Inaccessible,
(C) Nightingale, and
(D) Gough islands.
Green polygons
represent kelp
canopy observed
from Landsat 7 or
Landsat 8 images
or predicted kelp
occurrence based
C D
on other high
resolution imagery
or features seen in
Landsat images.
Data source:
Tom Bell, UC
Santa Barbara.
FIGURE 3. 12°40'0"W 12°30'0"W 12°20'0"W 12°10'0"W
Map of the study Sampling Locations
region depicting
Nearshore SCUBA Surveys Tristan
the locations of
scuba surveys Pelagic Cameras
(n = 34), pelagic Deep-water Drop Cameras
37°10'0"S
37°10'0"S
camera surveys
(n = 26), and deep
sea benthic camera
surveys (n = 23) in
the four islands of Inaccessible
the Tristan da Cunha
Islands group.
37°20'0"S
37°20'0"S
Gough
Nightingale
12°40'0"W 12°30'0"W 12°20'0"W 12°10'0"W
RESULTS23
We targeted kelp-dominated boulder reefs for our surveys and even within this habitat
type, there was very little variation in substrate type or physical relief (Figure 4) among
islands. Inaccessible Island differed slightly from the other islands in the percent
cover of small boulder (40% vs. 14%, 16% and 17% for Tristan, Nightingale and Gough)
versus large boulder/bedrock (52% vs. 70%, 80% and 77% for Tristan, Nightingale and
Gough). Only Tristan had appreciable cover of sand (6% vs. 4%, 3% and 1% for Gough,
Inaccessible and Nightingale) but this was largely driven by a single site that had
discontinuous reef. At all islands, the sand category of substrate was composed of
relatively large grain, and volcanic sediment and patches of sand were small. Physical
habitat relief was also similar among islands. Again, Inaccessible differed slightly from
the other islands in having lower relief (74% Slight, 22% Mod and 4% High vs. 40–56%
Slight, 22–31% Mod and 17–33% High for the other islands). Only Tristan had any flat
relief, corresponding to the sand measured at the single sandy site surveyed.
A. Substrate
FIGURE 4.
100
Substrate Sand
composition and Cobble
physical relief 80 Boulder
PERCENT FREQUENCY
estimated using Bedrock
visual SCUBA 60
surveys in nearshore
kelp forests (10 and
40
20m depth) in the
Tristan da Cunha
Islands. Shown 20
are the percent
cover of (A) four 0
different substrate Gough Inaccessible Nightingale Tristan
categories and
(B) vertical relief
in four different
relief categories. B. Physical Relief
100 >2m
1–2m
80 10cm–1m
PERCENT FREQUENCY
0–10cm
60
40
20
0
Gough Inaccessible Nightingale Tristan
ISLAND
ECOSYSTEM ASSESSMENT OF THE TRISTAN DA CUNHA ISLANDS | EXPEDITION REPORT | JULY 201724
FISH DENSITY AND BIOMASS
TOTAL
Mean fish biomass (tonnes/ha) and density (no./100m2) for all observed fish species
at each island are listed in Table 1A, B and shown in Figure 5A, B. Average total fish
biomass ranged between 1.5–2.75 tonnes per hectare. Five finger (Nemadactylus
monodactylus) were dominant both numerically and in terms of biomass at all four
islands. Interisland differences in biomass were driven by yellowtail (S. lalandi) which
were abundant at the northern islands but absent at Gough. At Gough, where most
fish were larger on average, false jacopever (Sebastes capensis) and telescope fish
(Mendosoma lineatum) contributed to the differences in the biomass estimates
between island groups. The most numerically abundant fish species at the northern
islands was the endemic Tristan wrasse (Suezichthys ornatus), with higher densities
than the five finger at most sites. At Gough, telescope fish were the numerically
dominant species, often found in large schools of juvenile sized fishes.
FIGURE 5. A. Fish Biomass
A. Fish Biomass
Stacked bar Yellowtail
plots depicting 3.5 Invasive porgy
FISH BIOMASS (TONNES HA -1 )
Yellowtail
fish biomass and Soldier
3.5 Invasive porgy
FISH BIOMASS (TONNES HA -1 )
density patterns in Klipfish
Soldier
2.5
nearshore habitats Telescope fish
Klipfish
of the Tristan da 2.5 False jacopever
Telescope fish
Cunha Islands from Tristan wrasse
False jacopever
1.5
SCUBA surveys. Five finger
Tristan wrasse
Shown are the 1.5
Five finger
island-level mean
0.5
(A) fish biomass
(tonnes ha ) and
-1 0.5
Gough Inaccessible Nightingale Tristan
(B) fish density
(no. m-2) for each Gough Inaccessible Nightingale Tristan
species observed.
Error bars are ± 1
B. Fish Density
standard error of
the mean for the 250 B. Fish Density
total fish biomass
FISH DENSITY (NO. 100M -2 )
250
or total fish density 200
FISH DENSITY (NO. 100M -2 )
respectively.
200
150
150
100
100
50
50
0
Gough Inaccessible Nightingale Tristan
0
Gough Inaccessible Nightingale Tristan
ISLAND
ISLAND
RESULTS25
TABLE 1.
Species
Biomass (tonnes A. Fish Biomass Gough Inaccessible Nightingale Tristan
ha-1) and density
Total fish biomass 1.95 ± 0.18 1.50 ± 0.27 2.75 ± 1.05 1.46 ± 0.29
(no. 100m2) of fish,
conspicuous benthic Five finger
1.1 ± 0.10 0.56 ± 0.18 0.99 ± 0.32 0.69 ± 0.12
invertebrates, and (Nemadactylus monodactylus)
kelps observed on
Tristan Wrasse (Suezichthys ornatus) 0.02 ± 0.008 0.33 ± 0.05 0.15 ± 0.07 0.21 ± 0.04
SCUBA surveys at
10 and 20m depth False Jacopever (Sebastes capensis) 0.55 ± 0.05 0.063 ± 0.02 0.071 ± 0.02 0.024 ± 0.005
in the Tristan da
Telescope fish (Mendosoma lineatum) 0.30 ± 0.07 0.06 ± 0.03 0.018 ± 0.01 0.005 ± 0.002
Cunha Islands.
Values are means Klipfish (Bovichtus diacanthus) 0.018 ± 0.003 0.0001 ± 1e-4 0.0003 ± 2e-4 0±0
± 1 standard error
Soldier (Helicolenus mouchezi) 0.002 ± 0.002 0.01 ± 0.01 0±0 0±0
of the mean for
each island. Invasive porgy (Diplodus argenteus) 0±0 0.009 ± 0.006 0±0 0.036 ± 0.01
Yellowtail (Seriola lalandi) 0±0 0.46 ± 0.24 1.52 ± 0.74 0.51 ± 0.28
B. Fish Density Gough Inaccessible Nightingale Tristan
Total fish density 164.5 ± 16.6 201. 1 ± 15.9 124. 4 ± 36.4 138.0 ± 21.0
Five finger
39.1 ± 4.0 42.0 ± 12.4 65.6 ± 18.2 52.0 ± 7.6
(Nemadactylus monodactylus)
Tristan Wrasse (Suezichthys ornatus) 1.5 ± 0.4 146.1 ± 25.4 49.4 ± 19.7 75.4 ± 16.3
False Jacopever (Sebastes capensis) 18.9 ± 1.9 6.3 ± 1.3 7.0 ± 1.3 2.6 ± 0.5
Telescope fish (Mendosoma lineatum) 101.1 ± 16.0 4.7 ± 2.9 1.1 ± 0.7 0.4 ± 0.2
Klipfish (Bovichtus diacanthus) 3.9 ± 0.5 0.1 ± 0.1 0.1 ± 0.08 0±0
Soldier (Helicolenus mouchezi) 0.04 ± 0.04 0.12 ± 0.12 0±0 0±0
Invasive porgy (Diplodus argenteus) 0±0 1.3 ± 1.0 0±0 7.1 ± 3.5
Yellowtail (Seriola lalandi) 0±0 0.5 ± 0.2 1.2 ± 0.6 0.5 ± 0.2
C. Benthic species density and biomass Gough Inaccessible Nightingale Tristan
Giant kelp (Macrocystis pyrifera) 53.9 ± 10.1 53.8 ± 12.6 44.7 ± 15.6 49.1 ± 14.4
Giant kelp stipes 265.6 ± 29.8 279.5 ± 67.2 354.3 ± 117.5 262.9 ± 64.5
Pale kelp (Laminaria pallida) 235.9 ± 24.1 388.8 ± 56.1 511.8 ± 147.0 533.6 ± 109.4
Lobster biomass (Jasus tristani) 0.15 ± 0.022 0.11 ± 0.019 0.13 ± 0.014 0.085 ± 0.012
Lobster density 6.4 ± 0.8 8.6 ± 1.2 7.2 ± 1.3 8.8 ± 1.3
Sea urchin (Arbacia dufresnii) 389.4 ± 62.7 119.5 ± 25.4 60.1 ± 25.2 23.2 ± 7.2
Pink urchin (Pseudechinus magellanicus) 8.0 ± 4.1 0±0 0±0 0±0
Sea star (Henricia simplex) 8.2 ± 1.3 6.1 ± 0.9 7.7 ± 4.5 12.6 ± 1.9
Sea star (Odontaster penicillatus) 0.54 ± 0.2 0±0 0±0 0±0
Common octopus (Octopus vulgaris) 0.25 ± 0.09 0.47 ± 0.2 0.41 ± 0.2 0.13 ± 0.06
Barnacle (Austromegabalanus sp.)* 0.41 ± 0.42 0.12 ± 0.11 12.5 ± 12.4 0±0
*Barnacles were recorded at high densities at the site of the Oliva cargo shipwreck, accounting for the high density
average at Nightingale island. At natural reefs the density was low.
ECOSYSTEM ASSESSMENT OF THE TRISTAN DA CUNHA ISLANDS | EXPEDITION REPORT | JULY 201726
ANOVA revealed significant variation among islands and sites nested within islands
for total fish biomass (Table 2; Figure 6A). There was no effect of depth zone on total
biomass (Table 2). Inaccessible showed the least variation in total fish biomass
among sites (ranging from 0.7 to 2.3mt/ha). Nightingale had the greatest site to site
variation in total fish biomass (ranging from 1.0 to 8.8mt/ha) due to very high biomass
(primarily of Yellowtail) at a site located on Stoltenhoff Island, slightly offshore of the
main island (Figure 6A).
Total fish density showed less variation overall compared to total fish biomass, but
the effects of island, site (within island) and depth zone (nested within island and
site) were all significant (Table 3; Figure 6B). Inaccessible showed the least variation
among sites (ranging from 138.8 to 261.3 fish/100m2) while Nightingale showed the
most variation in density among sites (54.2 to 333.3) again, largely driven by a single
site on Stoltenhoff Island (Figure 6B). Total fish density was greater on the deep zone
transects (mean 190.1 ± 14.3 SE) than the shallow zone transects (121.1 ± 11.3 SE).
TABLE 2. Model r2 Factors df F-ratio P-value
Nested analysis of
A. Total fish biomass 0.61 Island 3, 68 2.91 0.041
variance (ANOVA)
testing the effects Site [Island] 30, 68 2.18 0.0041
of island, site, and Zone [Site, Island] 34, 68 0.97 0.53
depth zone on
patterns of fish B. Five finger biomass 0.84 Island 3, 68 12.3527
FIGURE 6. A. Fish Biomass
Bubble plots Biomass
(tonnes per ha)
depicting site-level
variation in fish 0.5–0.9
biomass, density, 0.9–1.3
and species Inaccessible Tristan
1.3–2.5
composition of
kelp forest fish 2.5–3.5
communities in
the four Tristan
3.5–8.8
da Cunha Islands.
Shown are plots of
(A) fish biomass A. Fish Biomass
and (B) fish
Gough Yellowtail
density. Bubble
size scales with the 3.5 Invasive porgy
FISH BIOMASS (TONNES HA -1 )
biomass or density Soldier
Nightingale
estimated using Klipfish
2.5 Telescope fish
site-level means of
SCUBA surveys. False jacopever
Tristan wrasse
1.5
Five finger
B. Fish Density
0.5
Density
(no. per 100m2)
Gough Inaccessible Nightingale Tristan
55–90
90–120
Inaccessible Tristan 120–170
B. Fish Density
170–230
250
230–335
FISH DENSITY (NO. 100M -2 )
200
150
100
Gough
50
Nightingale
0
Gough Inaccessible Nightingale Tristan
ISLAND
ECOSYSTEM ASSESSMENT OF THE TRISTAN DA CUNHA ISLANDS | EXPEDITION REPORT | JULY 201728
TABLE 3. Model r2 Factors df F-ratio P-value
Nested analysis of
A. Total fish density 0.79 Island 3, 68 6.48 0.0006
variance (ANOVA)
Site [Island] 30, 68 3.3629
INVERTEBRATE AND MACROALGAE
BIOMASS AND DENSITY
LOBSTERS
Lobster (Jasus tristani) biomass and density both varied significantly among islands, sites
within island, and biomass also varied by depth zone (Table 1, 4; Figure 8A). Interestingly,
the density and biomass patterns were inversely related across islands (Figure 7A,
B). For example, lobsters were most numerous at Tristan and Inaccessible Islands but
biomass was largest at Gough and Nightingale. This was due to size structure differences
(see below section), with larger lobsters at Gough and Nightingale and smaller lobsters
at Tristan and Inaccessible. The variation in biomass among sites within islands was
smallest at Nightingale (mean site biomass ranged from 0.10 to 0.21mt/ha) and was
largest at Gough (mean site biomass 0.07 to 0.31mt/ha). There were no strong patterns
with depth (despite a marginally significant effect of zone on biomass, Table 4).
TABLE 4. Model r2 Factors df F-ratio P-value
Nested analysis of A. Lobster biomass 0.67 Island 3, 68 5.93 0.0012
variance (ANOVA)
Site [Island] 30, 68 2.01 0.0094
testing the effects
of island, site, Zone [Site, Island] 34, 68 1.65 0.043
and depth zone
B. Lobster density 0.70 Island 3, 68 3.23 0.028
on patterns of
invertebrate Site [Island] 30, 68 3.1930
12 A. Lobster Density 0.20 B. Lobster Biomass
FIGURE 7.
DENSITY (NO. PER 100 M 2 )
BIOMASS (TONNES HA -1 )
10
Bar plots depicting 0.15
8
island-level
variation in lobster 6 0.10
biomass and the 4
0.05
density of common
2
invertebrates and
0 0.00
macroalgae in the
Tristan da Cunha Gough Inaccessible Nightingale Tristan Gough Inaccessible Nightingale Tristan
Islands from SCUBA
80
surveys of nearshore C. Giant Kelp Stipe Density D. Giant Kelp Plant Density
DENSITY (NO. PER 100 M 2 )
500
DENSITY (NO. PER 100 M 2 )
70
habitats. Shown
400 60
are mean values
50
for each species 300
40
± 1 standard error
200 30
of the mean. 20
Urchins are all 100
10
Arbacia dufresnii. 0 0
Gough Inaccessible Nightingale Tristan Gough Inaccessible Nightingale Tristan
E. Sea Urchin Density 700 F. Pale Kelp Density
DENSITY (NO. PER 100 M 2 )
DENSITY (NO. PER 100 M 2 )
500
600
400 500
300 400
300
200
200
100
100
0 0
Gough Inaccessible Nightingale Tristan Gough Inaccessible Nightingale Tristan
0.8 G. Octopus Density 0.8 H. Henricia Sea Star Density
DENSITY (NO. PER 100 M 2 )
DENSITY (NO. PER 100 M 2 )
0.7 0.7
0.6 0.6
0.5 0.5
0.4 0.4
0.3 0.3
0.2 0.2
0.1 0.1
0.0 0.0
Gough Inaccessible Nightingale Tristan Gough Inaccessible Nightingale Tristan
ISLAND ISLAND
OTHER BENTHIC INVERTEBRATES
Densities of all surveyed invertebrates (lobsters, urchins, seastars, octopus, and
barnacles) are given in Table 1C. Many of these species were not abundant so we
performed ANOVA on a subset of them (Sea urchin [Henricia spp.], seastars and
Octopus; Table 4). For Henricia spp. and octopus densities, there was significant
variation among islands, sites within island and depth zones (Table 4C, D, E). For
these two species, we did not observe consistent differences between the northern
island group and Gough. Sea urchins also varied significantly among islands and sites
but there was no effect of depth (Table 4; Figure 7E). Urchin density was highest at
Gough and lower at Inaccessible, Nightingale and Tristan, respectively (Figure 7E, 9).
RESULTS31
KELPS
Interestingly, giant kelp (M. pyrifera) plant and stipe density was the least variable
among islands with no consistent differences (Table 1, 4; Figure 7C, D), even between
the northern islands and Gough. Mean island-level densities of kelp plants ranged from
44.7 to 53.9 per 100m2 and stipe counts ranged from 262.9 to 353.4 stipes per 100m2
(Table 1C). The relationship between plant counts and stipe counts was inverse, with
the highest stipes/plant and lowest plant density at Nightingale and lower stipe counts
but higher plant densities at the other three islands. There was, however, significant site
to site variation and depth variation for both kelp plant density (Table 4F) and stipe
density (Table 4G; Figure 8B). Despite some site to site variation in giant kelp plant and
stipe densities, within each island, the range in density across sites for kelp was less than
A. Lobster Biomass
FIGURE 8.
Biomass
Bubble plots (tonnes per ha)
depicting site-
level variation in 0.03–0.05
(A) lobster (Jasus 0.05–0.1
Inaccessible Tristan
tristani) biomass
and (B) giant 0.1–0.15
kelp (Macrocystis
0.15–0.2
pyrifera) stipe
density across
0.2–0.32
the four Tristan
da Cunha Islands.
Bubble size scales
with the biomass
Gough
or density estimated
using site-level
means of SCUBA Nightingale
surveys in nearshore
habitats.
B. Giant Kelp Stipe Density
Density
(no. per 100m2)
0–50
50–200
Inaccessible Tristan
200–300
300–500
500–850
Gough
Nightingale
ECOSYSTEM ASSESSMENT OF THE TRISTAN DA CUNHA ISLANDS | EXPEDITION REPORT | JULY 2017You can also read