EARTHQUAKE DEFORMATION MAPPING CAUSED BY THE TAAL VOLCANO ERUPTION USING INSAR GEOMUNDUS 2020
←
→
Page content transcription
If your browser does not render page correctly, please read the page content below
Earthquake Deformation Mapping caused by the Taal Volcano
                     Eruption using InSAR

                                      GeoMundus 2020

Vince Kenneth M. del Mundo1
1 MS Geomatics Engineering, University of the Philippines,
Diliman, Quezon City 1101, Metro Manila, Philippines
Tel.: + 63 916 287 2654
vmdelmundo1@up.edu.ph

Abstract
Synthetic-aperture radar (SAR) satellites utilize microwaves that are less affected by the
atmosphere. The long wavelengths of microwaves allow us to measure changes on the Earth’s
surface such as ground surface deformations and displacement. The study utilized Sentinel-1B
Single Look Complex (SLC) of the Taal Volcano area and its vicinity to determine the
deformation caused by the January 12, 2020 volcanic eruption. The calculation of interferogram,
coherence, and phase unwrapping using SNAPHU plugin to obtain the displacement of the area
of interest, were conducted by utilizing multiple satellite imaging passes such as the prior
(January 11, 2020) and after (January 23, 2020) volcanic eruption images. Results show that
there is a displacement ranging from -0.305 meters to 0.523 meters gradient. Negative
displacement represents the collapse or subsidence of the surface that is created after an eruption
while positive displacement represents the increased height or uplift of the ground surface.
Accordingly, higher (positive) values (west of Taal lake) indicate that the area was moved closer
to the satellite for there was an uplift. It was found out that the general location of fissures was
along the Pansipit river valley which is the major source of drainage of Taal Lake. This coincides
with the generated earthquake deformation map in which deformation occurs along the Pansipit
river and on the municipality of Lemery, Batangas. The utilization of the earthquake
deformation map from Sentinel-1 images is a powerful tool in detecting areas where fissures
could occur.

Keywords: displacement, earthquake deformation, interferometry, radar, SAR

1         INTRODUCTION
Ground deformation is a common geological hazard that is caused by the Earth’s material
subsurface movement (Massonnet and Feigl, 1998). This is induced by natural or anthropogenic
factors such as drought, underground water withdrawal, landslide, volcanic eruptions, and many
more. Through the utilization of Interferometric Synthetic Aperture Radar (InSAR), one can
easily monitor and measure topography, displacements, and deformation happening on the
Earth’s surface up to a millimeter precision (Pritchard, 2006). InSAR works by subtracting one
radar image from another radar image and then measures the ground surface changes or
displacement between the two images (Tripathy-Land, 2020). Accordingly, it also detects
changes in the Earth’s surface by recording the time when the reflected signal reached back to
the satellite sensor. The phase of return of the microwave signal is dependent on the distance of
the satellite to the ground. By then, the interferogram can be created by utilizing the phase
difference of the first pass and the second pass of the satellite in the same area (UNAVCO,
2019). This will result into color fringes or what we call as the interferometric phase.
The study utilized Sentinel-1B single look complex (SLC), interferometric wide (IW) swath
images of the Taal Volcano area and its vicinity to determine the deformation caused by the
January 12, 2020 volcanic eruption. Phase unwrapping and displacement calculation were
conducted to obtain the absolute measurement of the deformation using SNAPHU plugin of the
Sentinel Application Platform (SNAP) Desktop 7.0 software.

2         METHODOLOGY
Utilizing Single Look Complex (SLC), Interferometric Wide (IW) swath images of the Taal
Volcano and its vicinity with sensing dates of January 11, 2020 (before the eruption) and January
23, 2020 (after the eruption) were downloaded from the Copernicus Open Access Scientific Hub
website (https://scihub.copernicus.eu/) and were later examined with the use of the Sentinel
Application Platform (SNAP) Desktop 7.0 software. The processing tools of the Sentinel-1
toolbox (S1TB) were utilized for interferogram formation, phase filtering, and geometric
correction of the images. For the phase unwrapping algorithm for SAR interferometry, SNAPHU
plugin was utilized. As such, Google Earth Pro and ArcGIS 10.5 were utilized for the
presentation of outputs and generation of maps. The general workflow as seen in Figure 1 was
then followed to come up with the interferogram and displacement that were used to map
deformation following a volcanic eruption. The Intensity_IW2_VV bands of the two different
dates were utilized in the study to determine the phase difference of these two SAR observations.

            Figure 1. General workflow for the generation of earthquake deformation map

The relevant sub-swaths, and bursts of the ascending Sentinel-1B images were coregistered
using back geocoding and enhanced spectral diversity techniques. After the two images were
precisely coregistered, interferogram was created by cross-multiplying the master image from
the complex conjugate slave image after coregistration. Coherence and wrapped phase bands
were also created in this step. Debursting will then follow to remove the fringes for better image
visualization. To show deformation patterns, differential interferometry through topographic
phase removal were performed. The resulting images were then filtered for phase unwrapping
to proceed. Phase unwrapping involves the usage of an external plugin called SNAPHU for the
displacement calculation. Terrain correction was applied last to correct the image distortions for
the output images of the wrapped phase, coherence, and the unwrapped phase’s displacement.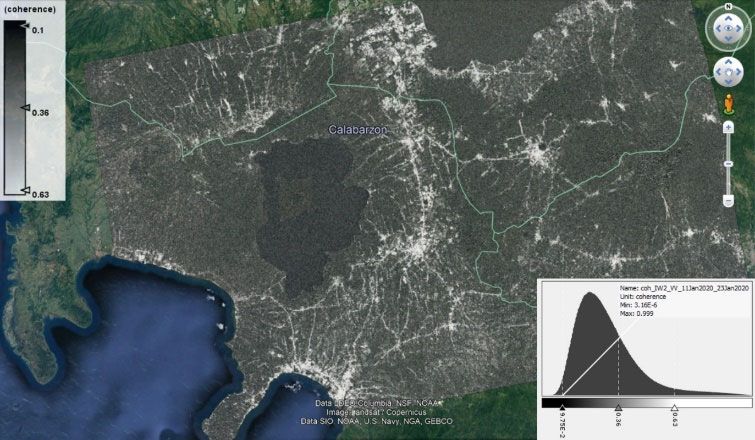
3         RESULTS AND DISCUSSION
Interferogram formation (Figure 2) and coherence estimation (Figure 3) in relation to topography
were involved in this part of the study.

                    Figure 2. Wrapped phase interferogram of the area of interest

                          Figure 3. Coherence image of the area of interest

The fringes of the wrapped phase interferogram consists of a color cycle ranging from –π to +π
(-3.14 to +3.14). This was determined by detecting the distance between the satellite and the
ground targets. Fringes indicates some increment of displacement that corresponds to
deformation. The denser the fringes are, the greater its deformation. As we saw in the image,
dense fringes are surrounding the Taal Lake. A study by Tripathy-Land (2020) indicated that
each fringe of the Sentinel-1 image depicts approximately 2.8 centimeters of movement and
scientists count these fringes to calculate the displacement that happened in an area.
Coherence images is also one of the outputs of the conducted interferometry and serves as an
indicator for the quality of the phase images that were created. Coherence also tells how pixels
from the master and slave images are related. In Figure 3, the output of coherence is a gradient
from black to white. Areas with low coherence (darker) have no clear fringes in the interferogram
while areas with high coherence (brighter) are those that have no clear fringes in the
interferogram. Low coherence is a result of volume scattering of the target objects which include
forests and mountainous areas. Values closer to one represent mostly of the built-up areas. As
such, lower values are those that have the greatest interferometric phase noise while values closer
to 1 have lesser phase noise (Braun and Veci, 2015).
The earthquake deformation map, as seen on Figure 4 was a result of phase unwrapping and
displacement calculation. Here, the fringes that initially appear to follow the contour are not
clearly visible since the topographic phase was removed during the process.
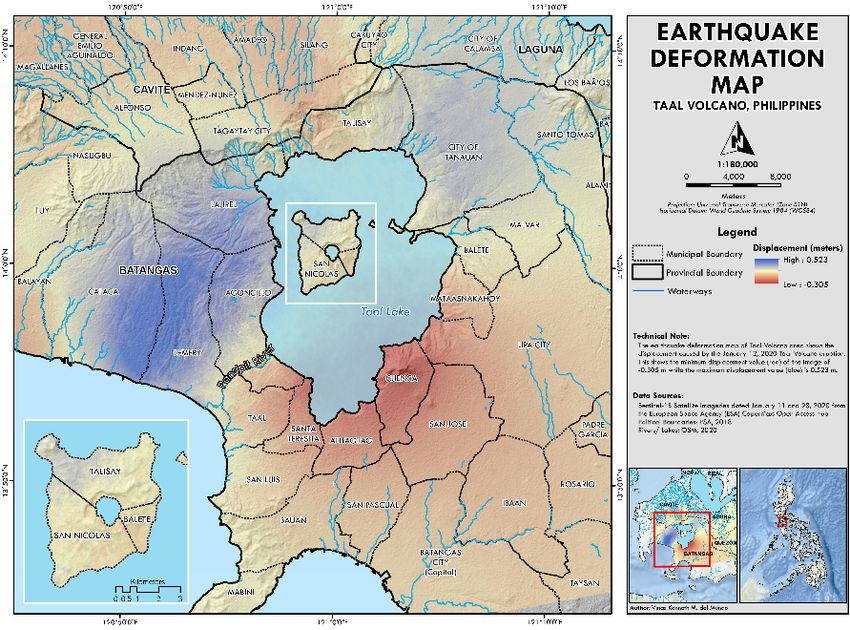
Figure 4. Earthquake deformation map of Taal Volcano and its vicinity
The displacement ranging from -0.305 meters (red) to 0.523 meters (blue) gradient is presented
on the map. Negative displacement represents the collapse or subsidence of the surface that is
created after an eruption while positive displacement represents the increased height or uplift of
the ground surface. Since the satellite image was captured in its ascending pass, it is evident on
the image that the southeast part Taal Lake (occupying by the municipalities of Taal, Santa
Teresita, Alitagtag, and Cuenca in Batangas) has negative displacement values indicating that
these areas are moved away from the satellite and are subsiding the most. Accordingly, higher
(positive) values (west of Taal lake) indicate that the area was moved closer to the satellite for
there was an uplift. It was found out that the general location of fissures was along the Pansipit
river valley which is the major source of drainage of Taal Lake. This coincides with the
generated earthquake deformation map in which deformation occurs along the Pansipit river and
on the municipality of Lemery, Batangas.
Both InSAR and DInSAR are considered powerful tools in measuring topography,
elevation, displacement, and deformation with high spatial sampling and high accuracy without
even going to the actual place itself. The images that have been created can be used by scientists
for proper planning of areas in which earthquakes and ground shaking events occurred following
a volcanic eruption.References Braun, A., and L. Veci, 2015, Sentinel-1 Toolbox: TOPS Interferometry Tutorial. SkyWatch Space Applications, Inc. Available online at: http://step.esa.int/ (last accessed January 2020). EO College, 2017, ESA Echoes in Space – Hazard: Volcanic Eruption Mapping with Sentinel-1 YouTube tutorial. Available online at: https://www.youtube.com/watch?v=VE38mGI8h-I (last accessed January 2020). Massonnet, D., and K. Feigl, 1998, Radar interferometry and its application to changes in the Earth’s surface. Rev. Geophys. 1998, 36, 441–500. PHIVOLCS, 2020, Taal Volcano Bulletin. Available online at: https://www.phivolcs.dost.gov.ph/ (last accessed January 2020). Pritchard, M., 2006, InSAR, a tool for measuring Earth's surface deformation. American Institute of Physics, Physics Today, S-0031-92229-0607-370-4, 68-69pp. Tripathy-Land, A., 2020, InSAR shows massive ground deformation around the erupting Taal Volcano. Available online at: https://temblor.net/earthquake-insights/insar-shows-massive-ground-deformation- around-the-erupting-taal-volcano-10414/ (last accessed January 2020). UNAVCO, 2019, How we use InSAR to study our Earth. Infographics. Available online at: https://www.unavco.org/education/outreach/infographics/lib/images/InSAR-Basics-back.pdf (last accessed January 2020).
You can also read