Dublin City Spatial Energy Demand Analysis - Codema
←
→
Page content transcription
If your browser does not render page correctly, please read the page content below
Dublin City Spatial Energy Demand Analysis
Dublin City Spatial Energy Demand Analysis
Report prepared by Codema in association with Dublin City Council.

Author: Donna Gartland, Strategic Sustainable Energy Planner

June 2015
Copyright © 2015 Codema

All rights reserved

Report developed by Codema with support from the INTERREG IVB North West Europe programme through
the Academy of Champions for Energy (ACE)

Reproduction of the contents is permissible provided the source is acknowledged.

Disclaimer
While Codema considers that the information given in this work is sound, all parties must rely upon their own
skill and judgment when making use of it. Codema does not make any representation or warranty, expressed
or implied, as to the accuracy or completeness of the information contained in this report and assumes no
responsibility for the accuracy or completeness of such information. Codema will not assume any liability to
anyone for any loss or damage arising out of the provision of this report.
Contents
Executive Summary ................................................. 7
Introduction ........................................................... 9
 Context............................................................................................................. 9
 Relating Policy ................................................................................................. 12

Spatial Energy Demand Analysis ............................ 15
 Introduction ..................................................................................................... 15
 Residential Sector Energy .................................................................................. 19
    Methodology................................................................................................ 19
    Results ......................................................................................................... 20
 Commercial Sector Energy ................................................................................ 33
    Methodology................................................................................................ 33
    Results ......................................................................................................... 33
 Municipal Sector Energy ................................................................................... 41
 Total Energy in all Sectors ................................................................................. 45

Renewable Energy Potential ................................... 55
Conclusion .......................................................... 61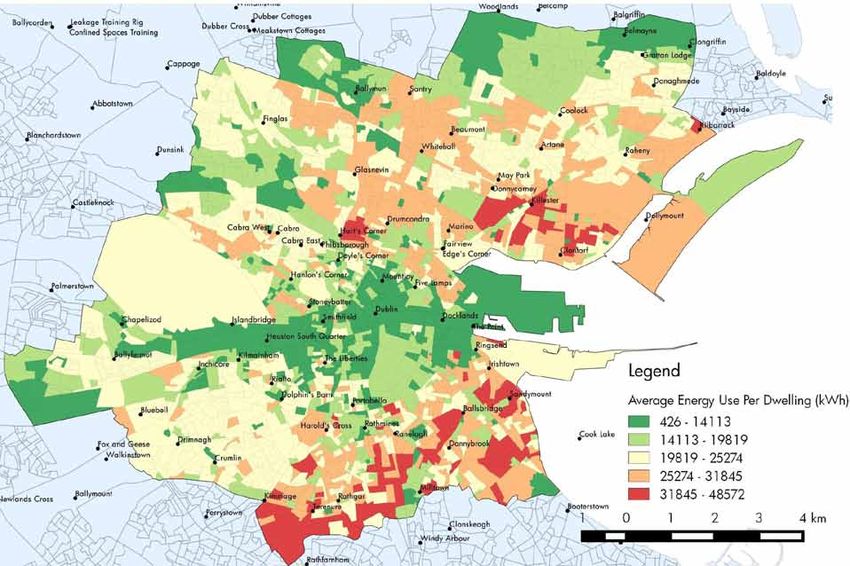
Dublin City Spatial Energy Demand Analysis
Table of Figures
Figure 1: Final Energy by Fuel Type Dublin City (2011) ......................................................................... 10
Figure 2: Heat Density Map of Skelleftea Municipality in Sweden (Source: Ranhagen & Ekelund (2004)) ..... 12
Figure 3: Maps Showing Examples of Small Area (SA) Breakdown in Dublin City ..................................... 15
Figure 4: Average C ratings (Green) in areas around the newly developed Dublin Docklands Area ............. 20
Figure 5: Average G ratings (Red) in areas in the older north inner city area ............................................ 20
Figure 6: Average BER of All Dwellings in Each Small Area ................................................................... 21
Figure 7: Average Annual Energy Use per Dwelling in Each Small Area .................................................. 23
Figure 8: Average Floor Area of Dwellings in Each Small Area .............................................................. 24
Figure 9: Average Annual Energy Costs per Dwelling in Each Small Area ................................................ 25
Figure 10: Areas Most at Risk of Energy Poverty ................................................................................... 28
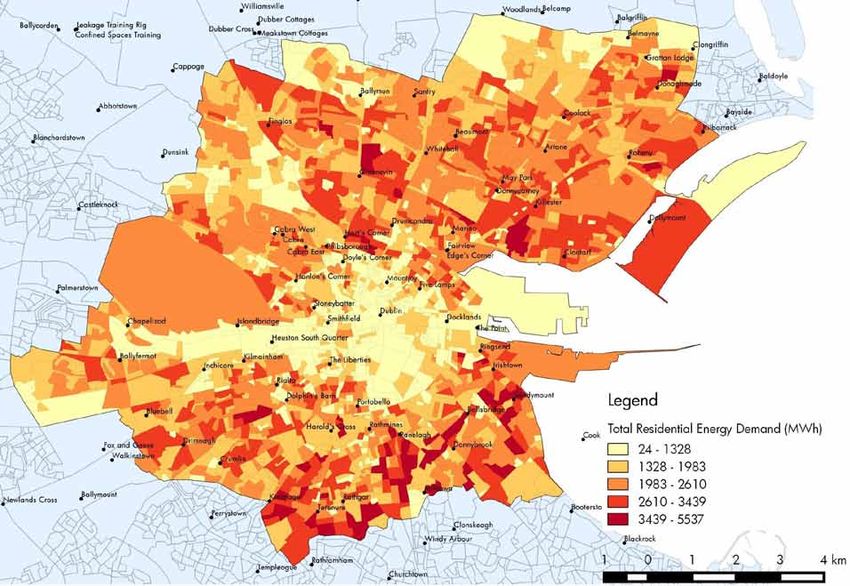
Figure 11: Total Annual Residential Energy Demand (MWh) .................................................................. 29
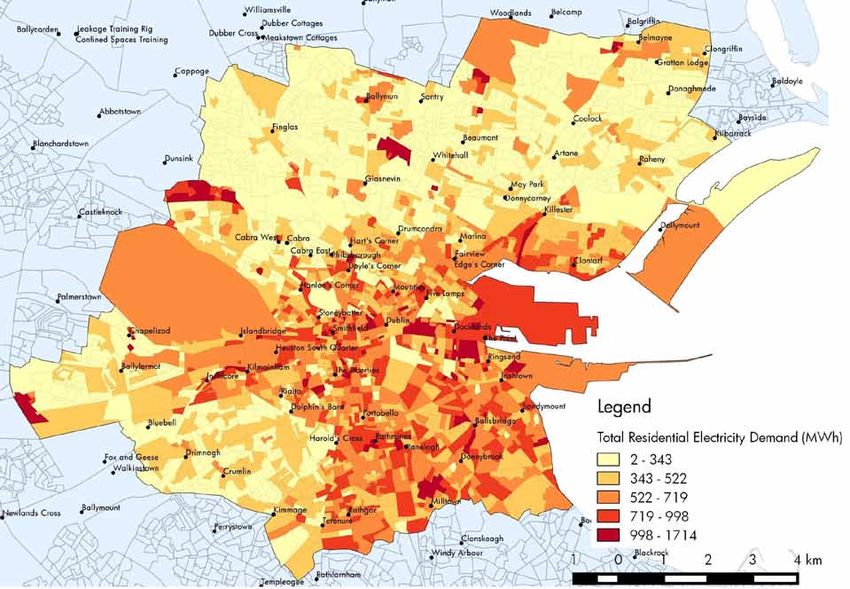
Figure 12: Total Annual Residential Electricity Demand (MWh) ............................................................... 30
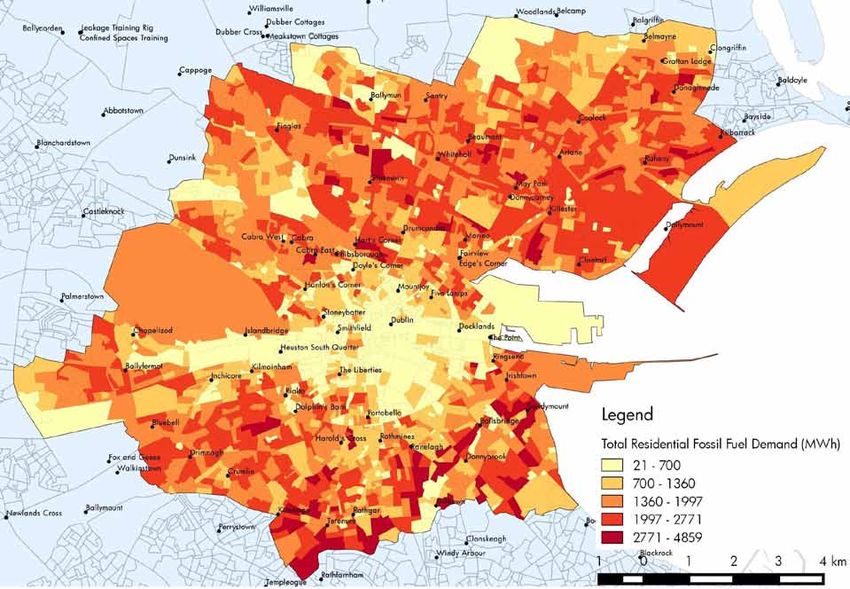
Figure 13: Total Annual Residential Fossil Fuel Demand (MWh) .............................................................. 31
Figure 14: Zoom-in Section of Map shown in Figure 15 ........................................................................ 34
Figure 15: High Energy Users within City Centre and Docklands ............................................................ 34
Figure 16: Annual Energy Use (MWh) and Location of Each Commercial Premises Analysed ...................... 35
Figure 17: Areas of Highest Annual Commercial Energy Use ................................................................. 36
Figure 18: North Dock Area with Highest Energy Demand in Commercial Sector ...................................... 37
Figure 19: Total Annual Commercial Energy Demand (MWh) ................................................................ 38
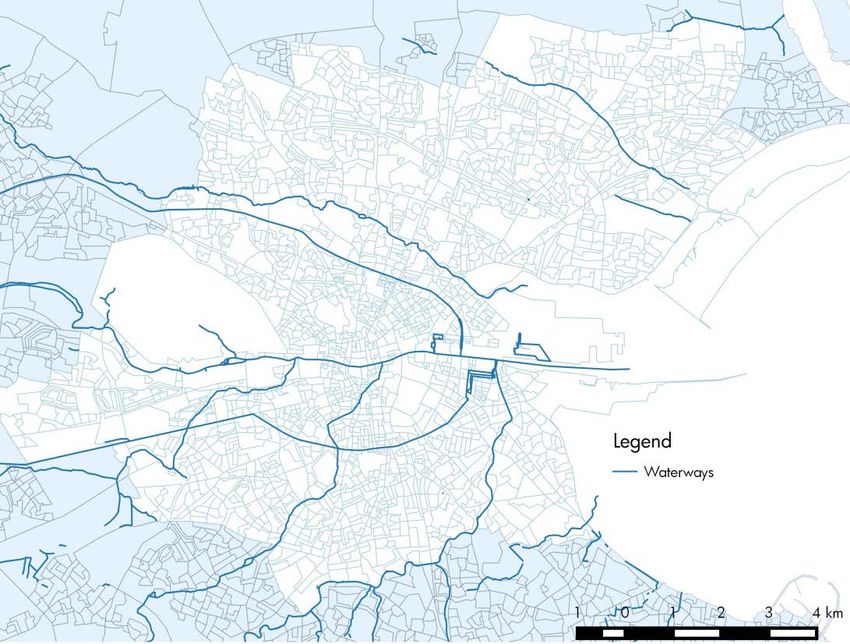
Figure 20: Commercial Sector Heat Demand Density (TJ/km2) ............................................................... 39
Figure 21: Total Annual Commercial Heat Demand (MWh) ................................................................... 39
Figure 22: Total Annual Commercial Energy Costs (1000s €) ................................................................. 40
Figure 23: Zoom-in Section Showing Large Energy Users ....................................................................... 41
Figure 24: Municipal Energy Use (MWh) and Locations of Each Account ................................................. 43
Figure 25: Total Annual Municipal Energy Demand (MWh) ................................................................... 44
Figure 26: Section of Dublin City Map with High Heat Demand Densities and Clustered Commercial Activity 45
Figure 27: The Greater Copenhagen DH System (Danish Energy Agency) ................................................ 46
Figure 28: Total Heat Demand Density of All Sectors (TJ/km2) ................................................................ 47
Figure 29: Potential Anchor Loads and Industrial Waste Heat Resources for DH ........................................ 48
Figure 30: Total Annual Energy Demand of All Sectors (GWh) ............................................................... 50
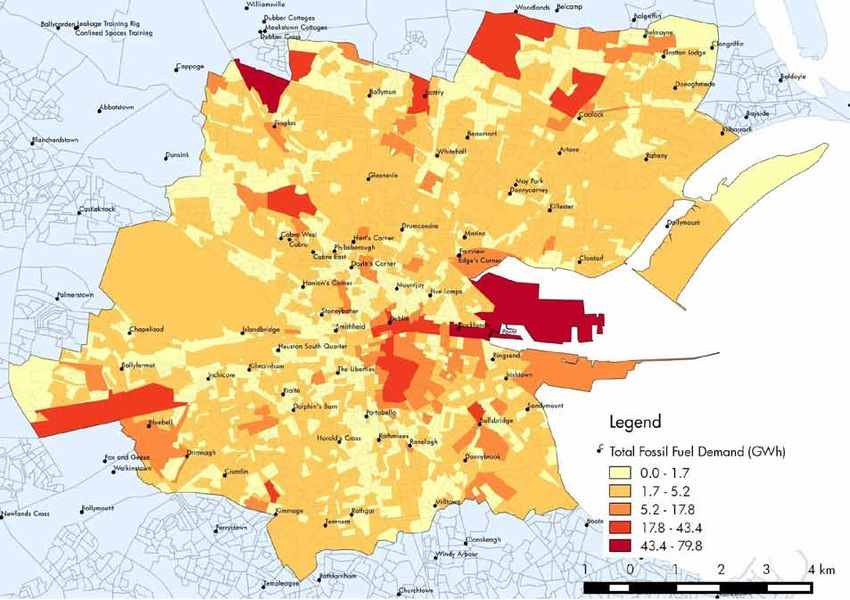
Figure 31: Total Annual Fossil Fuel Use (GWh) of All Sectors ................................................................. 51
Figure 32: Total Annual Electricity Use (GWh) of All Sectors .................................................................. 52
Figure 33: Electricity Share (%) of Total Energy Demand of All Sectors .................................................... 53
Figure 34: Total Annual Energy Costs (1000s €) of All Sectors ............................................................... 54
Figure 35: Suitability of Domestic Open-Loop Shallow Geothermal System (GSI , 2015) ............................ 55
Figure 36: Wind Speeds at 20m height in Dublin City (Source: SEAI Wind Mapping System) .................... 56
Figure 37: Locations of Waterways in Dublin City ................................................................................ 57
Figure 38: Roof Space Solar Atlas, Denmark (Source: energyroof.dk/solaratlas-for-denmark) ..................... 58
Figure 39: Biomass Production Suitability in Dublin City (Source: SEAI Bioenergy Mapping System) ............ 59
Table of Tables
Table 1: Representation of BERs in Each Postcode Area ......................................................................... 20
Table 2: Top Ten Areas Most at Risk of Energy Poverty .......................................................................... 26
4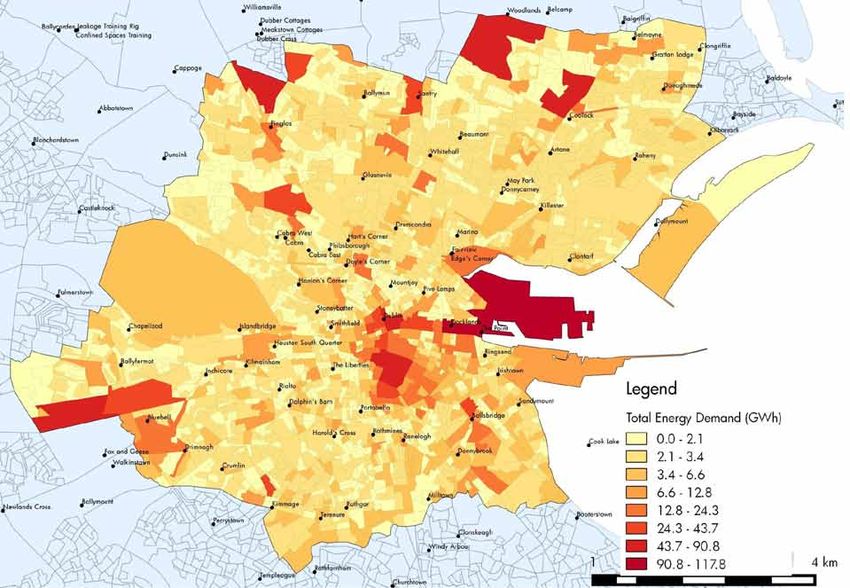
Dublin City Spatial Energy Demand Analysis

Glossary of Terms
SEDA – Spatial Energy Demand Analysis
SEAP – Sustainable Energy Action Plan
BER – Building Energy Rating
CSO – Central Statistics Office
SEAP – Sustainable Energy Action Plan
DC – Dublin City
DCC –Dublin City Council
DH – District Heating
SEAI – Sustainable Energy Authority of Ireland
kWh – Kilowatt-hour
MWh – Megawatt-hour (1kWh *103)
GWh – Gigawatt-hour (1kWh *106)
TWh – Terawatt-hour (1kWh *109)
TJ – Terajoule
CHP – Combined Heat and Power
km – Kilometre
PV – Photovoltaic
RE – Renewable Energy
HH – Household

                                                 5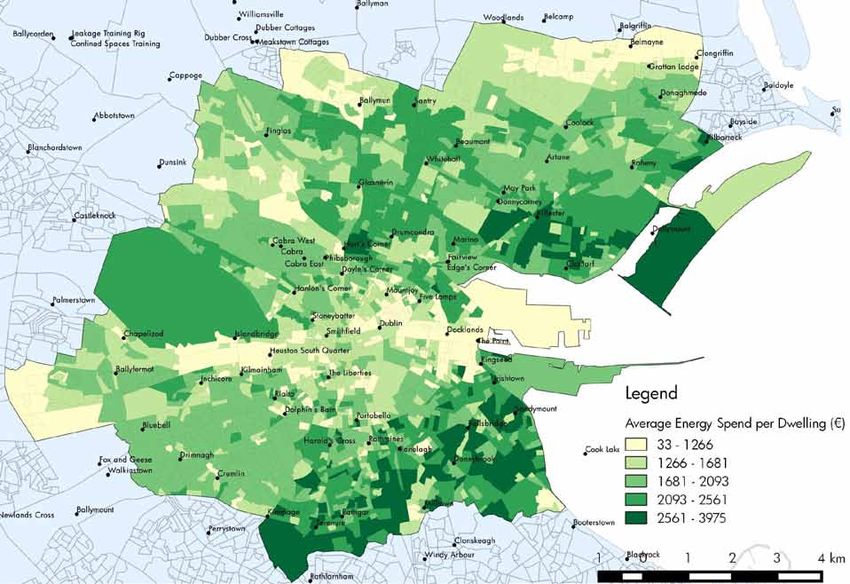
Dublin City Spatial Energy Demand Analysis

6
Dublin City Spatial Energy Demand Analysis

Executive Summary
This is the first Spatial Energy Demand Analysis (SEDA) produced by Codema for Dublin City. It is only the
second SEDA to be produced in Ireland, and the first at a city-scale. The analysis was carried out by Codema
as part of the ACE project, which receives European Regional Development Funding through the INTERREG
IVB NWE programme. A SEDA involves analysing the energy demand within a given area and creates a
spatial visualisation of this information, resulting in evidence-based energy maps which can be used as a tool
by town and city planners to create effective policies and actions to influence future energy use. The SEDA
seeks to bridge the current gap between spatial and energy planning methodologies at a local level in Ireland
and builds on the experience of other leading European countries. The mapping is particularly important for
locating areas of high heat demand density which is a crucial element in planning for District Heating (DH)
schemes.

The sustainable use of energy and natural resources and the negative impacts of CO 2 on our environment have
led to energy and climate change becoming a major topic in both the public and private sector discourse. In
preparation of the new Dublin City Development Plan 2016-2022, Dublin City Council has clearly identified
the importance of climate change adaptation and mitigation and identifies the need to strengthen and develop
strategic sustainable energy planning in the city through evidence-based spatial energy analysis.

Currently there is a lack of interconnection between traditional planning practices and planning for sustainable
energy use at local authority level. The Dublin City SEDA therefore allows for effective development of future
scenarios for sustainable energy. Dublin City Council can now use this SEDA as a first step in integrating
energy planning into traditional spatial planning practices and creating evidence-based energy-related
planning policy and actions. The SEDA also creates increased awareness of energy demand and local
resources among other stakeholders and informs future feasibility studies of sustainable energy options for the
city.

The results of the Dublin City SEDA show exactly where and what type of energy is being used, and the costs
of this energy consumption throughout the city, in each of the residential, commercial and local authority
sectors. Over 200,000 dwellings, 20,000 commercial properties and 1,000 local authority building-based
energy accounts have been analysed in terms of annual energy use and the results have been mapped.

The residential sector analysis allowed the identification of the areas most at risk of energy poverty, based on
the three most influential factors affecting energy poverty; the energy efficiency of the home, affordability (in
terms of unemployment), and the cost of energy per household. These areas have been highlighted (p.26) and
can be prioritised in terms of strategies to combat energy poverty within the city. The results of mapping the
average Building Energy Rating (BER) in each of the 2,202 small areas in Dublin City has shown that while
better building regulations for new dwellings are effectively reducing the energy demand in new
developments, the rest of the city’s dwellings are becoming older and less efficient, with many areas,
particularly in the inner city, having E ratings or lower. A real concern is the number of rented dwellings which
have very poor BERs. With escalating rents in the city, coupled with increasing energy costs, the affordability
of energy in these poorly insulated rented dwellings will only increase the number of people suffering from
energy poverty.

In terms of DH analysis, over 75% of Dublin City areas have heat densities high enough to be considered
feasible for connection to DH systems. Many of these areas have very high heat densities and would be ideal
first-phase developments of a city-wide large scale DH system plan. The SEDA has also identified locations of
potential anchor loads and waste heat resources which can be major contributors to a successful DH network.
The North Docks area has the highest energy demand of any area in Dublin City, and consumes over 116
GWh per year in the commercial sector alone. Overall, Dublin City spends over €657 million a year on
energy and a large percentage of this money leaves the Irish economy to pay for fossil fuel imports. Therefore
increasing indigenous energy sources is crucial, and this report has identified solar energy resources as one of
the most accessible renewable energy resources in the dense urban landscape of Dublin City.

                                                       7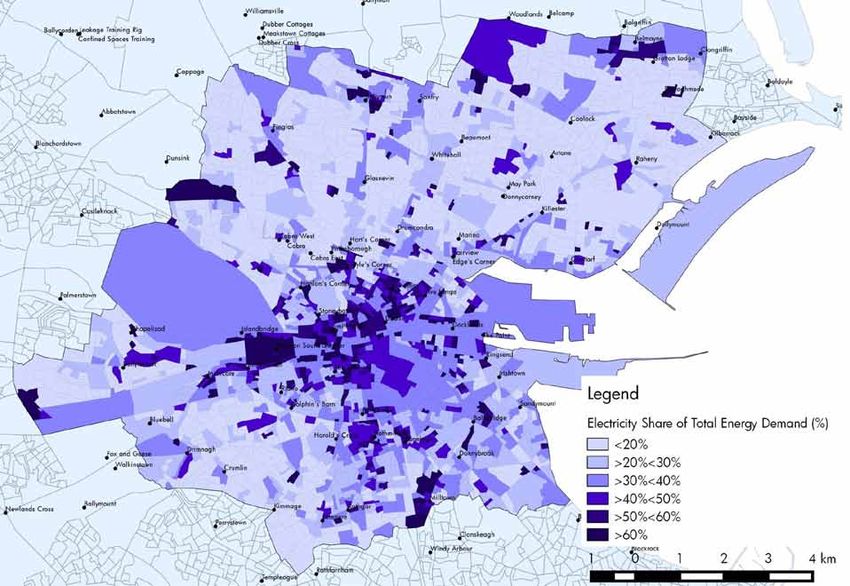
Dublin City Spatial Energy Demand Analysis

8
Dublin City Spatial Energy Demand Analysis
Introduction
These maps provide the local authority with the
information needed to target areas most in need
of, and most suitable for, Renewable Energy (RE)
The following report has been produced by solutions. In particular, and due to the work
Codema on behalf of Dublin City Council (DCC) already carried out by DCC to develop District
and outlines the process and results of the Spatial Heating (DH) in Dublin, the areas with high heat
Energy Demand Analysis (SEDA). This analysis has demand density which are deemed most suitable
been conducted by Codema as part of the ACE for large scale DH schemes are identified. DH
project, which is an EU funded initiative under the schemes are a proven way to integrate high levels
INTERREG IVB NWE programme. ACE is a of RE into a dense urban landscape such as Dublin
renewable energy initiative which connects City.
partners across several North West European
countries. It promotes the importance of renewable This SEDA is only the second of its kind to be
energy in everyday life to citizens, businesses, developed in Ireland and is seen as the next
universities and local authorities. A central coherent step to follow on from DCC’s Sustainable
philosophy of the ACE project is if the right Energy Action Plan (SEAP). The SEDA enhances
information is provided, there will be an increased the SEAP in order that it can be more effectively
uptake of renewable energy. integrated with other action plans and into the
planning process. This will bring energy planning
This SEDA aims to provide the information required in Dublin City more in line with other European
for the local authority to increase the uptake of cities that are leading the way in effective local
renewable energy through planning, policy and level sustainable energy planning.
raising awareness. Up to now, the local authority
has lacked any evidence-based tools for planning Context
for sustainable energy solutions. This SEDA aims to
bridge the gap between energy planning and
traditional urban planning within the local Climate Change Challenge
authority, and enables planners to build
“The generations that came before us didn’t know
meaningful energy policy and effectively shape the
that their actions were causing climate change. The
energy-future of the city.
generations who come after us risk inheriting an
unsolvable problem. We are the generation that
The analysis focuses on the current energy demand
can make the difference.”- Mary Robinson,
and the fuels used to provide such energy within
President of the Mary Robinson Foundation for
the Dublin City Council area and places this data
Climate Justice
within a spatial context. Creating these maps helps
to identify opportunities, synergies and constraints
Climate change is widely recognised as the
in different city districts. This detailed mapping
greatest environmental challenge of our time and
process provides a visualisation of many aspects of
the evidence of such change is already being felt
energy use and its effects within each small area1
here in Ireland in terms of rising sea levels, extreme
in Dublin City, such as:
weather and changes in ecosystems. A recent
publication co-authored by the UK’s Royal Society
Building Energy Ratings (BER)
and the US National Academy of Sciences,
Energy use per dwelling
‘Climate Change: Evidence & Causes’, states that
Energy spends per dwelling
the speed of global warming is now 10 times
Fuels used for heating dwellings
faster than it was at the end of the last ice age,
Areas at risk of energy poverty
with the last 30 years being the warmest in 800
Areas of high fossil fuel usage
years (The Royal Society & The US National
Areas with high electrical usage
Academy of Sciences, 2014). The report also
Heat demand density
concludes that the latest changes in our climate are
“almost certainly due to emissions of greenhouse
gases caused by human activities” (The Royal
Society & The US National Academy of Sciences,
1
A ‘Small Area’ is the smallest geographical breakdown used 2014, p. B9). This publication is just one of a
in Ireland for statistical purposes.
9Dublin City Spatial Energy Demand Analysis
multitude of evidence and research-based papers meet even a small percentage of its energy
which show irrefutable evidence that Greenhouse demand with local sustainable resources, it could
Gases (GHGs) are responsible for climate change retain a substantial amount of money within the
and it is imperative to act now in order to curtail Irish economy and increase security of supply.
the irreversible damage caused by these emissions.
Fossil fuel use is responsible for over half of all
GHG emissions globally, and the majority of these
emissions come from energy supply, transport,
residential and commercial buildings and industry
(IPCC, 2007).
The Irish Government has already committed to
reducing emissions at a national level, and the
significance of Dublin City in the Irish economic
landscape means it is imperative to plan and
commit to energy saving and CO2 reduction at a
local level in order to help meet national level
targets from a bottom-up approach. It is
Figure 1: Final Energy by Fuel Type Dublin City (2011)
particularly important for urban regions to look to
integrate renewable electricity sources as close to Electricity in Ireland has high CO2 emissions per
the demand as possible, which leads to reduced kWh due to the supply mix on the national grid,
losses during transport of renewable electricity. which, in addition to gas (~50%), is supplied by
This also has the significant effect of decreasing the peat (12%) and coal (25%) plants, and nearly
burden on rural areas to produce renewable 50% of the energy from these fuels is lost during
electricity, particularly in the midlands and the transformation and transmission. The high cost of
west, where large wind farms can in some cases electricity, along with high carbon emissions and
have negative impacts on these communities. There reliance on imported fuels are only more reasons
are many significant additional benefits to for Dublin City to look to producing its own
reducing CO2 levels and implementing more sustainable energy locally.
renewable energy in the city, including reduced
health effects, decreased fossil fuel dependence,
higher security of supply, lower energy costs, Local Level Energy Planning
increased energy price stability, increased Conventionally, energy planning is implemented at
economic competitiveness and a sustainable a national level and not effectively addressed
economy. within local or regional level planning structures in
Ireland. Experience from other countries has shown
Energy Use in Dublin City that national policies on energy which are
specifically designed to address energy use from a
The latest figures estimate that less than 1% of all national level perspective can make it hard for
energy use in Dublin City comes from locally local authorities to fully address energy
produced renewable energy, as seen in Figure 1, consumption due to the structure of the national
and instead there is a large dependence on policy framework, and the lack of autonomy and
imported fossil fuel sources such as gas, oil, diesel flexibility conferred upon them in the energy sector
and petrol (Gartland, 2013). There is easy access (Sperling, Hvelplund, & Mathiesen, 2011) (Chittum
to the gas grid throughout Dublin City, and gas is & Ostergaard, 2014). This leads to local
therefore the main fuel source used for heating authorities not having the knowledge or experience
requirements. The national electricity supply is also to make strategic decisions on how energy is or
based predominantly on gas-fuelled power plants. will be provided in their locality.
This means Dublin City is very susceptible to price
increases and shortage of supply of gas in the In contrast, local level energy planning is routine in
European market. Ireland imports around 95% of many other European countries, in particular
its natural gas requirements, meaning billions of Denmark, Sweden and recently re-municipalised
euro annually is exported to pay for these areas in Germany. Laws were first introduced in
resources. If Dublin City could increase its ability to
10Dublin City Spatial Energy Demand Analysis
Denmark in 1979 requiring municipalities to carry
out local level energy plans, and this regulatory Also, the feasibility of District Heating (DH) and
framework has been credited with creating the Combined Heat and Power (CHP) is dependent on
base for the sustainable growth Denmark has seen many spatial and urban planning related factors
in the years since. These planning laws required such as heat demand density and zoning of
municipalities to conduct analyses of their local building uses, which reinforces the inseparable
heating requirements and the available heat nature of spatial planning and energy planning.
sources, and municipalities were also made
responsible for assessing future heating needs and In order for planners to evaluate the feasibility of
supplies and planning around these. In the 1980s integrating a range of renewable energy
the government introduced laws to ensure that all resources, they will need to develop a SEDA type
energy projects had to be assessed by taking tool in order to ‘read the energy landscape’
account of the full socio-economic costs and (Pasqualetti, 2013). A SEDA allows planners to
benefits, and based on this, municipalities should locate where the large energy demands are, what
only pursue projects which show a high level of type of energy is required in these locations, i.e.
socio-economic benefits (Chittum & Ostergaard, heat, electricity, gas, etc., the areas susceptible to
2014). energy poverty due to high energy costs, and
areas of high fossil fuel use.
These laws resulted in high levels of locally
produced heat and electricity in the form of Economic development in Dublin has been, so far,
Combined Heat and Power (CHP) and DH systems driven mainly by resources that have no immediate
with integrated renewable energy sources. Today, geographic link to the area exposed to planning.
around two thirds of Danish electricity is The fossil fuels and electricity that will be used
cogenerated with heat, and heat is supplied during the lifetime of a development have, in most
through DH systems to 60% of Danish households. cases, no influence on its location as it can be
Studies have shown that this increased use of CHP simply connected by pipe or cable to some far-off
and DH has reduced overall nationwide emissions location. In this way, spatial planning is not
by 20%, and reduced CO2 emissions in the currently linked to energy resource management.
heating sector by 60%. There is currently 386,234 The planning system now faces the new challenge
m2 of solar heating being used in municipal DH of taking account of, and creating balance
projects, along with other sustainable sources such between designing cities to reduce energy
as biomass and waste heat. The use of local demand, retaining sufficient space for sustainable
energy planning in Denmark has reduced energy energy production, and providing energy from
costs to consumers, enabled higher integration of local resources, while also evaluating social and
renewable energy, reduced energy demand and environmental considerations.
reduced the overall impact on the environment.
Spatial Energy Demand Analysis as a tool
The Need for Integrated Energy and for Sustainable Spatial Planning
Spatial Planning
Energy mapping resources are used by energy
The increasing need for society to change to more planners in local authorities throughout Europe and
sustainable forms of energy supply to combat are often referred to as the first step in the energy
climate change and meet growing demands means planning process. It is the foundation for planning
that space is now a fundamental asset for energy for current and future predicted energy
production. This is due to the fact that renewable consumption at a local level. It allows the planner
energy is an area-dependent resource, e.g. space to define ‘energy character areas’, based on the
and suitability of land for bio-fuel crops, for wind estimated energy demand and supply
farms, for solar energy, or for hydro-power. characteristics, and the RE potential of that area.
(Stoeglehner, Niemetz, & Kettl, 2011). Energy
production now enters the competition for space The Province of Gelderland in The Netherlands has
with many other products and services that are developed an online ‘Energy Atlas’, which is used
reliant on space, such as food production and as a tool for sustainable regional development. It
property development. outlines existing renewable energy projects such as
11Dublin City Spatial Energy Demand Analysis
geothermal, solar, wind and hydro power plants, Figure 2 is an example from a Swedish
and also maps the potential to use a range of municipality, and shows areas within the region
renewable energy types throughout the region. For which are colour coded according to heat demand
example, areas are highlighted which have best density.
solar potential, areas of old landfill sites, and
areas where there is industrial waste heat This map is then used by the municipality’s energy
available. This energy atlas can be accessed at the planners to decide which areas are most suitable
following link for DH or individual heating solutions such as heat
http://www.gelderland.nl/4/energieatlas/Kaarte pumps or solar thermal, and integrate the findings
nwijzer.html into future scenario development. This Dublin City
SEDA uses similar methodologies for mapping
The Swedish Energy Agency’s guide to sustainable energy demands as those that are typically used in
spatial planning outlines how “integrating energy Swedish and Danish energy planning.
issues for heating and transport in comprehensive
planning” is one of the four ‘leaps’ to effective Once this initial step is complete, deeper techno-
sustainable energy planning, and documenting the economic analysis and energy system modelling of
current energy effects of heating, cooling, an identified energy character area allows the
electricity and transport allows the development of planner to judge if the area is technically and
future scenarios for energy and transport economically feasible to implement the
(Ranhagen, 2011). The energy map shown in recommended sustainable energy solutions.
Figure 2: Heat Density Map of Skelleftea Municipality in Sweden (Source: Ranhagen & Ekelund (2004))
From this overarching EU climate and energy
Relating Policy package, there are directives which set specific
targets for renewable energy for each member
state and outline the measures to be put in place
EU Policy for energy efficiency.
The European Union (EU) put in place a framework
The EU Energy Efficiency Directive 2012/27/EU,
for energy for all member states called the ‘2020
and Renewable Energy Directive 2009/28/EC
Climate and Energy Package’. This set binding
have resulted in national level energy action plans
legislation for all member states so that the EU as a
in each area respectively. In terms of the
whole will achieve 20% GHG emission reductions,
Renewable Energy Directive, Ireland has been set
20% energy produced by renewable resources,
a target of 16% of all non-Emission Trading
and 20% increase in energy efficiency by 2020.
Scheme (ETS) energy consumption to come from
Renewable Energy Sources (RES) by 2020, the
sectorial split being 40% electricity, 12% heat and
12Dublin City Spatial Energy Demand Analysis
10% transport energy. Latest figures (2013 energy how Ireland intends to implement the energy
figures) show Ireland’s renewable energy in efficiency and renewable energy targets set by the
electricity is at 20.9% of gross electricity European Commission. This SEDA aims to help
consumption, renewable heat is at 5.7%, and fulfil the goals of the NREAP and NEEAP by
renewables in transport at 4.9%, therefore Ireland developing renewable energy and energy
is approximately half-way toward 2020 targets efficiency at a local and regional level within
with five years left to improve. This SEDA aims to Dublin City, and developing strategic energy
increase the use of renewables at a local level in action plans specifically tailored to the energy
order to contribute towards overall national level characteristics of the area.
targets.
A Green Paper on Energy Policy in Ireland was
Although there are no binding targets for energy published in May 2014 in preparation for the
efficiency, there are binding obligations on each White Paper version to be finalised in 2015. The
member state. Of particular relevance to this Green Paper addresses five priorities relating to
regional level SEDA, Article 14 of the Energy Energy Policy:
Efficiency Directive on the ‘Promotion of efficiency Empowering Energy Citizens,
in heating and cooling’ states: Markets, Regulation and Prices,
Planning and Implementing Essential
Energy Infrastructure,
“Member States shall adopt policies which
Ensuring a Balanced and Secure Energy
encourage the due taking into account at local and
Mix,
regional levels of the potential of using efficient
Putting the Energy System on a Sustainable
heating and cooling systems, in particular those
Pathway.
using high-efficiency cogeneration. Account shall
be taken of the potential for developing local and
The SEDA will help to address the priorities
regional heat markets.”
surrounding planning essential energy
infrastructure and creating a more sustainable
The SEDA will help to identify the most appropriate
energy system within Dublin City. The SEDA allows
sustainable energy solutions for heating the current
DCC to take some control and have some influence
and future building stock in Dublin City.
over the energy used within the region, which can
now be used as a bottom-up approach to meeting
In October 2014, due to there being no clear
the new Energy Policy priorities.
framework post-2020 targets, the EU put in place
a new ‘2030 Framework for Climate and Energy
The Regional Planning Guidelines for the Greater
Policies’ which has set a 40% GHG reduction on
Dublin Area (GDA) 2010-2022 provides planning
1990 GHG levels, and an EU-wide target of 27%
guidance on economic, infrastructure and
for renewable energy and energy savings by
settlement policies for the GDA which includes
2030. There are no specific targets set for each
Dublin City. These guidelines specifically support
member state under this new framework.
the implementation of local level energy action
plans, and also suggest they “… should be
This SEDA will also allow DCC to stay on top of
presented in a spatially geographic manner where
energy issues in its region and help to future-proof
possible in order to provide an extended evidence
the city for new energy legislation past 2020. The
base in the decision making process”.
near future will see new policies and directives as
a result of the EU’s ‘Energy Union’ proposals and
This SEDA will fulfil these suggestions under the
the results of the UN Climate Conference in Paris in
Regional Planning Guidelines, and DCC will be the
December 2015.
one of the first local authorities to do so, which will
pave the way for other local authorities to follow
National and Regional Level Policy suit.
The National Renewable Energy Action Plan
(NREAP) and National Energy Efficiency Action
Plan (NEEAP) are a direct result of the overarching
EU Directives previously discussed. These outline
13Dublin City Spatial Energy Demand Analysis 14
Dublin City Spatial Energy Demand Analysis
There will also be a breakdown of the energy use
Spatial Energy Demand into the three sectors of Residential,
Commercial/Industrial and Municipal energy use,
Analysis which will each have their own relevant maps
created. For the residential sector, there will be
additional maps created, for example, showing
Introduction average BER ratings in each area and areas at
This section outlines the methods and results of high risk of energy poverty. These maps will outline
calculating and mapping current energy areas in need of energy retrofitting and areas
consumption in buildings within the Dublin City which may be suitable for various energy
area. Currently there is no publicly available actual technologies.
energy consumption data for every building in
Dublin City, and therefore a methodology was The geographical breakdown of ‘Small Areas’ are
devised in order to estimate energy use in every used as the geographical boundaries for spatially
building based on best available evidence based mapping the energy data. A Small Area (SA) is an
data, and attach this information to a geographic area of population comprising between 50 and
location to visualise it spatially. The methodology 200 dwellings, created for Ordnance Survey
was developed by Codema for South Dublin Ireland (OSI) and the CSO, and is designed as the
County Council’s SEDA, which was the first of its lowest level of geography for the compilation of
kind to be developed in Ireland, and this analysis statistics. An example of a map showing the
follows the same methodological process. The data outlines of SAs within Dublin City can be seen in
is accumulated and analysed through the use of Figure 3 below. This breakdown is much smaller
MS Excel software and mapped using QGIS open- than the Electoral Divisions, with 2202 SAs in total
source mapping software. in Dublin City, and this allows the mapping of
energy data at the most detailed level available.
From analyses of spatial demand mapping Also, the area in km2 of each SA is used to show
practices in other countries, and the availability of the energy and heat consumption density in each
matching data across all sectors, the main sets of SA which is crucial for energy planning.
energy data which will be created and mapped
are:
Total Energy Demand
Analysis of District Heating Potential
Total Heat Demand The heat consumption will also be shown in terms
Heat Demand Density of ‘heat density’, as the areas mapped vary in size
Total Electricity Use and it is important to compare all on an equal
Total Fossil Fuel Use parameter, such as terajoules (TJ) per km2.
Total Annual Energy Costs Mapping heat density is important as it is a key
metric for defining the potential for large scale DH.
Figure 3: Maps Showing Examples of Small Area (SA) Breakdown in Dublin City
15Dublin City Spatial Energy Demand Analysis
DH is a particularly relevant technology to consider With a DH system there is opportunity to use heat
for Dublin City as it is a dense urban area with from one or many sources, which may or may not
little unoccupied space, meaning the rely on the location’s characteristics. Fuel can be
implementation of many RE technologies such as imported in most cases to fuel boilers or CHP units,
wind farms is limited. DH on the other hand is but will be better placed if close to major road
particularly suited to dense urban areas and is networks for oil or biomass deliveries. Waste
therefore an ideal urban solution to increase heat2, mainly sourced from industrial processes, is
energy efficiency and enable higher levels of an ideal input into DH systems as it is a potentially
urban RE integration. Dublin City Council is low cost source and utilises energy that would
currently involved in a project which will see a otherwise be considered a loss, therefore
large Waste to Energy (WtE) plant built within the increasing efficiencies. There are likely to be many
city boundaries in the coming years. This plant will industrial process waste heat resources in the city,
create electricity from waste collected in Dublin, such as waste heat from existing power plants,
which would normally have been destined for breweries and waste water treatment plants, and
landfill. The plant design allows operation in the potential to use such resources in Dublin City
Combined Heat and Power (CHP) mode, meaning should be investigated further. Other low cost fuels
this could be a major heat source for Dublin City, for DH systems can come from geothermal sources,
with peak thermal output estimated at 110MW. heat pumps or solar thermal farms which are now
common-practice solutions in Danish low
It is also important to analyse DH potential as temperature DH systems. Smart grid enabled
heating and cooling are fundamentally local and electric boilers and heat pumps incorporated in DH
regional matters, and are often not dealt with supply systems which are timed to switch on/off
effectively at a national level. Danish municipalities when electricity prices are low/high can take
carry out heat planning studies and judge an area advantage of low electricity costs and also help to
to be suitable for DH based on the measurement of integrate more fluctuating renewable energy on the
heat density, usually given in TJ/km2, with any grid.
areas measuring above 150TJ/km2 deemed
technically and economically suitable for
Local Electricity Production Potential
developing conventional DH systems. The density is
specifically important for DH economic viability as The regulations in Ireland forbid the provision of
it becomes cheaper to implement when buildings what is termed a ‘private wire network’. This
are closer together due to shorter pipelines means that you may not supply electricity to other
requiring less investment costs, and therefore the buildings which are not on the same property as
system becomes more cost-effective than individual the building which is producing the electricity. This
solutions (Connolly, et al., 2014). Also, shorter means, if a building is producing electricity and
pipelines result in fewer losses and less pumping there is a surplus to what they require to cover their
requirements, which can reduce running costs own demand, they must release this surplus
significantly. electricity through the national grid, or store in
some way for their own future use. There are
There are currently no large scale DH systems in possibilities for large producers to establish
Ireland, and little or no financial or policy supports contracts and sell this surplus to the grid, but there
for DH systems. Due to this lack of experience, and is currently no electricity supplier offering
difference in support mechanisms between payments3 for surplus energy to micro-generation4
Denmark and Ireland, it is better to look to first- units.
phase development of large scale DH in areas with
the highest heat demand densities available. The
Danish 150 TJ/km2 threshold can then be used 2
Waste heat is heat which is lost to the atmosphere during
once a large scale DH scheme has been initiated industrial and manufacturing processes, rather than heat
and looking to expand. Increasing the minimum obtained from waste.
3
density threshold for viability will also allow for There was a payment available through application to the
potential errors in energy estimations made in this ESB for micro-generation, but this scheme ceased in December
2014.
study. 4
Micro-generation is termed as generators rated up to 25
Amps on single-phase systems (most household systems are
single-phase) or 16Amps on 3-phase systems (ESB, 2015).
16Dublin City Spatial Energy Demand Analysis
This means, when analysing electricity demand of and new buildings with mixed use such as hotels,
buildings and possible local sustainable solutions offices, retail and apartments, are more suited to
to meeting this demand, it will be in terms of development of large scale heating and cooling
individual systems per building rather than in terms networks. Although there will be numerous building
of group electricity schemes. This limits the owners and facilities managers involved, these
possibilities for technologies such as CHP units as building types are likely to be accustomed to the
they will be more suited to industrial or large processes involved in procuring energy services
commercial consumers who have large electrical and therefore will be more likely to engage in
and heating requirements, and who can apply for projects offering energy savings.
grid connections, or in large district heating
systems where the sale of electricity to the grid can Once these areas have been defined as suitable
help to offset the costs of heat production. for individual or group energy schemes, the energy
character areas can be defined further by
In terms of individual building renewable electricity overlaying renewable energy potential mapping in
solutions, the main technologies used which are at order to see which areas are most suitable for
an advanced stage are wind turbines, solar development of RE supply. For example, areas
photovoltaic (PV) panels and hydro-power turbines. suitable for group energy schemes which are
The potential to use these technologies will depend located in peripheral semi-rural areas may be
on the buildings location in terms of space for wind situated close to bio-fuel supplies produced within
turbines and wind speeds, south-facing roof space the region, and can therefore agree long term
and over-shading, and proximity to a suitable supply contracts with local suppliers and benefit
hydro source, respectively. Biomass-fed CHP units from low transport costs.
are another alternative to producing renewable
electricity, and are not dependent on locational It is important to note that the resulting specific
characteristics, as biomass can be imported like energy characteristics of each small area will have
any other fuel. Again, biomass CHP units are more a different best-fit energy solution, which may
suited to commercial or industrial circumstances incorporate energy savings and/or a mixture of
than households due to high upfront costs and the technologies. There is no one definitive energy
size of demand needed to ensure economic solution that is applicable to all areas, and once
viability. an area is identified for further investigation it is
important that all available solutions are evaluated
in terms of socio-economic cost-benefits. The main
Energy Character Areas
attributes to consider when assessing the economic
Energy demand mapping is used as a tool in feasibility of implementing various energy solutions
energy planning to define energy character areas. will be the availability and suitability of low cost
The individual energy characteristics of an area renewable sources in the area, the cost to retrofit
are used by planners to define the appropriate current energy systems, and the current and
energy solutions or planning policies to be predicted future costs of the fuel source being
considered for strategic development zones, local replaced.
area plans or county-wide development plans.
All energy data used in this SEDA is based on
For example, an area with mature residential delivered energy and not primary energy
dwellings in low density suburbs can often have consumption, and therefore losses involved in
poor thermal performance and therefore high heat delivering the energy, i.e. electricity transmission
demands per building. In most cases, these areas grid losses, are not accounted for. Spatial energy
have little variety of building use and many demand in terms of agricultural land use has not
different building owners, which make it less been taken into account due to the lack of energy-
favourable for communal energy solutions and related data available for the agricultural land, but
more suited to individual micro-generation the amount of agricultural land in the Dublin City
technologies such as solar thermal and heat area is negligible.
pumps.
The following sections in this chapter outline the
In contrast, town centres or areas of regeneration results and methodologies of each area of energy
which have a high building density made up of old use, namely residential, commercial and municipal
17Dublin City Spatial Energy Demand Analysis
building energy, and the overall total energy use in
Dublin City.
18Dublin City Spatial Energy Demand Analysis
Residential Sector Energy In order to attach energy data to the housing
breakdown, the National BER Research Tool
database6 from the SEAI was used to find an
Methodology average energy profile of each housing type and
housing age in each area within Dublin City. The
Two main datasets which provide high levels of
BERs only assess the energy requirements of the
accuracy and detail are used in order to estimate
building itself and do not take into account
the energy use in each dwelling in Dublin City;
electricity used for various appliances, therefore
they are the National Census from the Central
additional electricity use associated with appliance
Statistics Office (CSO) and the National BER
use has been applied based on figures from the
Research Tool from the SEAI. At the time of the last
SEAI’s Energy in the Residential Sector 2013
Census in 2011, there were 207,847 permanent
report (SEAI, 2013 (b)).
private households in Dublin City. Some of these
dwellings are listed as vacant, but are assumed to
The BER dataset has been broken down into 16
now be occupied due to increased demand for
Dublin City postcodes, four housing types
housing, and as such have energy consumption
(detached, semi-detached, terraced and
attributed. There have been additional dwellings
apartments), and seven building periods, with
built in Dublin City since 2011, but so few that it
periods chosen to match those grouped by the
does not affect the results5.
CSO. There were over 72,000 BERs analysed and
448 subsets of data created to establish 448
The CSO provided special tabulations which gave
average energy profiles to represent the variety of
the number of dwellings by period built and type
housing types, ages and locations. These profiles
of dwelling in each of the 2,202 small areas in
where then applied to the CSO data breakdown.
Dublin City. These attributes have a significant
impact on the theoretical energy use per dwelling
The representation of BERs in each postcode area
due to floor area size and exposed external wall
is shown in Table 1. Overall there is a 35%
area which vary according to dwelling type, i.e.
representation of BERs to total dwellings in Dublin
detached house or apartment, and the building
City. Some postcode areas overlap outside of the
regulations requirements in place and materials
Dublin City area, particularly Dublin 13, 17, 20
and technology available at the time of
and 6W, and so there is a higher representation of
construction.
BERs in these areas as they include BERs within
other county areas, which is unavoidable. This is
In line with data protection, the CSO was required
not an issue in terms of accuracy in energy
to ‘hide’ data where the breakdown could possibly
estimates as a household will not use more or less
allow identification of individual households. In
energy because it is on one side or another of a
these cases, the CSO gave a figure of ‘Dublin City Spatial Energy Demand Analysis
The dwellings found in the G rated SA on the
Number % bottom left of Figure 5, are situated around the
Number of Number Represent- Belvedere college area. There are 135 dwellings,
Postcode of SA Dwellings of BERs ation 128 of these are very small apartments/flats and
1 98 8,484 5,094 60 120 were built pre-1970. The cost of keeping
2 101 8,524 2,900 34 these dwellings heated sufficiently is estimated to
3 145 13,560 4,791 35 be €1318/year/dwelling. The other G rated area
4 147 13,090 6,435 49
in Figure 5 is again made up of apartments, and
5 179 17,174 4,350 25
these are based in converted old 4-storey housing
6 199 17,432 5,080 29
along the North Circular Road. These areas should
7 251 21,911 6,401 29
be priority target areas for energy efficiency
8 227 20,656 8,109 39
measures or included in schemes such as the Better
9 201 18,820 5,592 30
10 61 6,104 2,005 33
Energy Communities from the SEAI.
11 221 20,366 6,372 31
12 166 16,235 4,833 30
13 75 7,593 3,336 44
17 63 6,256 3,058 49
20 15 1,322 1,221 92
6W 53 4,941 2,520 51
Total 2,202 202,468 72,097 36
Table 1: Representation of BERs in Each Postcode Area
Results
BER Analysis
Due to the detailed level of data available and
analysis, the results of the spatial energy demand
analysis for the residential sector of Dublin City has
produced many interesting energy maps. A BER
has been calculated for each dwelling in Dublin
City, and a map showing the average BER in each
SA can be seen in Figure 6 (next page). The Figure 4: Average C ratings (Green) in areas around the
newly developed Dublin Docklands Area
highest average BER is a C, which is found in
areas of recent development, such as new
apartment complexes built around Heuston South
Quarter, the Fatima area in Rialto, the Dublin
Docklands, and new housing developments on the
outskirts of the city near Park West, Ballymun,
Belmayne and Clongriffin.
The most common BER is a middling D rating, with
some of the older areas of the city averaging lower
E and F ratings. These lower ratings are found
around the Liberties and St. James’s Hospital and
stretching out to Drimnagh, Crumlin, Terenure,
Rathmines and Rathgar areas on the south side of
the city, and on the north side, Stoneybatter,
Mountjoy, East Wall and out to Cabra,
Phibsborough, Drumcondra and Marino. There are
two areas which have been found to have the
lowest G rating on average, and these are found
in the north side inner city around North Frederick
Figure 5: Average G ratings (Red) in areas in the older
Street and Dorset Lane off the North Circular Road. north inner city area
20Dublin City Spatial Energy Demand Analysis
Figure 6: Average BER of All Dwellings in Each Small Area
21Dublin City Spatial Energy Demand Analysis
The results of the BER analysis show that, while also highlights areas which may not have very
better building regulations for new builds is large floor areas but still rank high in energy
effectively reducing the energy demands in new usage, and vice versa for areas with large floor
developments, the rest of the city’s dwellings are areas and low energy usage.
becoming older and less efficient, and to really
reduce energy use in the city, these households Energy Costs per Household
need to be retrofitted with sustainable solutions. A The estimated energy costs per household are
real concern is the number of rented dwellings mapped in Figure 9, p. 25. Many areas shown
which have very poor BERs. With escalating rents here with higher than average energy costs
in the city, coupled with increasing energy costs, overlap with areas shown in Figure 7 with high
the affordability of energy in these poorly insulated energy use per household, but there are other
rented dwellings will only increase the number of areas which have high costs, not due to the size of
people suffering from energy poverty. There needs the dwelling, but due to the fuel used for water and
to be more incentives or deterrents introduced to space heating, and efficiencies of heating systems.
enable landlords to make their properties more The main fuel used for household space heating in
energy efficient and less costly to keep warm. Dublin City is natural gas, but many apartments
are electrically heated using storage heating units
Energy Use per Household and some households have oil boilers due to
The next map, Figure 7, p. 23, shows the average distance from the gas grid. Many households also
energy use per dwelling in kilowatt-hours (kWh). have electric showers or electric immersions for hot
The green and dark green areas have low energy water.
use per dwelling, with the light yellow band
representing the average energy use in Dublin City The fuel prices used in this analysis are based on
which is between approximately 20,000 and SEAI’s Domestic Fuel Cost Comparisons (April
25,000 kWh. In comparison, the national average 2015), and electricity and gas prices per kWh
energy use per household is around 20,000 kWh have been applied to each household according to
(SEAI, 2013 (b)), meaning Dublin City is slightly the usage price bands. Domestic electricity rates in
above the national average. Ireland are the second highest in Europe, and
fourth highest when all taxes and levies are
The inner city area has quite low energy use per included, just behind Denmark, Germany and
dwelling in comparison to the rest of the city, due Cyprus (S2 2014) (eurostat, 2015). Oil fuel costs
to the fact the dwellings in this area are much used to be more expensive than natural gas, but
smaller, comprising mainly of apartments or small the price has dropped recently and now oil is close
terraced housing, and can accommodate fewer to the same cost per kWh of gas.
inhabitants. The newly developed areas which
have good BERs are shown here again to have low The areas in dark green have very high energy
energy use per dwelling, even though some of costs, but are mainly found in more affluent areas
these areas have larger dwellings than those found with large housing units and which can
in the inner city. The areas of orange and red have accommodate many occupants per dwelling to
above average use per dwelling, and in some share these costs. The lighter green areas have
cases nearly double the average energy use of a lower costs, but are still relatively high per
Dublin City dwelling. These areas have some of the household, with many smaller households paying
largest and oldest dwellings found in the city, and over €2,000 per year for energy. These costs can
are mainly found in the south-side suburbs in areas make up a large part of a households’ annual
such as Kimmage, Terenure, Rathgar, Clonskeagh, income, and can cause households to be without
Donnybrook and Blackrock, with some areas in heat in the winter season. There are 81 small
Marino and Clontarf on the north-side of the City areas identified which have annual energy costs
also showing high energy use per dwelling. To per dwelling above €2,000 per year and have
compare with average floor areas, Figure 8, shows floor areas smaller than 80m2. These areas all
the average floor area of dwellings within each have low E and F BERs, and are found mainly in
small area. It can be seen that there is an obvious the inner city area around the Merchants Quay,
overlap between the areas highlighted here and Inns Quay, Arran Quay and Ushers Quay areas.
those with high energy use per household, but it
22Dublin City Spatial Energy Demand Analysis
Figure 7: Average Annual Energy Use per Dwelling in Each Small Area
23Dublin City Spatial Energy Demand Analysis
Figure 8: Average Floor Area of Dwellings in Each Small Area
24Dublin City Spatial Energy Demand Analysis
Figure 9: Average Annual Energy Costs per Dwelling in Each Small Area
25Dublin City Spatial Energy Demand Analysis
Areas with High Risk of Energy Poverty highest levels of unemployment, are found in the
There is much difficulty in defining energy poverty Arran Quay and Merchants Quay areas. This
and how to target those worst affected, as recently method of targeting takes into account ability to
outlined in the Department of Communications, pay for energy and energy efficiency ratings.
Energy and Natural Resources’ (DCENR)
consultation paper on a new affordable energy When cost is also taken into consideration, 25 of
strategy (DCENR, January 2015). Someone the 70 small areas have energy costs greater than
suffering from what is termed energy poverty is €1,600 per year, and three areas have energy
said to be unable to heat or power their home to costs over €2,000 per year. This means the areas
an adequate degree. Three factors which influence at risk can be further broken down to target those
this are: household income, cost of energy, and most in need first, and the top ten areas most at
energy efficiency of the home. Without knowing risk based on energy efficiency of dwellings,
the income levels in each small area to compare ability to pay for energy and estimated costs of
with estimated costs from this analysis, the best energy per dwelling, can be seen in Table 28.
way to try to map areas most at risk of energy There are 865 households in these most at risk
poverty is to overlap the known data and compare areas in total, and it is recommended that further
the energy efficiency levels of homes with levels of analysis is carried out on these households in order
unemployment in each small area7. to find the best-fit solution to reducing the energy
demand and energy costs to these households, and
A map showing the small areas in Dublin City most include this housing in future energy efficiency
at risk of energy poverty, based on poor energy retrofit schemes.
efficiency of the home, i.e. low BER, and high
levels of people who are unemployed or unable to Total Residential Sector Energy Demand
work, are shown in yellow in Figure 10, p.28. The The total annual energy demand, total annual
areas in yellow are those with an average BER electricity demand and total annual fossil fuel
rating of E or lower and with demand of the residential sector are shown in
unemployment/unable to work levels above 30%. Figure 11, Figure 12, and Figure 13. The total
The pink to purple areas show levels of energy demand map shows the areas in Dublin
unemployed or unable to work in each small area City most responsible for the energy use of the
across the entire city taken directly from census residential sector. These areas should be targeted
data. 70 small areas, which cover approximately for energy efficiency awareness campaigns and
5,785 dwellings, are identified as having a high education on renewable energy solutions for
risk of energy poverty. Of these, the worst areas households. The energy demand is also broken
affected, those with the lowest BERs and the down into electricity demand and fossil fuel
demand to show areas
Annual Energy % Unemployed which can be targeted for
Electoral Small Area Number of Cost per or Unable to different renewable energy
District Code Households BER Household (€) Work solutions.
Kilmore B 268089008 69 E1 1839 37
Finglas North A 268063007 62 E1 1905 31 Areas with high electricity
Decies 268057007 109 E1 1797 31 usage can be prioritised for
Kilmainham A 268083003 102 E1 1792 31 rooftop PV installations, or
Ashtown B 268007012 69 E1 2084 49 in some suitable cases
Ballybough B 268010005 101 E2 1856 31 micro-hydro or micro-wind
Cabra West A 268033003 97 F 2074 30 power, to offset some of
Arran Quay B 268002008 58 E1 2034 44 their electricity usage.
Ballybough B 268010006 103 E1 1848 41 Households with electrical
Cabra East B 268031012 95 F 1957 33 heating systems such as
Table 2: Top Ten Areas Most at Risk of Energy Poverty storage heating should
consider replacing old systems with new, high
7
The data for unemployed or unable to work comes from the efficiency smart electricity storage systems or
2011 Census, and there is no more recent data available at a
small area level. The Census is due to be updated next year in
8
2016, and so these figures can then be updated and better See appendix for map outlining location of and small area
reflect the upturn in the economy since 2011. breakdown in each Electoral District.
26You can also read