Drivers of Biomass and Biodiversity of Non-Chemosynthetic Benthic Fauna of the Mid-Atlantic Ridge in the North Atlantic
←
→
Page content transcription
If your browser does not render page correctly, please read the page content below

ORIGINAL RESEARCH
                                                                                                                                                published: 05 April 2022
                                                                                                                                       doi: 10.3389/fmars.2022.866654

                                           Drivers of Biomass and Biodiversity
                                           of Non-Chemosynthetic Benthic
                                           Fauna of the Mid-Atlantic Ridge in
                                           the North Atlantic
                                           Imants G. Priede 1*, Frank E. Muller-Karger 2, Tomasz Niedzielski 3, Andrey V. Gebruk 4,
                                           Daniel O. B. Jones 5 and Ana Colaço 6
                                           1 Oceanlab, Institute of Biological & Environmental Sciences, University of Aberdeen, Aberdeen, United Kingdom, 2 Institute

                                           for Marine Remote Sensing, College of Marine Science, University of South Florida, St Petersburg, FL, United States,
                                           3 Department of Geoinformatics and Cartography, Faculty of Earth Sciences and Environmental Management University of

                                           Wrocław, Wrocław, Poland, 4 Shirshov Institute of Oceanology, Russian Academy of Sciences, Moscow, Russia, 5 National
                                           Oceanography Centre, Southampton, United Kingdom, 6 Instituto de Investigação em Ciências do Mar - Okeanos,
                                           Universidade dos Açores, Horta, Portugal

                         Edited by:
                     Philip Weaver,        We examine the main drivers that may elevate biomass and biodiversity of non-
          Seascape Consultants Ltd.,
                                           chemosynthetic benthic megafauna of the lower bathyal (800-3500m depth) of the
                    United Kingdom
                                           Mid-Atlantic Ridge in the North Atlantic Ocean (MAR). Specifically: 1. Primary
                       Reviewed by:
                Teresa Radziejewska,       production in surface waters (10°-48°N) from remote sensing data 2002-2020 over the
       University of Szczecin, Poland      MAR was not significantly different from abyssal regions to the east and west. We reject
           Jose Angel Alvarez Perez,
 Universidade do Vale do Itajaı´, Brazil   the hypothesis that presence of a mid ocean ridge may enhance surface primary
                   *Correspondence:        production. 2. The quantity of particulate organic matter reaching the sea floor was
                       Imants G. Priede    estimated as a proportion of surface export production scaled by bathymetry. Flux was
                i.g.priede@abdn.ac.uk
                                           1.3 to 3.0 times greater on the MAR as a function of shorter vertical transport distance
                 Specialty section:
                                           from the surface than on adjacent abyssal regions. 3. Depth variation effect on species
       This article was submitted to       richness. Demersal fishes living between 41° and 60°N showed a maximum of
Deep-Sea Environments and Ecology,
                                           species richness at 2000 m depth and linear increase in regional (Gamma) diversity of
              a section of the journal
         Frontiers in Marine Science       32 species per 1,000 m elevation of the MAR above the abyss. Elevated topography
         Received: 31 January 2022         provides niches for species that cannot otherwise survive. 4. Substrate heterogeneity. The
          Accepted: 01 March 2022          MAR >95% covered with soft sediment with frequent hard rocky patches spaced at a
           Published: 05 April 2022
                                           mean nearest neighbour distance of
Priede et al.                                                                                          Mid-Atlantic Ridge Benthic Biomass and Biodiversity

                                           which may be mined for polymetallic sulphide ore deposits. This study enables some
                                           predictions of biomass and biodiversity but there is urgent need for intensive biological
                                           sampling across the MAR throughout the proposed mining areas south of the Azores.
                                           Keywords: mid-ocean ridge, deep-sea, biodiversity, organic carbon flux, sediment fauna, biogeography,
                                           primary production

INTRODUCTION                                                                   Irminger Sea and Iceland Basin (Miller et al., 2013; Tilstone
                                                                               et al., 2014). Here we undertake a more extensive evaluation of
The global mid ocean ridge system is one of the largest                        patterns of primary production and export flux over the MAR
geomorphological features on the planet. It extends over 65,000                between 10° and 48°N.
km through all the major oceans (Searle, 2013). The elevated
seafloor in mid-ocean regions hosts greater biomass and                         Export Production Over the MAR
biodiversity than the surrounding abyssal plains located between               A major pathway for export of primary production from the
3500 - 6500 m depth (UNESCO, 2009; Vecchione et al., 2010).                    surface layers to the deep sea is the continuous rain of particulate
Much attention has been directed to the specialized                            organic carbon (POC). This flux is attenuated with depth by
chemosynthetically sustained communities living on                             consumption, respiration, and remineralization in the water
hydrothermal vent systems distributed along the ridge axis (Van                column so that typically only 1-5% of export production
Dover, 2000). However, most of the biomass on the ridge system is              reaches abyssal depths (Deuser et al., 1990; Lampitt and Antia,
dependent on the sinking export of particulate organic matter                  1997; Smith et al., 2009). Muller-Karger et al. (2005) quantified
derived from plankton production occurring in the sunlit surface               the global POC flux arriving on the sea floor and buried in the
layers of the ocean (Priede et al., 2013a). This photosynthetically            sediments by estimating the net primary production (NPP) from
dependent fauna comprises representatives of all forms of deep-                remote sensing data and applying a depth-dependent
sea life, including interstitial and burrowing species living in               exponential decay model. This analysis showed the importance
sediments, surface browsers, sessile species attached to hard                  of shallow ocean margins for carbon sequestration in the context
substrates, and predators on and above the sea floor.                           of the global ocean carbon cycle. Here we extend this model to
    Here we consider the diversity and abundance of sessile and                estimate the magnitude and variability of the sinking POC flux
mobile megafauna including demersal fishes living at lower                      on the MAR compared with surrounding abyssal areas. We also
bathyal depths (800-3500 m) as defined by UNESCO (2009).                        examine the potential influence of this deep sea POC flux on
Although the energy source for this fauna is export production                 benthic biomass.
from the surface, how this is transformed into biomass and
diversity is determined by factors related to the topography of the            Depth Variability in the MAR
MAR and processes of colonisation. Patterns of primary                         Deep-sea animals generally have preferred depths resulting in
production in the surface layers and export of organic carbon                  restricted distributions within narrow depth ranges due to
to the seafloor can be regarded as fundamental drivers. Elevation               hydrostatic pressure tolerance (Macdonald, 2021) and
of the sea floor, diversity of substrates, hydrography and                      hydrographic conditions, bottom substrate and interspecific
biographic considerations are additional drivers that support                  competition (Rowe and Menzies, 1969; King et al., 2006).
enhanced benthic biomass and biodiversity on the MAR                           Perez et al. (2020) show that on the São Paulo Ridge in the
compared with the adjacent abyssal plains. Our study focusses                  SW Atlantic topography-related deep-water flow dynamics and
on following main drivers                                                      interfaces between water masses at different depths are the main
                                                                               drivers of benthic megafauna distribution. Living cold water
Primary Production in Surface Waters                                           corals occur within a narrow range seawater density found at
Over the MAR                                                                   particular depths in the NE Atlantic (Dullo et al., 2008) and
Water flow around oceanic islands (Pollard et al., 2007) and                    aggregations of zooplankton and fish tend to occur over abrupt
seamounts (White et al., 2008) can result in advection of                      topographies (Genin, 2004). In some cases, there are
nutrients to surface layers, enhancing primary production and                  fundamental physiological depth limitations, for example
increased export flux to the deep-sea floor. However, White et al.               amongst fishes few sharks can survive at depths greater than
(2008) point out that evidence for enhancement effects over                    3000 m (Priede et al., 2006; Treberg and Speers-Roesch, 2016).
seamounts is highly variable and inconclusive. Furthermore,                    On continental slopes these depth limits result in species
phytoplankton blooms in the vicinity of islands occur at some                  turnover, or species replacement along the depth gradient
distance from the islands themselves as nutrients are carried                  hence increasing Beta diversity (Rex and Etter, 2010). On
downstream on prevailing currents (Pollard et al., 2007; Messié               continental slopes, both invertebrates (Rex and Etter, 2010)
et al., 2020). Over the relatively shallow northern Reykjanes                  and fishes (Priede et al., 2010) show a maximum of species
segment of the MAR, there is evidence of localised elevated                    diversity at mid-slope depths. Here we analyse the trends in
primary production compared with the adjacent Central                          biodiversity with depth on the Mid-Atlantic Ridge.

Frontiers in Marine Science | www.frontiersin.org                          2                                       April 2022 | Volume 9 | Article 866654
Priede et al.                                                                                     Mid-Atlantic Ridge Benthic Biomass and Biodiversity

Substrate Heterogeneity on the MAR                                       availability of ocean colour satellite data products with seasons
The MAR is an undersea mountain range, but despite the rugged            (see below). The MAR area to the north has been the subject of
topography, Niedzielski et al. (2013) found that between 42° and         extensive previous research (Read et al., 2010; Miller et al., 2013;
56°N it is 95% sediment covered with relatively smooth contours          Tilstone et al., 2014). The part of the MAR between 12°N and
including flat terraces. The slow seafloor spreading rate at the           33°N which is being explored for mining of polymetallic
MAR (Searle, 2013) has allowed 50-250 m thick sediment to                sulphides under the auspices of the International Seabed
accumulate on the MAR (Straume et al., 2019) at a rate of a few          Authority (Billett et al., 2019) is within this area examined
centimetres per year (Restreppo et al., 2020) obscuring most of          using satellite data, but we have limited data on the benthic
the underlying hard oceanic crust. Riehl et al. (2020) highlight         fauna for this region.
the importance of relatively rare exposed abyssal rock patches               The rest of the analyses in this paper are largely derived from
that can support sessile deep-sea fauna such as Bryozoa, Porifera,       two major studies carried out on the MAR as part of the Census
or Cnidaria. They estimate that fracture zones provide over              of Marine Life: MAR-ECO and ECOMAR. MAR-ECO sampled
260,000 km2 of hard rock habitat, equivalent to ca. 0.5% of              the area of the MAR between the Azores and Iceland during
area in the deep North Atlantic. Niedzielski et al. (2013) found         expeditions from different nations including a two-month
that 4% of the MAR was exposed hard rock, including vertical             voyage by the Norwegian RV GO Sars in 2004 (Bergstad et al.,
cliffs and rocky outcrops, providing a greater area of hard              2008a; Vecchione et al., 2010). ECOMAR contributed to MAR-
substrate than available on the surrounding abyssal plains.              ECO with voyages by the UK RRS James Cook focussing on two
Here we extend this analysis to examine the spatial                      transects across the MAR at ca. 49°N and 54°N, south and north
distribution of rocky patches to evaluate whether colonisation           of the Charlie-Gibbs Fracture Zone respectively during 2007-
by sessile fauna is enhanced by reduced dispersal distances and          2010 (Gebruk et al., 2013; Priede et al., 2013b).
hence greater connectivity between suitable habitats.                        The distribution of demersal fish species is analysed in detail
                                                                         because for this component of the bottom fauna there is data
Biogeographic Overlap Zones in and                                       available over the greatest depth range (Porteiro et al., 2017).
                                                                         This analysis is combined with a new assessment of the
Around the MAR
                                                                         distribution of substrate patches in this area of the MAR from
Dispersal of benthic species from the continental slope into the
                                                                         42° to 56°N. Aspects of the benthic megafauna on different
open ocean (on island slopes, seamounts, and mid-ocean ridges)
                                                                         substrates surveyed by MAR-ECO and ECOMAR are discussed
may occur in two stages (Mironov, 2014; Mironov et al., 2015):
                                                                         with reference to previous publications (Gebruk, 2008; Gebruk
first, dispersal goes along the continental slope, and second, some
                                                                         et al., 2010; Alt et al., 2013; Bell et al., 2013; Gebruk et al., 2013;
species with adaptations to the open-ocean environment disperse
                                                                         Jones et al., 2013; Bell et al., 2016; Alt et al., 2019) but no new
from the near-continental zone into the open ocean. There are
                                                                         analyses are presented.
significant differences in the near-continental environment and
the environment of the open ocean. For example, in the open
ocean there is a decrease in the amount of organic matter, both in
the water column and in sediments (Sokolova, 2000) as well as            MATERIALS AND METHODS
discontinuities in substrate composition at certain slope depths.
As a result, the number of bathyal species decreases beyond a            Net Primary Production and Particulate
maximum diversity depth in the near-continental zone (Rex and            Organic Carbon Flux
Etter, 2010). In the Atlantic Ocean, colonisation occurs from            NPP and POC flux were derived from remote sensing data
continental slopes in the West and in the East, with biodiversity        collected using the NASA Aqua satellite MODIS (Moderate
gradually decreasing towards the open ocean. Where the East              Resolution Imaging Spectro-radiometer) sensor for the North
and West Atlantic faunas meet on the Mid-Atlantic Ridge there            Atlantic between 10° and 48°N. The area to the north of 48°N is
may be an increase in mid-ocean biodiversity. Furthermore, the           not processed by the standard NASA MODIS Ocean colour
distance between the MAR and nearest continental slopes may              algorithms during winter months due to low ocean reflectance
give rise to population isolation and endemism amongst some of           caused by low sun elevations. Time series of monthly (arithmetic)
the fauna. Here we review the evidence for biogeographic mid-            mean regional NPP observations, in units of (gC.m-2.day-1), were
ocean domain effects that may explain biodiversity observed on           extracted from the standard Vertically Generalised Production
the MAR. (Figure 1).                                                     Model (VGPM) (Behrenfeld and Falkowski, 1997) products
                                                                         distributed by the Ocean Productivity program at Oregon State
Scope of this Study                                                      University (Ocean Productivity, 2022). The monthly mean NPP
Here we examine patterns of net primary production (NPP) and             values were based on near-surface chlorophyll concentration,
sinking particulate organic carbon (POC) flux for the part of the         daytime sea surface temperatures, and cloud-corrected incident
MAR between 10° and 48°N using satellite remote sensing. The             daily photosynthetically active radiation (PAR) estimates
area to the south was excluded because it is influenced by                derived from the MODIS sensor (global grid size of 2,160 x
the North Equatorial Current and a strong ocean colour signal            4,320 pixels: MODIS reprocessing version R2018). In order to
from the Amazon River plume (Muller-Karger et al., 1995). The            use a complete time series of NPP products without breaks in
area north of 48° was excluded because of limitations in the             monthly coverage, we used the MODIS VGPM NPP products

Frontiers in Marine Science | www.frontiersin.org                    3                                        April 2022 | Volume 9 | Article 866654
Priede et al.                                                                                              Mid-Atlantic Ridge Benthic Biomass and Biodiversity

 FIGURE 1 | Chart of the North Atlantic Ocean showing the Mid-Atlantic Ridge.

covering 1 August 2002 through 31 July 2020, or 18 complete                            NPP and POC flux data were extracted from the gridded
annual cycles. MODIS suffered a short-lived malfunction that                        global fields to construct several summary time series. For
led to a gap in coverage for August and September 2020, and we                      example, data for each dataset were extracted in transects and
did not use subsequent observations to avoid incomplete                             polygons. Polygons were used to derive monthly mean values
annual cycles in the analyses.                                                      over the geographic area covered by the polygon. Only POC
    Global POC flux to the ocean bottom, in units of (gC m-2                         fluxes in areas deeper than 800 m were included in our analyses,
day-1), was estimated following the approach of Muller-Karger                       while all pixels with valid data were included in similar transects
et al. (2005). We used an exponential decay function of the                         and polygons for the NPP monthly means.
monthly mean gridded MODIS NPP datasets to compute global                              Three polygons were defined: West, MAR, and East
maps of the sinking POC flux using the Pace et al. (1987) model                      (Figure 2) spanning the latitudinal range from 10°N to 48°N.
(i.e., flux(Z) = 3.523*NPP*Z-0.734), where Z are ocean bottom                        The MAR polygon was defined as the region between smoothed
depths at each cell of the NPP grids. Depths were based on the                      boundaries at 3500 m depth west and east of the ridge,
ETOPO1 global relief model of the Earth’s surface. For this study,                  corresponding to lower bathyal with depths shallower than 800
we excluded all data of the ocean bathymetry shallower than 800                     m removed. The West and East polygons represent the abyssal
m. Thus, the area examined follows the widely accepted definition                    regions of the North Atlantic on either side of the ridge from
of “lower bathyal” 800-3500 m (UNESCO, 2009). For the purposes                      3500 m to maximum depth either side of the MAR. To define the
of this analysis, we did not introduce a lag in the POC flux relative                polygons, depth measurements were made at 2.5° latitudinal
to the NPP observations. The commonly accepted average velocity                     intervals except in regions of complex topography (e.g., at
for bulk POC is of the order of 100 m day-1 (Deuser et al., 1990).                  fracture zones) where more frequent points were used.
Since our averaging time step is a month, there is somewhat of a                    Following preliminary inspection of the data, these polygons
smear in the actual settling of particles to the bottom at depths                   were further subdivided into three latitudinal strata, North 48°-
>2,000 m between months. The analysis also does not account for                     40°N, Azores 40°-32.5°N and South 32.5°-10°N. Three transects
episodic rapid settling of massive surface blooms (e.g., Conte et al.,              were also extracted for analysis, specifically two latitudinal
1998; Thunell et al., 2007; Lorenzoni et al., 2012).                                transects at 25°N (58.5°W to 32.5° W) and 47°N (40.25° W to

Frontiers in Marine Science | www.frontiersin.org                               4                                      April 2022 | Volume 9 | Article 866654
Priede et al.                                                                                                        Mid-Atlantic Ridge Benthic Biomass and Biodiversity

 FIGURE 2 | Mean Daily Particulate Organic Carbon Flux (mg C.m-2.day-1) to the sea floor in the North Atlantic calculated for October 2002. The three polygons for
 remote sensing analysis of net primary production (NPP) and particulate organic carbon flux (POC), West, MAR and East are shown together with three latitudinal
 strata, North (NW, N, NE) Azores (AW, A, AE) and South (SW, S, SE). The MAR polygon is defined as the area enclosing lower bathyal depths (3500-800 m depth)
 on either side of the ridge. The West and East polygon outer boundaries correspond to the deepest points either side of the ridge. The thick white lines are latitudinal
 transects at 25°N and 47°N. The thin white line is the axis of the MAR.

14.34° W), and one transect along the axis of the ridge from 48°N                       Steep areas with slope >30° were used as proxies for hard rock
to 10°N.                                                                                patches, since video surveys had shown these to be 66.9%
                                                                                        sediment free.
Demersal Fish Depth Distribution                                                           In order to characterise the empirical distribution of nearest
Data on demersal fish species, including minimum and                                     distances between steep (>30°) slope patches of sea floor, a
maximum depths of occurrence on the Mid-Atlantic Ridge                                  geographic information system (GIS) analysis of sea floor
between the Azores and Iceland (41°-60°N), were extracted                               topography was carried out. Digital elevation models (DEMs)
from the compilation by Porteiro et al. (2017) of fishes                                 of parts of the MAR – i.e. bathymetric data sets acquired during
captured during cruises by the RV G.O. Sars and MS Loran as                             cruises of the RV G.O. Sars in 2004 (Wenneck et al., 2008) and
part of the MAR-ECO programme in 2004. Designation of                                   the RRS James Cook in 2007 (Priede et al., 2013b) – were
demersal species was based on capture in bottom trawls and                              processed in QGIS software v. 3.20.3 Odense. Seven transects,
bottom-set long lines broadly following Bergstad et al. (2008b).                        spatially corresponding to transects 1L–7L presented by
All members of the family Alepocephalidae (slickheads) were                             Niedzielski et al. (2013), were analysed. The data had varying
included plus six species of Platytroctidae (searsids) that were                        spatial resolutions, ranging between 42 and 59 m for RV G.O.
represented in bottom trawls. Platytroctidae are not normally                           Sars (five data sets) and between 99 and 100 m for the RRS James
considered demersal but those included here for analysis are                            Cook (two data sets).
considered to be associated with the MAR on the basis of capture                           Each of seven DEMs was processed separately. First, slope
in bottom trawls (Porteiro et al., 2017) or designation as                              rasters were computed. Second, they were reclassified into new
benthopelagic in Fishbase (Froese and Pauly, 2021). This gave                           rasters with two classes: steep slopes (ones corresponded to
a total of 100 species (Table 3). The maximum depth in Porteiro                         slope values greater than 30°) and flat terrain or non-steep
et al. (2017) is 4300m and in Bergstad et al. (2008b) 3527 m. For                       slopes (zeros corresponded to slope values between 0° and
species with a known distribution at greater depths, their ranges                       30°). Third, the reclassified rasters were converted to vector
were extended according to data for the abyssal North Atlantic                          polygons. Fourth, from the newly produced vector data sets,
presented in Priede et al. (2010), and a maximum depth for one                          polygons coded as ones (steep slopes) were selected, and
species Porogadus miles taken from Fishbase (Froese and                                 therefore vector maps of steep patches were generated. Next,
Pauly, 2021).                                                                           geometries of the resulting vector layers were corrected.
                                                                                        Such data became input to the subsequent nearest
Hard Substrate Distribution Analysis                                                    neighbour analysis.
The analysis of Niedzielski et al. (2013) was extended to evaluate                         To compute nearest distances between steep slope patches,
the distances between adjacent hard rock patches on the MAR.                            geometries of polygons which represented steep slopes were

Frontiers in Marine Science | www.frontiersin.org                                   5                                             April 2022 | Volume 9 | Article 866654
Priede et al.                                                                                               Mid-Atlantic Ridge Benthic Biomass and Biodiversity

approximated by centroids. That was conducted in QGIS                             RESULTS
NNJoin plugin. The same tool was also used to calculate the
nearest distance between the joined features – each steep slope                   Net Primary Production
vector data set was joined with itself, and the approximation of                  For the entire area considered in the North Atlantic between 10° and
geometry by centroids was enabled. For each transect, nearest                     48°N, there was a strong seasonal cycle of NPP. The peak occurred
distances were recorded in a newly created field in the attribute                  predominantly in May-June each year in the North (Figure 3A),
table. The data were exported to XLSX format and then saved as                    March-April in the Azores (Figure 3B), and February-March in the
TXT files. Since the resolutions of the available bathymetric data                 South (Figure 3C). There was strong trend of decrease In NPP from
sets were dissimilar and fitted two groups – (1) the RV G.O. Sars                  North to South, from an overall 18 year mean of 625 mgC.m-2.day-1
(42, 44, 47, 54 and 59 m) and (2) the RRS James Cook (99 and 100                  in the Northern stratum, to 432 mgC.m-2.day-1 around the Azores
m) – the histograms of nearest distances between steep slope                      and 227 mgC.m-2.day-1 in the South. In the Northern stratum there
patches were produced jointly for five transects provided by the                   was no significant difference in NPP between, the West, MAR, and
RV G.O. Sars and jointly for two transects provided by the RRS                    Eastern polygons (Table 1). In the Azores stratum there was no
James Cook.                                                                       significant difference between the West and the MAR polygons but

                                         A

                                         B

                                         C

 FIGURE 3 | Monthly Net Primary Production (NPP) for the years 2002-2020. (A) Northern Stratum 40°-48°N, (B) Azores Stratum 32.5°-40°N, (C) Southern Stratum
 10°-32.5°N. Red line - MAR Polygon, Pink line – West Polygon. Blue line - East Polygon.

Frontiers in Marine Science | www.frontiersin.org                             6                                         April 2022 | Volume 9 | Article 866654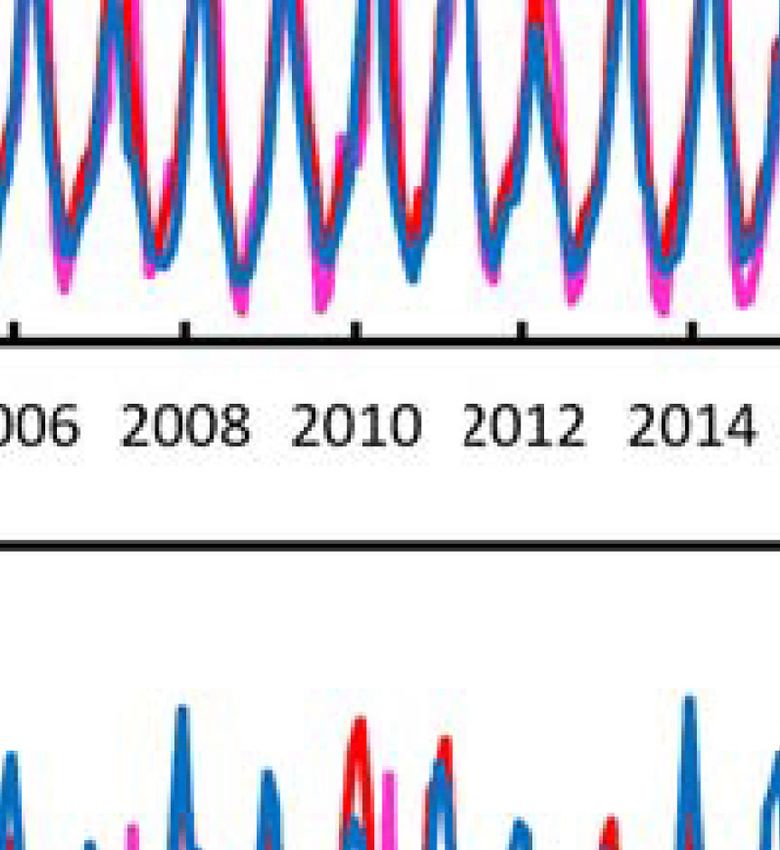
Priede et al.                                                                                                                  Mid-Atlantic Ridge Benthic Biomass and Biodiversity

TABLE 1 | Comparison of surface net primary production (NPP) mg C.m-2.day-1 over the Mid- Atlantic Ridge (MAR) and adjacent abyssal regions West and East during
2002-2020 for the three latitudinal strata shown in Figure 2.

                                                                                 Northern Stratum

                                                           West                                                      MAR                                                    East

Mean                                                    630.62                                                      613.36                                                 631.46
SD                                                      40.01                                                       53.48                                                   75.92
                                                                                                                      P                                                  Significance
ANOVA                                                                                                                0.60                                                    NS

                                                                                  Azores Stratum

                                                        West                                                         MAR                                                    East

Mean                                                    442.67                                                      448.30                                                 406.49
SD                                                      23.56                                                       27.58                                                   26.59
                                                                                                                      P                                                  Significance
ANOVA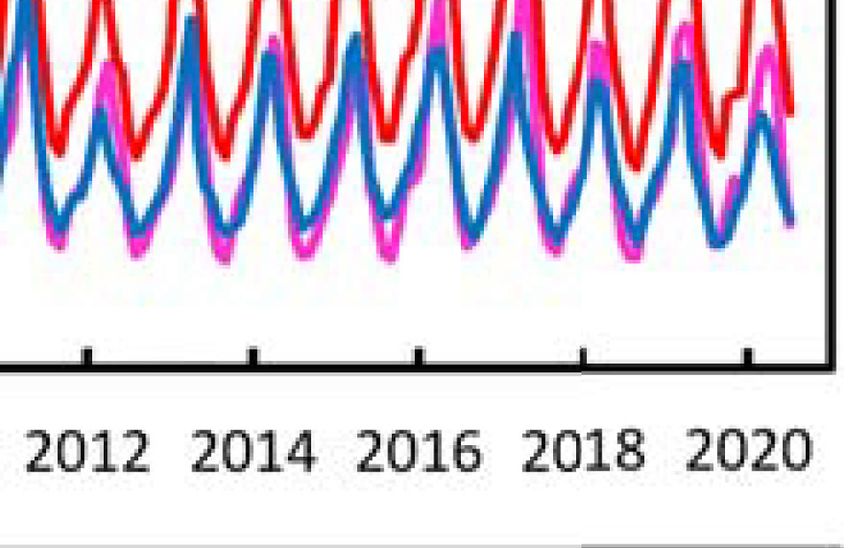
Priede et al.                                                                                               Mid-Atlantic Ridge Benthic Biomass and Biodiversity

                                         A

                                         B

 FIGURE 4 | Mean NPP and POC Flux during the years 2002-2020 along transects across the MAR at 47°N (A) and 25°N (B). The horizontal black line indicates
 3500 m depth, the boundary of the lower bathyal zone.

itself. These included five Platytroctids, one Alepocephalid                           Twenty species of Chondrichthyes were caught including
(Xenodermichthys copei), one macrourid (Coryphaenoides                            Chimaeras, Sharks, and Rays distributed from the ridge
rupestris) and the wolffish (Anarhichas denticulatus). Of the                      summit down to a maximum bottom depth of 3366 m, where
shallowest twenty species associated with summits of the MAR,                     the Leafscale gulper shark (Centrophorus squamosus) and Pale
the majority, 18 were benthopelagic. Furthermore, benthopelagic                   ray (Bathyraja pallida) were recorded. Twenty-one families of
species were found at all depths comprising 35% of species                        teleosts were recorded, the most speciose being: Macrouridae (18
ranked >20. Overall, 47% of species were benthopelagic.                           species), Alepocephalidae (17 species), Moridae (7 species),
    Demersal species richness shows a peak of over 50 species                     Ophidiidae (6 species) and Platytroctidae (6 species).
present at 2000 m (Figure 8A). Examining this in cumulative
form (Figure 8B) the total number of species increases with
height of the ridge. Fitting a linear relationship from 1000 to 4000              Hard Substrate Distribution Analysis
m depth predicts, 2.5 species were present at 4000m, 35 species up to             The bathymetric surveys comprised a series of transects across
3000m, 67 species up to 2000 m and 99 species up to 1000 m.                       the summit of the MAR at latitudes from 41.5°N to 56°N

Frontiers in Marine Science | www.frontiersin.org                             8                                         April 2022 | Volume 9 | Article 866654
Priede et al.                                                                                                 Mid-Atlantic Ridge Benthic Biomass and Biodiversity

                                          A

                                          B

                                          C

 FIGURE 5 | Monthly Particulate Organic Carbon Flux (POC Flux) reaching the sea floor for the years 2002-2020. (A) Northern Stratum 40°-48°N, (B) Azores
 Stratum 32.5°-40°N, (C) Southern Stratum 10°-32.5°N. Red line - MAR Polygon, Pink line – West Polygon. Blue line - East Polygon.

withinthe region between the Azores and the Reykjanes Ridge                        DISCUSSION
(Niedzielski et al., 2013). Within this area, 11,237 discrete
patches of steep terrain with slope > 30° were identified                           Net Primary Production and Particulate
which corresponds to 0.91 steep patches km -2 over an                              Organic Carbon Flux Over the MAR
estimated total survey area of 10,268 km2. Niedzielski et al.                      The mean net primary production (NPP) on the MAR (3,500 -800
(2013) estimate that within each patch, an average of 67% of the                   m depth) was not significantly different from that in adjacent
area would be exposed hard rock. The mean nearest neighbour                        waters over the abyssal regions (>3500 m depth) either side of the
distance between patches was 409 m (SD 454 m) for the RRS                          ridge. Therefore, the hypothesis that the presence of the ridge
James Cook data, and 199 m (SD 268 m) for the RV GO Sars                           directly enhances surface productivity is rejected. In the NE
data (Figure 9). The medians were 266 and 127 m respectively,                      Atlantic, significant spring enhancement of primary production
and the most isolated patch in the combined data set was 10,595                    has been observed over the Gorringe seamount, where the summit
m from its nearest neighbour. The overwhelming majority                            is in the photic zone, about 30 m below the surface (Oliveira et al.,
of nearest neighbour distances were less than 1,000 m; 91.9%                       2016). In a global analysis, based on remote sensing over
and 98.7% for the RRS James Cook and RV GO Sars                                    seamounts, Leitner et al. (2020) found evidence of long-term
data respectively.                                                                 decadal time-scale persistent surface chlorophyll enhancement in

Frontiers in Marine Science | www.frontiersin.org                              9                                          April 2022 | Volume 9 | Article 866654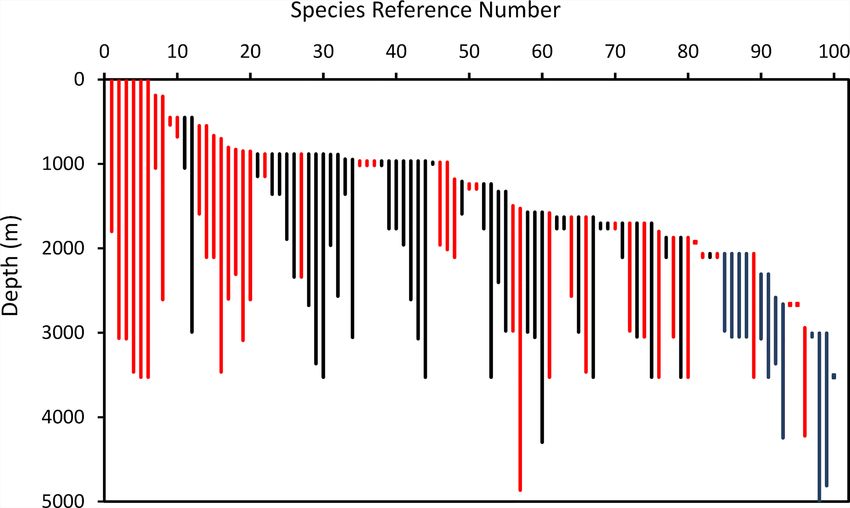
Priede et al.                                                                                                                  Mid-Atlantic Ridge Benthic Biomass and Biodiversity

TABLE 2 | Comparison of particulate organic carbon flux (POC Flux) mgC.m-2.day-1 over the Mid- Atlantic Ridge (MAR) and adjacent abyssal regions West and East
during 2002-2020 for the three latitudinal strata shown in Figure 2.

                                                                                  Northern Stratum

                                                            West                                                     MAR                                                   East

Mean                                                      4.85                                                       6.49                                                 5.08
SD                                                        0.31                                                       0.57                                                 0.62
                                                                                                                       P                                               Significance
ANOVA
Priede et al. Mid-Atlantic Ridge Benthic Biomass and Biodiversity
FIGURE 7 | Depth ranges of 100 species of demersal (black) and benthopelagic (red) fishes on the North Mid- Atlantic Ridge, ranked in order of minimum depth of
occurrence. (The key to species is in Table 3).
sea floor of the MAR and the shorter vertical distance over which decline towards abyssal depths. This is similar to patterns
POC flux is attenuated with depth. Increased supply of organic described for a variety of taxa on continental slopes including
carbon is likely to support higher biomass and abundance of gastropods, polychaetes, bivalves, cumaceans, invertebrate
benthic fauna. megafauna and fish (Rex, 1981). A maximum of species
After initial colonisation of a hypothetical new segment of richness at mid-slope depths is a widespread phenomenon
ridge, there is probably a positive feedback effect further (Gage and Tyler, 1991). For demersal fishes in the NE Atlantic
increasing biomass through active biological processes. For on the slopes of the Porcupine Seabight, Priede et al. (2010)
example, near the summits most of the demersal fishes present found a species richness maximum at around 1,500 m depth. The
are bentho-pelagic species (Figure 7) which actively forage in the diversity maximum on the MAR is at greater depth than on the
water column over the ridge capturing prey in the mesopelagic slopes, possibly reflecting absence of habitat at shallow depths on
and surface layers, thus actively transporting additional organic the MAR.
matter to the MAR. Many invertebrates including sessile fauna The total number of demersal fish species present across the
such as corals as well as mobile species capture planktonic and MAR in the North Atlantic (100 species) is close to that observed
nektonic prey from the waters surrounding the MAR. These in the Porcupine Seabight (108). However, the present dataset for
active processes may be particularly enhanced by the vast pelagic the MAR spans a wide latitudinal range (41°-60°N) with some
biomass of the deep-scattering layers impinging on MAR species only occurring in part of the survey area. For example,
particularly during their diurnal descent to their maximum Macrourus berglax is mainly a northern species, whereas
depth (Genin et al., 1994; Fock et al., 2002). Histiobranchus bathybius only occurs south of 52°N.
There is a trend of decrease in POC flux from North to South Bergstad et al, (2008b) suggested that some species may be
(Figures 2, 4–6). According to the Longhurst (1998) exclusively observed either on the Western or Eastern slope of
biogeographic representation of the ocean our Northern the ridge. Biodiversity in our analysis is however greater than
stratum (40°-48°N) intersects the North Atlantic Drift would be expected based on previous observations at any given
Province (NADR), which is the region of greatest seasonal location along the MAR. The fish fauna of the MAR are relatively
oscillation in NPP in the world’s ocean. The Azores stratum less well studied than those on continental slopes (Porteiro et al.,
(40°-32.5°N) is within the North Atlantic Subtropical Gyre 2017), so the species inventory may not be complete. Haedrich
Province (NAST). The southern stratum (32.5°-10°N) is in the and Merrett (1988) list a total of 338 deep demersal fish species in
Trade Wind Biome of the North Atlantic Tropical Gyral the North Atlantic, although this includes species living at
Province (NATR) which has the lowest NPP in the North shallower depths than available on the MAR. In an analysis of
Atlantic (Longhurst, 1998). The part of the MAR being a subset of the present data, Bergstad et al. (2008b) found a
explored for mining of polymetallic sulphides (12°N - 33°N) is general decrease in abundance, biomass, and species number
within the southern stratum and experiences relatively low organic with depth. They also documented a change in dominant species
carbon input compared to areas North of the Azores. with depth. Their cluster analysis revealed six species groups
segregated by depth and latitude but with no clear zonation
Biodiversity - Depth Relationships by depth.
Analysis of demersal fish with depth (Figure 8) shows a Figure 8B shows that there is an increase in total number of
maximum of species-richness at around 2,000 m, followed by a species with increase in height of the MAR above the abyssal
Frontiers in Marine Science | www.frontiersin.org 11 April 2022 | Volume 9 | Article 866654Priede et al. Mid-Atlantic Ridge Benthic Biomass and Biodiversity
TABLE 3 | Demersal and Benthopelagic Fishes of the Mid Atlantic Ridge (41°-60°N) ranked in order of minimum depth of occurrence.
Ref Family Species name Depths (m)
Min Max MaxX
1 Platytroctidae Holtbyrnia macrops Maul, 1957 0 1800 †‡
2 Platytroctidae Searsia koefoedi Parr, 1937 0 3065 †‡
3 Platytroctidae Normichthys operosus Parr, 1951 0 3071 †‡
4 Alepocephalidae Xenodermichthys copei (Gill, 1884) 0 3465 †‡
5 Macrouridae Coryphaenoides rupestris Gunnerus, 1765 0 3527 †‡
6 Platytroctidae Holtbyrnia anomala Krefft, 1980 0 3527 †‡
7 Anarhichadidae Anarhichas denticulatus Krøyer, 1845 188 1050 †‡
8 Platytroctidae Maulisia argipalla Matsui and Rosenblatt, 1979 200 2607 †‡
9 Phycidae Phycis blennoides (Brünnich, 1768) 450 540 ‡
10 Sebastidae Sebastes norvegicus (Ascanius, 1772) 450 680 ‡
11 Lotidae Brosme brosme (Ascanius, 1772) 450 1050
12 Etmopteridae Etmopterus princeps Collett, 1904 450 2992
13 Moridae Lepidion eques (Günther, 1887) 549 1592 ‡
14 Macrouridae Macrourus berglax Lacepède, 1801 549 2106 ‡
15 Moridae Halargyreus johnsonii Günther, 1862 665 2107 †
16 Platytroctidae Maulisia microlepis Sazonov and Golovan, 1976 702 3465 †
17 Alepocephalidae Bajacalifornia megalops (Lütken, 1898) 805 2600 †‡
18 Macrouridae Bathygadus melanobranchus Vaillant, 1888 829 2308 †
19 Moridae Antimora rostrata (Günther, 1878) 848 3090 ‡
20 Alepocephalidae Photostylus pycnopterus Beebe, 1933 850 2607 †‡
21 Centrophoridae Centroscymnus owstonii Garman, 1906 883 1149
22 Moridae Mora moro (Risso, 1810) 883 1149 ‡
23 Centrophoridae Deania calcea (Lowe, 1839) 883 1358
24 Pseudotriakidae Pseudotriakis microdon de Brito Capello, 1868 883 1358
25 Centrophoridae Centroselachus crepidater (Barbosa du Bocage and de Brito Capello, 1864) 883 1892
26 Centrophoridae Centroscymnus coelolepis Barbosa du Bocage and de Brito Capello, 1864 883 2340
27 Moridae Lepidion guentheri (Giglioli, 1880) 883 2340 ‡
28 Chimaeridae Hydrolagus pallidus Hardy and Stehmann, 1990 883 2675
29 Centrophoridae Centrophorus squamosus (Bonnaterre, 1788) 883 3366
30 Synaphobranchidae Histiobranchus bathybius (Günther, 1877) 883 3527
31 Synaphobranchidae Synaphobranchus kaupii Johnson, 1862 888 1964
32 Rajidae Amblyraja jenseni (Bigelow and Schroeder, 1950) 888 2567
33 Pentanchidae Galeus murinus (Collett, 1904) 944 1358
34 Chimaeridae Hydrolagus affinis (de Brito Capello, 1868) 948 3055
35 Trichiuridae Aphanopus carbo Lowe, 1839 966 1019 ‡
36 Trachichthyidae Hoplostethus atlanticus Collett, 1889 966 1019 ‡
37 Oreosomatidae Neocyttus helgae (Holt and Byrne, 1908) 966 1019 †
38 Rajidae Rajella bigelowi (Stehmann, 1978) 966 1019
39 Macrouridae Coelorinchus labiatus (Köhler, 1896) 966 1767
40 Notacanthidae Notacanthus bonaparte Risso, 1840 966 1767
41 Pentanchidae Apristurus manis (Springer, 1979) 966 1959
42 Notacanthidae Notacanthus chemnitzii Bloch, 1788 966 2607
43 Alepocephalidae Alepocephalus agassizii Goode and Bean, 1883 966 3071
44 Notacanthidae Polyacanthonotus rissoanus (De Filippi and Verany, 1857) 966 3527
45 Moridae Guttigadus latifrons (Holt and Byrne, 1908) 981 1003
46 Halosauridae Aldrovandia phalacra (Vaillant, 1888) 981 1959 ‡
47 Liparidae Psednos groenlandicus Chernova, 2001 981 2015 †
48 Alepocephalidae Rouleina attrita (Vaillant, 1888) 1180 2107 †‡
49 Pentanchidae Apristurus microps (Gilchrist, 1922) 1208 1592
50 Macrouridae Nezumia sclerorhynchus (Valenciennes, 1838) 1237 1296 ‡
51 Macrouridae Trachyrincus murrayi Günther, 1887 1237 1297 ‡
52 Ipnopidae Bathypterois dubius Vaillant, 1888 1237 1767
53 Bathysauridae Bathysaurus ferox Günther, 1878 1237 3527
54 Moridae Lepidion schmidti Svetovidov, 1936 1327 2404
55 Alepocephalidae Alepocephalus australis Barnard, 1923 1327 2979
56 Alepocephalidae Bathytroctes microlepis Günther, 1878 1496 2979 †‡
57 Macrouridae Coryphaenoides armatus (Hector, 1875) 1528 4300 4865 ‡
58 Somniosidae Somniosus microcephalus (Bloch and Schneider, 1801) 1572 2992
59 Arhynchobatidae Bathyraja richardsoni (Garrick, 1961) 1572 3055
60 Ophidiidae Spectrunculus grandis (Günther, 1877) 1572 3366 4298
61 Macrouridae Coryphaenoides mediterraneus (Giglioli, 1893) 1580 3527 ‡
(Continued)
Frontiers in Marine Science | www.frontiersin.org 12 April 2022 | Volume 9 | Article 866654Priede et al. Mid-Atlantic Ridge Benthic Biomass and Biodiversity
TABLE 3 | Continued
Ref Family Species name Depths (m)
Min Max MaxX
62 Ipnopidae Bathypterois phenax Parr, 1928 1630 1767
63 Bythitidae Cataetyx laticeps Koefoed, 1927 1630 1767
64 Alepocephalidae Narcetes stomias (Gilbert, 1890) 1630 2567 ‡
65 Macrouridae Coryphaenoides guentheri (Vaillant, 1888) 1630 2992
66 Macrouridae Coryphaenoides brevibarbis (Goode and Bean, 1896) 1630 3465 ‡
67 Halosauridae Halosauropsis macrochir (Günther, 1878) 1630 3527
68 Macrouridae Bathygadus favosus Goode and Bean, 1886 1702 1767
69 Alepocephalidae Conocara macropterum (Vaillant, 1888) 1702 1767 ‡
70 Macrouridae Sphagemacrurus hirundo (Collett, 1896) 1702 1767
71 Pentanchidae Apristurus profundorum (Goode and Bean, 1896) 1702 2107
72 Synaphobranchidae Ilyophis brunneus Gilbert, 1891 1702 2979 ‡
73 Aphyonidae Aphyonus gelatinosus Günther, 1878 1702 3050
74 Alepocephalidae Conocara murrayi (Koefoed, 1927) 1702 3050 ‡
75 Macrouridae Coryphaenoides leptolepis Günther, 1877 1702 3527
76 Alepocephalidae Bathytroctes macrolepis Günther, 1887 1800 3527 ‡
77 Liparidae Paraliparis nigellus Chernova and Møller, 2008 1872 2107
78 Alepocephalidae Narcetes erimelas Alcock, 1890 1872 3050 ‡
79 Macrouridae Coryphaenoides carapinus Goode and Bean, 1883 1872 3527
80 Alepocephalidae Rinoctes nasutus (Koefoed, 1927) 1872 3527 ‡
81 Chimaeridae Chimaera monstrosa Linnaeus, 1758 1929 1929
82 Alepocephalidae Leptoderma macrophthalmum Byrkjedal et al., 2011 2063 2107 ‡
83 Ophidiidae Penopus microphthalmus (Vaillant, 1888) 2063 2107
84 Macrouridae Squalogadus modificatus Gilbert and Hubbs, 1916 2063 2107 ‡
85 Stephanoberycidae Acanthochaenus luetkenii Gill, 1884 2063 2979 ‡
86 Alepocephalidae Alepocephalus productus Gill, 1883 2063 3050
87 Ipnopidae Bathypterois grallator (Goode and Bean, 1886) 2063 3050
88 Macrouridae Paracetonurus flagellicauda (Koefoed, 1927) 2063 3050
89 Notacanthidae Polyacanthonotus challengeri (Vaillant, 1888) 2063 3527 ‡
90 Rhinochimaeridae Harriotta haeckeli Karrer, 1972 2306 3071
91 Ophidiidae Spectrunculus crassus (Vaillant, 1888) 2306 3527
92 Arhynchobatidae Bathyraja pallida (Forster, 1967) 2582 3366
93 Platytroctidae Bathysaurus mollis Günther, 1878 2660 2670
94 Ophidiidae Lamprogrammus niger Alcock, 1891 2660 2670 ‡
95 Alepocephalidae Talismania mekistonema Sulak, 1975 2660 2670 ‡
96 Alepocephalidae Bathytroctes michaelsarsi Koefoed, 1927 2941 2955 4222 ‡
97 Macrouridae Asthenomacrurus victoris Sazonov and Shchherbachev, 1982 3005 3050
98 Ophidiidae Porogadus miles Goode and Bean, 1885 3005 3050 5050*
99 Ophidiidae Holcomycteronus squamosus (Roule, 1916) 3005 3527 4812
100 Macrouridae Coryphaenoides profundicolus (Nybelin, 1957) 3505 3527 4865
Minimum and maximum depth data from Porteiro et al. (2017). Maxx: additional data from Priede et al. (2010). *data from Fishbase (Froese and Pauly, 2021), † also captured in pelagic
trawl (Porteiro et al., 2017), ‡ benthopelagic according to Fishbase (Froese and Pauly, 2021).
plains. The slope of the linear regression corresponds to an than 5% of the MAR area, the distance between neighbouring
increase in total species of 32 species per 1000 m. On the patches is typically less than 500 m and over 90% of patches are
Porcupine abyssal plain to the east of the MAR, Priede et al. less than 1 km away from their nearest neighbour (Figure 9). We
(2010) recorded 10 demersal fish species at depths >4500 m. By conclude that for successful dispersal of fauna between patches of
providing depth niches for different species, the bathymetry of suitable habitat the animals need to be able to move, or broadcast
the MAR has a major effect on mid ocean deep-sea eggs or larvae to be carried over distances of 200 to 1,000 m.
fish biodiversity. The difference in spatial resolution between the RRS James
Cook (ca. 100 m) and RV GO Sars (ca, 50 m) is a complicating
Substrate Heterogeneity factor that cannot be resolved without new data. Nevertheless, it
Distances Between Rocky Substrate Patches is evident that hard substrate patches are relatively close to one
In a previous study, Niedzielski et al. (2013) showed that over another on the MAR. Furthermore, within each steep slope pixel
95% of the MAR between 41.5°N and 56°N is covered in there are likely to be multiple patches of hard substrate areas,
sediment. This provides habitat for burrowing species, including isolated single rocks, exposed summits or near-vertical
interstitial infauna, and browsing megafauna. Flat plains filled cliff faces.
with soft sediment comprised 38% of the area surveyed, arranged We assume that transport by bottom currents is an important
in a series of terraces on either side of the axis of the ridge. This mechanism for dispersal of hard substrate fauna. Priede et al.
new analysis shows that although hard substrate occupies less (2013a) measured tidal currents up to 0.05 m.s-1 with long-term
Frontiers in Marine Science | www.frontiersin.org 13 April 2022 | Volume 9 | Article 866654Priede et al. Mid-Atlantic Ridge Benthic Biomass and Biodiversity
A
B
FIGURE 8 | Species richness on the Mid-Atlantic Ridge (41°-60°N) derived from the depth range data in Figure 6 and Table 3 assuming species occurrence is
continuous between maximum and minimum observed depth. (A) Total species per 100m depth stratum. Red line - fitted polynomial. (B) Cumulative species count
from maximum to minimum depth, Red line- fitted polynomial. Green line: Linear relationship 1000 - 4000m depth: y = -0.0323x + 131.69 R² = 0.984.
currents up to 0.025 m.s-1 on the flanks of the ridge. Dale and settlement and recruitment leading to recruitment into the adult
Inall (2015) showed that topography has an important influence, population (Metaxas and Saunders, 2009). This depends on
and recorded above-bottom tidal flows of up to 0.1 m.s-1. A hydrographic conditions and the presence of suitable habitat
transport speed of 0.05 m.s-1 or 180 m.h-1 is sufficient to allow for the larvae, including the type of bottom substrate (hard or
movement between most patches of hard substrate within one soft), within a viable distance given motility and directionality of
tidal cycle. Long term residual flow of 0.02 m.s-1 would result in the organisms and currents.
transport over a distance of 1.73 km.day-1. A major factor is the duration of the larvae development
Riehl et al. (2020) emphasise the importance of fracture zones either as planktonic larvae (i.e. Planktonic Larval Duration-
in providing rare patches of rocky substrate at abyssal depths. In PLD) or on the substrate if it is a crawler; and the ability to
the North Atlantic there are approximately 65 fracture zones survive until the next suitable habitat (travel distance). Planula
between the equator and 60°N (Müller and Roest, 1992). This larvae of the octocoral Drifa glomerulata, for example, are
would give an average distance between fracture zones of 135 demersal and actively probe the substratum immediately upon
km; it is evident that on the MAR, distances between rocky release whereas other species drift between the water column and
patches are shorter, and hence connectivity much enhanced seabed usually settling after 1-30 days (Sun et al., 2010). The few
compared with the abyss. studies that exist show that species with a 24 h pelagic larval
phase can disperse around one kilometre, and species with a
Connectivity Processes longer pelagic phase can travel hundreds of kilometres
In the previous section we show that to ensure effective (Shanks, 2009).
connectivity of populations across the MAR hard substrate The distance that the larvae can travel is also dependent on
fauna need to be able to disperse over distances of 200-1000m. whether the larva is planktotrophic; able to feed in the water
Connectivity of benthic species is the result of larval dispersal, column enabling longer travel distance, or lecithotrophic,
Frontiers in Marine Science | www.frontiersin.org 14 April 2022 | Volume 9 | Article 866654Priede et al. Mid-Atlantic Ridge Benthic Biomass and Biodiversity
A
B
FIGURE 9 | Nearest neighbour distances between centroids of steep slope (>30°) patches from transects across at the MAR at 41.5°N to 56°N. (A) Data from the
RV GO Sars (42-59m resolution). (B) Data from the RRS James Cook (99-100m resolution).
dependent entirely on food reserves (e.g. in the yolk sac) in which 1km. Dispersal over such distances is readily achieved by larvae
case travelling distances may be shorter (Danovaro et al., 2014). of many deep-sea species and suggests a high degree of
Little is known about the larval biology of deep-sea benthic connectivity between patches of suitable habitat for sessile
species such as octocorals. Knowledge is limited to some benthic species. The rugged topography of MAR can create
brooding species, with very short PLD (Sun et al., 2010) while areas of strong turbulent near-bed currents (Dale and Inall,
others are broadcast-spawners that have different larval 2015). Such flows may enhance food supply and provide
characteristics and dispersal capabilities (Rakka et al., 2021). favourable conditions for the settlement of suspension-feeding
Some authors showed that for sponges a short PLD is an fauna, such as cold-water corals and sponges (Mortensen et al.,
advantage (surviving better, growing faster and with a more 2008). Larval rearing experiments showed that without aeration,
regular shape), confirming the hypothesis that long-lived larvae larvae of octocorals have a strong negative buoyancy, remaining
bring fewer reserves to the post-settlement period (Maldonado at the bottom (Rakka et al., 2021), showing the importance of
and Young, 1999). A review by Young (2003) showed that seabed currents for larval dispersal.
pelagic lecithotrophy, rather than brooding, is the main Most of the hard substrate species on the MAR are indicators
reproductive mode in the deep sea. of vulnerable marine ecosystems, which are characterised as long
The results presented here (Figure 9) show that the distance living, low fecundity and slow growing (ICES, 2020). Short
between centroids of hard substrate patches is generally less than distances between neighbouring hard substrate patches favour
Frontiers in Marine Science | www.frontiersin.org 15 April 2022 | Volume 9 | Article 866654Priede et al. Mid-Atlantic Ridge Benthic Biomass and Biodiversity
connectivity. However, dispersal over larger distances to of these areas (Alt et al., 2019) for there are many species that live
seamounts or the ocean margin (Figure 1) depend on attached to hard substratum. While there is a rapid decrease in
mesoscale phenomena, such as eddies or benthic storms (Vic the density of deepwater corals with depth below about 1,300 m
et al., 2018). The close spacing between hard substrate patches in the MAR (Mortensen et al., 2008), many of the distinctive and
enables them to be used as stepping-stones for faunal dispersal large taxa living on hard substrata are observed across multiple
over long distances as hypothesised for the chains of seamounts surveys at similar depth bands (Morris et al., 2012; Gebruk and
(Miller and Gunasekera, 2017) Krylova, 2013; Bell et al., 2016). This suggests that at least some
species have widespread distributions across patches of suitable
Hard Substrate Megafauna of the MAR habitat within particular depth horizons. In the ECOMAR video
Hard substratum on the Mid-Atlantic Ridge takes many forms surveys at 2500 m depth, Linley et al. (2013) found no consistent
from exposed rocks on otherwise fine sediment areas to extensive relationship between fish distribution and seafloor slopes with
vertical walls of basalt on the ridge scarps (Figure 10). different substrates but around the Azores, Parra et al. (2017)
Organisms have been observed living attached to and in report a general preference for mixed sediments, sandy and
association with all these forms of hard substratum (Bell et al., rocky areas, with low fish numbers on muddy areas.
2016; Alt et al., 2019). Indeed, even small boulders can support
extensive communities of large megafauna, such as stalked
crinoids and sponges (Craig et al., 2011). Despite these Soft Sediment Megafauna
occurrences, hard substratum is generally absent from flat In the ECOMAR study areas (49°N & 54°N), soft sediments in
areas and relatively rare (1.6% of area) in gently sloping areas flat and gentle (Priede et al. Mid-Atlantic Ridge Benthic Biomass and Biodiversity
The faunal communities inhabiting soft sediments on the steeper rocky areas appear to have a generally lower density and
Mid-Atlantic Ridge, at least in the ECOMAR and MARECO lower species richness in the same surface area of flat and gently
areas, were dominated by echinoderms. Holothurians were the sloping sediment (Bell et al., 2016 and Alt et al., 2019), with most
most abundant of these and include at least 55 species (Gebruk, faunal groups having at least an order of magnitude lower
2008; Rogacheva et al., 2013). Sponges and cnidarians were also density in rocky areas. However, not all taxa followed this
abundant (Gebruk et al., 2010; Alt et al., 2019). There was some trend, with both sponges and cnidarians being particularly
spatial heterogeneity in the available species-level data from abundant on rocky areas (Bell et al., 2016) and occurring at
benthic trawl surveys of the MAR. However, it is difficult to densities of similar orders of magnitude to the flatter sediment-
separate ecological differences in the limited amounts of semi- covered areas. Rocky areas in all studies had distinct
quantitative trawl data. In the case of the trawl surveys of the morphospecies, for example at the ECOMAR sites 15
MARECO area (41.5°N to 56°N) (Gebruk et al., 2010) and the morphospecies were observed in rocky areas (Bell et al., 2016)
smaller ECOMAR area around the Charlie Gibbs Fracture Zone that were not seen in flatter areas (Alt et al., 2019). Some motile
(Alt et al., 2013), there were a total of 226 species of invertebrates species usually associated with soft sediments, such as
named, with 193 species in the MARECO dataset (Gebruk et al., holothurians (Rogacheva et al., 2013) and enteropneusts (Jones
2010) and 90 species (excluding unclear identifications) in the et al., 2013) were seen in rocky areas. The differences between
ECOMAR dataset (Alt et al., 2013). The two areas had 58 species these results are likely related to faunal variation associated with
in common. The best studied and likely most comparable taxon depth, as even in the Mir datasets (Gebruk and Krylova, 2013)
in those datasets, the echinoderms, had a total of 118 named the ca. 2500 m depth band had particularly high richness of
species between the two studies, of which 50 were shared. sediment-associated fauna.
One reason for higher species diversity on rocks may be the
Biodiversity and Substrate Heterogeneity association between species: some species provide a substrate to
Since hard and soft substrates provide habitat for distinctive others, for example comatulid crinoids and ophiuroids settle on
assemblages of species it is reasonable to assume that a gorgonian corals (Gebruk and Krylova, 2013). In a region of the
heterogeneous environment with both kinds of substrate MAR between the southern part of the Reykjanes Ridge and the
should have higher biodiversity through an additive effect. Azores (~45°N), 10 times more corals were found on rocky areas
There are differences between studies in the habitat that than sediment-covered areas (Morris et al., 2012) and areas with
contributes most to the biodiversity of the region. Studies of corals hosted 1.6 times more megafaunal taxa than areas without
the megafauna (Figure 11) of the Charlie-Gibbs fracture zone corals (Mortensen et al., 2008).
between 1700 – 4500 m depth using the submersibles Mir-1 and
Mir-2 (Felley et al., 2008; Gebruk and Krylova, 2013) observed Biogeographic Patterns
more morphospecies (29) associated with rocks than with soft In the North Atlantic, the MAR accounts for 46% of the lower
sediment (16). In contrast, in the ECOMAR study areas at ca. bathyal at depths from 800 to 3500 m (Niedzielski et al., 2013).
2500 m depth on the flanks of the MAR (49°N and 54°N), the The ridge provides habitat for bathyal species that also occur on
FIGURE 11 | Number of species observed during video transects across hard and soft substrates of the Charlie Gibbs Fracture Zone. Circles dark red – soft
sediment. Triangles blue – hard rock. (After Gebruk and Krylova, 2013).
Frontiers in Marine Science | www.frontiersin.org 17 April 2022 | Volume 9 | Article 866654Priede et al. Mid-Atlantic Ridge Benthic Biomass and Biodiversity
Western Atlantic and Eastern Atlantic continental slopes. For south of the sub-Polar front in the North Atlantic.
fish and invertebrates, there is some prevalence of Eastern Regionalization of the Atlantic bathyal based on the
Atlantic species on the MAR (Mironov, 2006; Priede distribution of species is more complicated (Briggs, 1974;
et al., 2013a). Mironov, 1994; Zezina, 1997; Dinter, 2001; Watling et al., 2013).
The overall pattern of distribution of bathyal species in the Mironov (1994) suggested a scheme of faunistic
open Atlantic Ocean is complicated. There are no commonly regionalization of sublittoral and bathyal of the ocean based on
accepted schemes of regionalization of the bathyal in the Atlantic the distribution of echinoid species and the scheme of Briggs
(see Dinter, 2001). Few existing schemes are based on differing (1974) (Figure 12A). A notable feature in the scheme of Mironov
approaches and therefore are not comparable. Moreover, is the “meridional asymmetry” in the distribution of species
approaches to zonation are not always clearly explained. The across the open ocean in the east-west direction. Thus, in the
variety of approaches in marine biogeography was examined and Atlantic Ocean, the West Atlantic species are distributed in the
structured by Mironov (2013), who distinguished three main open oceanic regions more widely than the East Atlantic species
biogeographic frameworks differing in the subject of study and (Mironov, 1989; Mironov, 2006). Some of the West Atlantic
methods. The first approach deals with species ranges - species’ ranges extend eastward up to the seamounts and islands
“faunistic” (or “biotic”) approach after Mironov. The second is of the Eastern Atlantic, whereas the East Atlantic ranges extend
the “biocenotic” approach, it deals with communities (or westward only up to the Mid-Atlantic Ridge. Using data on
biocenoces). The third is designated as “landscape” and distribution of cnidaria (corals) Watling and Lapointe (2022)
considers environmental parameters. In the faunistic approach, propose division of the North Atlantic lower bathyal
the main criterion of a biogeographic boundary is a zone of biogeographic province into eastern and western units.
crowding of species range boundaries. In the biocenotic However, these east-west patterns in the North Atlantic are
approach, the criterion of a boundary is the difference between true only for latitudes north of ~30°N. To the south the ridge
local biotas commonly revealed using cluster analysis (based on in the Atlantic goes deeper with little space for species living at
such parameters as species abundance, biomass and diversity). In depths shallower than 2000 m (Figure 1). South of 30°N the
the landscape approach, boundaries usually correspond to meridional asymmetry between areas to the west and to the east
pronounced gradients of physical-chemical parameters. of the MAR in the North Atlantic is more pronounced: the limit
Proposed schemes of zonation differ significantly. Based on of distribution of western and eastern species shifts closer to the
environmental parameters, Watling et al. (2013) distinguished a African coast and goes by the Cabo Verde Islands (Figure 12B).
single unit “North Atlantic Province” at depths 800-3500 m In the scheme of pelagic provinces (Spalding et al., 2012), there is
A B
FIGURE 12 | Biogeography of the Atlantic Ocean. Dashed line Mid-Atlantic Ridge. (A) The faunistic boundary where East & West Atlantic species meet (Blue
shaded area). Red Ovoids – Exotic regions. (After Mironov, 1994). (B) Pattern of late Cenozoic (from 10 MYA) colonisation of the Atlantic Ocean bathyal and
sublittoral. Blue arrows –from Indo-West Pacific centre of re-distribution. Red symbol – West Atlantic centre of re-distribution. Green arrows – from the North Pacific
via the Arctic Ocean (After Mironov, 2006).
Frontiers in Marine Science | www.frontiersin.org 18 April 2022 | Volume 9 | Article 866654You can also read