Discovery and characterization of Hv1- type proton channels in reef-building corals
←
→
Page content transcription
If your browser does not render page correctly, please read the page content below

RESEARCH ARTICLE

                                     Discovery and characterization of Hv1-
                                     type proton channels in reef-building
                                     corals
                                     Gisela Rangel-Yescas1, Cecilia Cervantes1, Miguel A Cervantes-Rocha1,
                                     Esteban Suárez-Delgado1, Anastazia T Banaszak2, Ernesto Maldonado3,
                                     Ian Scott Ramsey4, Tamara Rosenbaum5, Leon D Islas1*
                                     1
                                      Departmento de Fisiologı́a, Facultad of Medicina, Universidad Nacional Autónoma
                                     de México, Mexico City, Mexico; 2Unidad Académica de Sistemas Arrecifales,
                                     Instituto de Ciencias del Mar y Limnologı́a, Universidad Nacional Autónoma de
                                     México, Puerto Morelos, Mexico; 3EvoDevo Research Group, Unidad Académica de
                                     Sistemas Arrecifales, Instituto de Ciencias del Mar y Limnologı́a, Universidad
                                     Nacional Autónoma de México, Puerto Morelos, Mexico; 4Department of
                                     Physiology and Biophysics, School of Medicine, Virginia Commonwealth University,
                                     Richmond, United States; 5Departmento of Neurociencia Cognitiva, Instituto de
                                     Fisiologı́a Celular, Universidad Nacional Autónoma de México, Mexico City, Mexico

                                     Abstract Voltage-dependent proton-permeable channels are membrane proteins mediating a
                                     number of important physiological functions. Here we report the presence of a gene encoding Hv1
                                     voltage-dependent, proton-permeable channels in two species of reef-building corals. We
                                     performed a characterization of their biophysical properties and found that these channels are fast-
                                     activating and modulated by the pH gradient in a distinct manner. The biophysical properties of
                                     these novel channels make them interesting model systems. We have also developed an allosteric
                                     gating model that provides mechanistic insight into the modulation of voltage-dependence by
                                     protons. This work also represents the first functional characterization of any ion channel in
*For correspondence:                 scleractinian corals. We discuss the implications of the presence of these channels in the
leon.islas@gmail.com                 membranes of coral cells in the calcification and pH-regulation processes and possible
Competing interest: See              consequences of ocean acidification related to the function of these channels.
page 17
Funding: See page 17

Preprinted: 09 April 2021            Introduction
Received: 09 April 2021              Scleractinian or stony corals are organisms in the phylum Cnidaria that deposit calcium
Accepted: 30 June 2021               carbonate (CaCO3) in the form of aragonite to build an exoskeleton. Stony corals are the main calci-
Published: 06 August 2021            fying organisms responsible for the construction of coral reefs, which are major ecosystems hosting
                                     numerous and diverse organisms. Coral reefs also act as natural barriers from strong ocean currents,
Reviewing editor: László
Csanády, Semmelweis University,
                                     waves, and tropical storms, providing coastal protection. This protection centers on the ability of
Hungary                              scleractinian corals to produce enough CaCO3. The increase in atmospheric CO2 concentrations as a
                                     result of human activity poses threats to coral-reef-building organisms due to rising sea surface tem-
   Copyright Rangel-Yescas et al.
                                     peratures (Hoegh-Guldberg, 1999) and because CO2 is taken up by the ocean, dangerously lower-
This article is distributed under
                                     ing the pH of the sea water (Caldeira and Wickett, 2003).
the terms of the Creative
Commons Attribution License,             It is known that precipitation of the aragonitic form of calcium carbonate is facilitated at elevated
which permits unrestricted use       pH values, at very low concentrations of protons. Calcification by scleractinian corals is a process
and redistribution provided that     that has been shown to be modulated by the pH of the solution in which calcium carbonate is pre-
the original author and source are   cipitated (Allemand et al., 2011). To this end, corals produce a specialized compartment between
credited.                            the ectoderm and the external substrate or skeleton called calicoblastic compartment, which

Rangel-Yescas et al. eLife 2021;10:e69248. DOI: https://doi.org/10.7554/eLife.69248                                                    1 of 24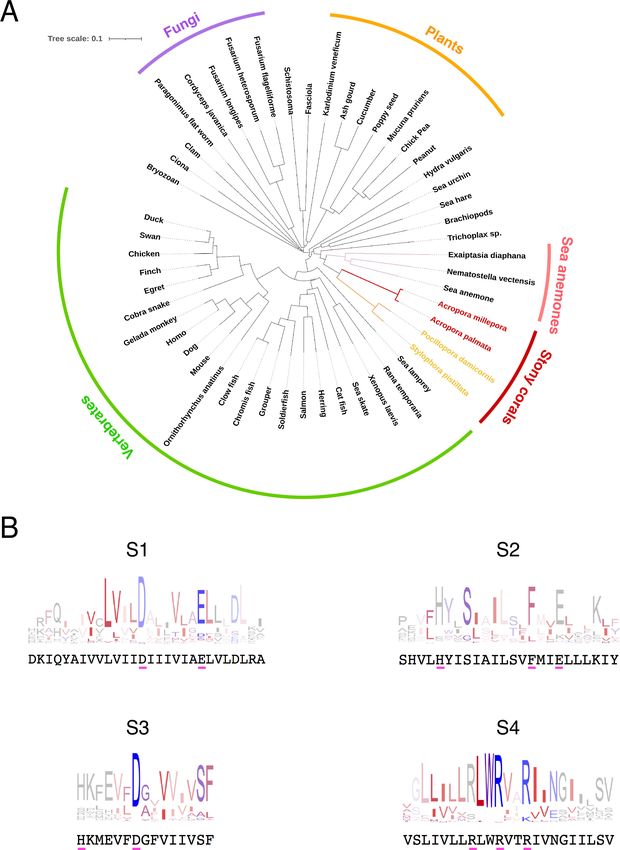
Research article                                                                        Structural Biology and Molecular Biophysics

                                   contains a fluid derived from the surrounding sea water. The composition of this calicoblastic fluid or
                                   liquor is strictly regulated by the coral to maintain both an elevated pH, often close to one unit
                                   higher than the surrounding sea water, and an increased concentration of Ca2+ and carbonates. The
                                   molecular details of pH regulation in the calicoblastic fluid are not understood completely. Involve-
                                   ment of proton pumps has been postulated and is likely to be part of proton transport in corals.
                                   Both P-type and V-type hydrogen pumps are present in coral transcriptomes and are known to play
                                   roles in the physiology of coral-algal symbiosis (Tresguerres et al., 2017). V-type H+-ATPases have
                                   also been shown to be involved in calcification in foraminifera (Toyofuku et al., 2017). If a proton
                                   pump is involved in lowering proton concentration in the calicoblastic fluid to maintain high calcifica-
                                   tion rates, protons will be transported to the cytoplasm of the ectodermal cells that constitute the
                                   calicoblastic epithelium, producing a profound acidification of the cytoplasmic pH (pHi). Although
                                   measurements of the pHi in corals indicate values of 7.13–7.4 (Venn et al., 2009), it is unknown how
                                   coral cells regulate pHi. Thus, an efficient pH-regulatory mechanism is to be expected to be present
                                   in corals. We hypothesized that proton channels might be fundamental to this physiological process
                                   and also required for calcification in hard corals.
                                       Although a number of studies have delineated the physiological roles of Hv1 voltage-gated pro-
                                   ton channels in vertebrate cells (DeCoursey, 2013), less is known about their role in invertebrates.
                                   These channels are potential mediators in processes that are critically dependent on proton homeo-
                                   stasis. As an example, they have been shown to be involved in regulating the synthesis of the cal-
                                   cium carbonate skeleton in coccolithophores, calcifying unicellular phytoplankton (Taylor et al.,
                                   2011).
                                       The range of voltages over which channel activation occurs is strongly modulated by the trans-
                                   membrane proton gradient, characterized by DpH = pHo-pHi, that is, the difference between
                                   the external and internal pH. In the majority of known Hv1 channels, the voltage at which half of the
                                   channels are activated, the V0.5 or the apparent threshold for channel opening (VThr), shifts by
                                   roughly 40 mV per unit of DpH. Thus, the pH gradient strongly biases the voltage-independent free
                                   energy of channel activation (Cherny et al., 1995). With few exceptions, channel activation occurs at
                                   voltages that are more positive than the reversal potential for protons, implying that protons are
                                   always flowing outward under steady-state conditions. The fact that most Hv1s mediate outward cur-
                                   rents is the reason these channels are mostly involved in reversing intracellular acidification or pro-
                                   ducing voltage-dependent cytoplasmic alkalization (Lishko and Kirichok, 2010; DeCoursey, 2013).
                                       Here we report the presence of genes encoding Hv1 channels in two species of reef-building cor-
                                   als. We cloned and characterized the biophysical properties of these channels in an expression sys-
                                   tem using patch-clamp electrophysiology. The demonstration of the presence of voltage-gated
                                   proton channels in corals is an initial step to a deeper understanding of coral calcification and its dys-
                                   regulation under ocean acidification conditions. We show that some of the coral Hv1’s biophysical
                                   properties are different from other known proton channels, and this behavior makes them interest-
                                   ing models to try to understand some basic biophysical mechanisms in these channels. To explain
                                   this behavior, we developed a novel activation model to describe voltage- and pH-dependent gating
                                   that has general applicability to Hv1 channels.

                                   Results
                                   Ion channels have not been characterized in corals. Here, we have initiated their study by searching
                                   the transcriptome of the Indo-Pacific coral Acropora millepora (Moya et al., 2012) for sequences
                                   coding for putative voltage-sensing residues present in canonical Hv1 channels with the form
                                   RxxRxxRIx, which corresponds to the S4 segment of Hv1 channels and is also found in other voltage-
                                   sensitive membrane proteins. Blast searches detected four sequences that seem to correspond to a
                                   gene encoding the Hv1 voltage-activated proton-selective ion channel (Ramsey et al., 2006;
                                   Sasaki et al., 2006). A. millepora is one of the most widely studied species of scleractinian corals
                                   and is well represented in the commercial coral trade (Cleves et al., 2018; Ying et al., 2019). We
                                   proceeded to clone this gene from a small specimen of A. millepora obtained from a local aquarium
                                   (Reef Services, Mexico City). As indicated in the ’Materials and methods’ section, total RNA was
                                   extracted from tissue and mRNA was retrotranscribed to obtain complementary DNA (cDNA). We
                                   managed to obtain a full-length clone and refer to this sequence as AmHv1 or Hv1-type proton chan-
                                   nel of A. millepora.

Rangel-Yescas et al. eLife 2021;10:e69248. DOI: https://doi.org/10.7554/eLife.69248                                                    2 of 24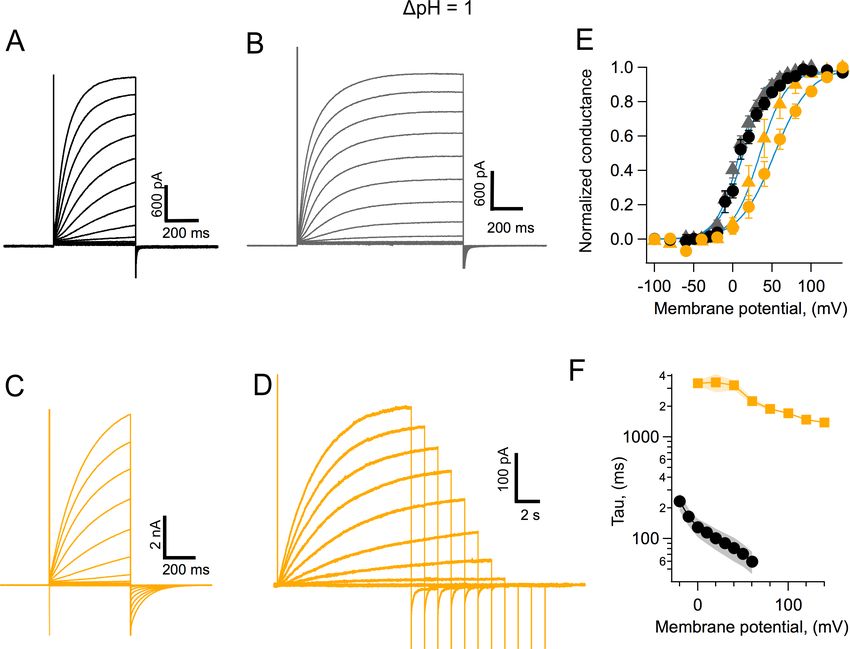
Research article                                                                       Structural Biology and Molecular Biophysics

                                       We were interested in knowing if the same gene is present in a closely related species from the
                                   Caribbean Sea. Thus, we used the same primers to clone the Hv1 channel from Acropora palmata, a
                                   widespread coral in the same family, and which we call ApHv1. The amino acid sequence is almost
                                   identical to AmHv1 (Figure 1—figure supplement 1A); the greatest divergence is found between a
                                   few amino acid residues in the C-terminal region. This result suggests that despite the large biogeo-
                                   graphic difference, these two genes have not diverged significantly. The ApHv1 sequence also gives
                                   rise to fast-activating voltage-gated proton currents (Figure 1—figure supplement 1B).
                                       The most diagnostic feature of the Hv1 protein is the sequence of the fourth transmembrane
                                   domain or S4, which contains three charged amino acids in a characteristic triplet repeat. The pres-
                                   ence of these repeats in our sequence allowed us to initially identify our clone as an Hv1 channel.
                                   However, we decided to compare our sequence to those of several Hv1 orthologs. We selected a list
                                   of 130 Hv1 protein sequences that are well curated in the Gene Bank (https://www.ncbi.nlm.nih.gov/
                                   ), representing several branches of the eukaryotes, from unicellular plants to mammals. As expected,
                                   the protein sequence of AmHv1 has similarity to several other Hv1 genes from varied organisms
                                   (Figure 1A). The identity varies from 98%, when compared to other putative coral and anemone
                                   sequences, to less than 30%, when compared to plant and nematode sequences. In spite of this vari-
                                   ability, the putative transmembrane domains of all these proteins show high conservation, and con-
                                   sensus sequence logos can detect the presence of highly conserved individual amino acid sequences
                                   that can be considered characteristic of Hv1 channels. Figure 1B compares these transmembrane
                                   domain consensus logos with our AmHv1 sequence. It can be gleaned that AmHv1 contains the
                                   highly conserved residues that form the voltage-sensing amino acid residues in S4 as well as their
                                   acidic pairs present in S2 and S3. The extracellular histidine residues involved in Zn2+ coordination
                                   are also present. These results suggest that our sequence is that of a bona fide Hv1 voltage-sensing
                                   domain (VSD).
                                       Apart from canonical voltage-gated channels, several other proteins contain VSDs. Examples are
                                   the voltage-sensing phosphatases like VSPs (Iwasaki et al., 2008) and TPTE and TPTE2
                                   (Halaszovich et al., 2012) proteins (transmembrane proteins with tensin homology) and genes like
                                   TMEM266. These proteins are relevant to us since some TPTEs have been shown to also mediate
                                   proton currents and TMEM266 can be modulated by Zn2+ (Papp et al., 2019). We compared the
                                   sequence of AmHv1 with several orthologs of TPTEs and TMEM266. Although there is some similar-
                                   ity within transmembrane domains (Figure 1—figure supplement 2), the overall sequence compari-
                                   son shows that AmHv1 and these VSD-containing proteins are different.
                                       As mentioned before, we performed a multiple sequence alignment with 130 Hv1 sequences. In
                                   Figure 2, we show the detailed sequence alignment of AmHv1 with five of these sequences, which
                                   represent some of the best studied Hv1 genes. It can be seen that there is a high degree of identity,
                                   especially in the transmembrane domains. The least degree of conservation appears when compar-
                                   ing this sequence to the dinoflagellate Karlodinium veneficum Hv1 channel (Figure 2A). A search of
                                   available transcriptomes from several coral species allowed us to detect the presence of sequences
                                   that are found in Hv1 channels. This suggests that Hv1 proton channels might be found in many fami-
                                   lies of scleractinian corals (Figure 2—figure supplement 1), as has also been recently shown
                                   (Capasso et al., 2021).
                                       Secondary-structure prediction suggests that AmHv1 is a canonical Hv1 channel formed by a VSD
                                   with four transmembrane segments. The protein sequence was used for 3D modeling using the
                                   SWISS MODEL server (Waterhouse et al., 2018), which produced models based on the Hv1 chimera
                                   structure (Takeshita et al., 2014) and the Kv1.2 potassium channel VSD (Long et al., 2005). This
                                   structural model is shown in Figure 2B. The predicted model indicates a shortened N-terminal
                                   region, four transmembrane helices, and a long C-terminal helix.
                                       Voltage-gated proton channels from Ciona (Sasaki et al., 2006) and humans (Lee et al., 2008)
                                   have been shown to express as dimers in the plasma membrane, and this dimeric form is understood
                                   to be the functional unit of these proton channels. The dimer is stabilized by a coiled-coil interaction
                                   mediated by an alpha helical C-terminal domain. As shown by the model in Figure 2B, AmHv1 has a
                                   long C-terminal helix, which is predicted to engage in a coiled coil (Paircoil2; McDonnell et al.,
                                   2006). We calculated the probability per residue to form a coiled coil for all the C-terminal residues,
                                   both for human and AmHv1 channels, using the program COILS (Lupas et al., 1991). Figure 3A
                                   shows that the coiled-coil probability for AmHv1 C-terminus is at least as high or higher than that for
                                   hHv1, an established dimer, strongly suggesting that coral Hv1s might also form dimers.

Rangel-Yescas et al. eLife 2021;10:e69248. DOI: https://doi.org/10.7554/eLife.69248                                                   3 of 24
Research article                                                                             Structural Biology and Molecular Biophysics

Figure 1. Conservation and phylogenetic relationships of Hv1 channels. (A) The tree obtained from a multiple sequence alignment from Hv1 channels in
CLUSTAL-O. Highlighted in red and yellow are the branches containing coral Hv1 sequences. (B) Consensus logo sequences of transmembrane
domains of Hv1 channels. The color code indicates the hydrophobicity of each residue, where blue indicates charged residues, red indicates non-polar
residues, and other colors indicate either non-polar or charged residues with less conservation.
Figure 1 continued on next page

Rangel-Yescas et al. eLife 2021;10:e69248. DOI: https://doi.org/10.7554/eLife.69248                                                          4 of 24
Research article                                                                                   Structural Biology and Molecular Biophysics

Figure 1 continued
The online version of this article includes the following source data and figure supplement(s) for figure 1:
Source code 1. Code for generating the tree in Figure 1.
Figure supplement 1. Some characteristics of Hv1 from Acropora palmata.
Figure supplement 2. Comparison of the sequence of AmHv1 to other voltage-sensing proteins.

                                         In order to study the oligomeric state of the coral Hv1, we performed FRET experiments with
                                      the AmHv1 channel tagged with fluorescent proteins (FPs) as a FRET pair. Figure 3B shows that
                                      there is significant FRET efficiency between FP-tagged subunits, indicating a very close interaction
                                      between monomers. The measured apparent FRET efficiency vs the fluorescence intensity ratio can
                                      be fitted to a model where the subunits assemble as a dimer. From this fit, we can estimate a dis-
                                      tance between fluorophores of ~60 Å, which is compatible with AmHv1 being a dimer, at least in
                                      HEK293 cells.

Figure 2. Protein sequence alignment of the AmHv1 channel with selected Hv1s from other organisms. (A) Amino acid sequence alignment of Acropora
millepora Hv1 (AmHv1) with other known Hv1 orthologs provided by the CLUSTAL-O algorithm. The predicted transmembrane domains are shown by
the colored horizontal lines and letters. The colors highlighting the sequence indicate sequence identity. Orange indicates identical amino acids,
and cyan indicates no identity. (B) Predicted structural topology of AmHv1. Transmembrane domains are colored to correspond with the sequences in
(A). The top panel is the view parallel to the membrane while the bottom panel is the view from the top (extracellular) side.
The online version of this article includes the following figure supplement(s) for figure 2:
Figure supplement 1. Comparison of the AmHv1 protein sequence with similar sequences found in other coral species.

Rangel-Yescas et al. eLife 2021;10:e69248. DOI: https://doi.org/10.7554/eLife.69248                                                                5 of 24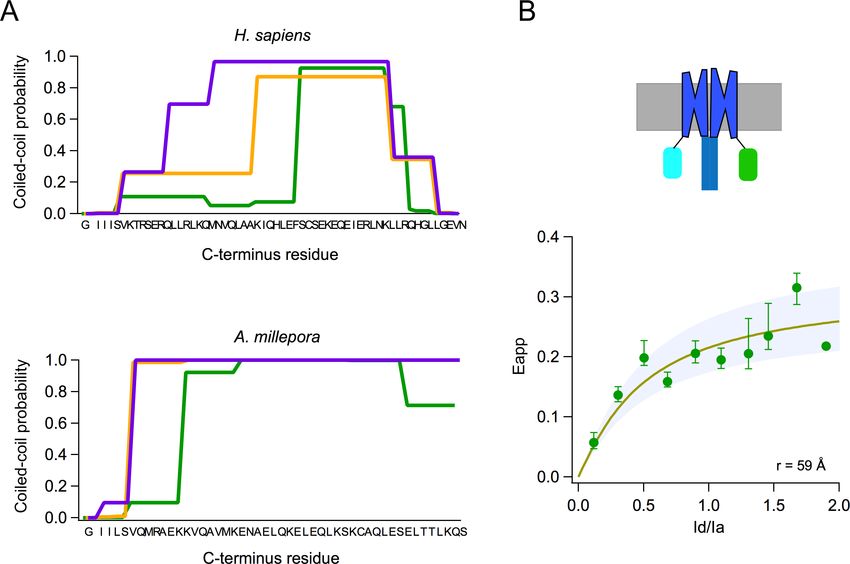
Research article                                                                               Structural Biology and Molecular Biophysics

                                    Functional expression of AmHv1 voltage-dependence and kinetics
                                    The cDNA of AmHv1 was cloned in the pcDNA3 expression vector and transfected into HEK293
                                    cells. Under whole-cell conditions, we recorded large voltage-dependent outward currents.
                                    Figure 4A shows a family of such currents. The data suggest that these currents were carried mostly
                                    by protons, since the reversal potential, measured from a tail current protocol, closely followed the
                                    equilibrium potential for protons, as given by the Nernst equation (Figure 4B).
                                       The voltage-dependence of channel gating was estimated from a fit of the normalized conduc-
                                    tance vs voltage (G-V) to Equation 1. The steepness of the curve corresponds to an apparent charge
                                    of ~2 eo, comparable to other Hv1s under similar recording conditions (Figure 4C).
                                       Interestingly, these channels seem to activate rapidly. This is apparent from the current traces,
                                    which approach a steady state within a few hundred ms (Figure 4A), as quantified in Figure 4D.
                                    Equation 3 estimates two parameters, an activation time constant (t) and a delay (d). Both the time
                                    constant and the delay are similarly voltage-dependent at positive potentials. The existence of a
                                    delay in the time course implies that activation is a multiple-state process. The delay magnitude is

Figure 3. Subunits of the AmHv1 channel associate to form dimers. (A) Probability of coiled-coil formation per amino acid residue of the C-terminus
domain of hHv1 (top) and Acropora millepora Hv1 (AmHv1) (bottom). The different colors correspond to the three seven-residue windows used by the
program to calculate the score. The sequence of the C-terminus is shown in the x-axis. (B) FRET measurement of dimer formation. The apparent FRET
measured from 134 cells is plotted as a function of the ratio of donor to acceptor fluorescence (Id/Ia). Shown is the average and sem for data in Id/Ia
windows of 0.1. The continuous curve is the fit of the data to the prediction of a model that considers random assembly of donor- and acceptor-tagged
subunits into a dimer. The separation between the FRET pairs in a dimer is ~60 Å, according to the model. The upper panel depicts a cartoon of the
presumed fluorescent protein (FP)-tagged dimer in the membrane.
The online version of this article includes the following source data for figure 3:
Source data 1. Source data for Figure 3.

Rangel-Yescas et al. eLife 2021;10:e69248. DOI: https://doi.org/10.7554/eLife.69248                                                             6 of 24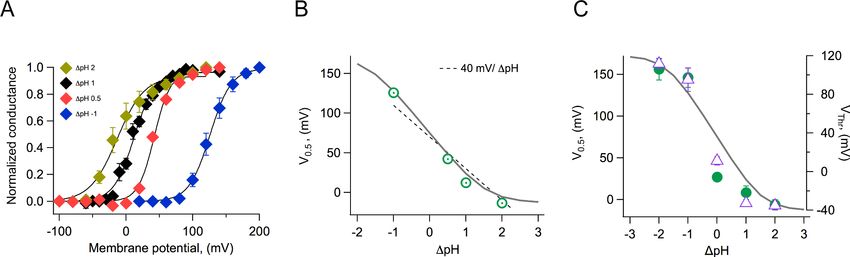
Research article                                                                                 Structural Biology and Molecular Biophysics

Figure 4. Proton currents mediated by AmHv1 expressed in HEK293 cells. (A) A typical proton current family elicited by depolarizing pulses from 50
to 60 mV in 10 mV intervals. The duration of the pulses is 500 ms. Linear current components have been subtracted. (B) Reversal potential of currents as
a function of the pH gradient. Symbols are individual data and the black horizontal lines are the mean. The dotted line is the expected reversal
potential as predicted by the Nernst equation. The inset shows a tail current family from which instantaneous IV curves were extracted to measure the
reversal potential. Recordings shown in (A) and (B) were obtained in the whole-cell configuration. (C) Normalized conductance-voltage curve at DpH =
1. The purple curve is the fit to Equation 1 with parameters V0.5 = 7.85 mV and q = 2.09 eo. Circles are the mean and error bars are the sem (n = 7). (D)
Kinetic parameters of activation. Activation time constant and delay estimated from fits of current traces to Equation 2. Circles are the mean, and the
sem is indicated by the shaded areas (n = 6). The voltage-dependence of the delay and tau of activation were estimated from a fit to Equation 3, which
appears as the red curve. Parameters are d(0) = 98.2 ms and qd = 0.47 eo. The voltage-dependence parameters for tau are t(0) = 212 ms and qt = 0.37
eo.
The online version of this article includes the following source data for figure 4:
Source data 1. Source data for Figure 4.

                                     smaller than the time constant at all voltages, which can be interpreted to mean that the rate-limit-
                                     ing step for opening comes late in the activation pathway (Schoppa and Sigworth, 1998).

                                     Comparison to human Hv1 channel properties
                                     Human Hv1 is probably the best characterized of the voltage-gated proton channels (Musset et al.,
                                     2008); so we compared some of the properties of AmHv1 with hHv1. AmHv1 channels activate faster
                                     than their human counterpart. Figure 5 compares the activation kinetics of these two channels under

Rangel-Yescas et al. eLife 2021;10:e69248. DOI: https://doi.org/10.7554/eLife.69248                                                              7 of 24
Research article Structural Biology and Molecular Biophysics
Figure 5. Coral Hv1 channels are faster and activate more readily than their human counterpart. (A) Acropora millepora Hv1 (AmHv1) currents in
response to voltage-clamp pulses from 100 to 120 mV and of 500 ms duration. (B) AmHv1 currents in response to the same voltage-clamp pulses as in
(A) but of a longer duration of 800 ms. (C) Currents through hHv1 channels in response to voltage-clamp pulses from 100 to 120 mV of 500 ms
duration, compared with (A). (D) hHv1 currents recorded with long pulses designed to reach the steady state. Pulses were shortened in duration as
depolarizations became larger, in an effort to reduce intracellular proton depletion. Pulses are from 100 to 140 mV. Recordings shown in (A), (B), (C),
and (D) were obtained in the whole-cell configuration. (E) Comparison of the conductance-voltage relationship for both channels for short- (circles) and
long (triangles)-duration pulses. Black symbols are the mean G/Gmax for AmHv1 and yellow symbols for hHv1. The error bars are the sem (n = 3, for
short pulses, both channels, and n = 4, for long pulses, both channels). The continuous blue curves are fits to Equation 1. The fitted parameters are
AmHv1, short pulses, q = 1.62 eo, V0.5 = 12.2 mV; AmHv1, long pulses, q = 1.7 eo, V0.5 = 7.7 mV; hHv1, short pulses, q = 1.11 eo, V0.5 = 53.1 mV; hHv1,
long pulses, q = 1.47 eo, V0.5 = 34.1 mV. (F) The activation time constant estimated from fits of currents elicited by long pulses to Equation 2. Squares
are the mean for hHv1 and circles, for AmHv1. The shaded areas are the sem (n = 4, for both channels).
The online version of this article includes the following source data for figure 5:
Source data 1. Source data for Figure 5.
the same conditions. Steady state is apparently reached sooner after a voltage pulse in AmHv1
(Figure 5A) when compared to hHv1 (Figure 5C). The slower kinetics of the human ortholog is also
evidenced in the more sluggish deactivation tail currents (Figure 5C). The range of voltages over
which activation happens is also different between the two channels, with the coral Hv1 channel
activating at more negative voltages than the human clone (Figure 5E; notice that the proton
Rangel-Yescas et al. eLife 2021;10:e69248. DOI: https://doi.org/10.7554/eLife.69248 8 of 24Research article Structural Biology and Molecular Biophysics
gradient is such that DpH = 1 and is the same for recordings of both channel types). Even though
AmHv1 activates at more negative voltages, the activation range is still more positive than the pro-
ton reversal potential; thus, coral proton currents activated by depolarization, in the steady state
and at least as expressed in HEK293 cells, are always outward.
In order to better estimate both kinetics and activation, we performed experiments with longer
pulse durations. This is especially important for the very slow activation of the human channel. The
resulting currents are shown in Figure 5B and D. The normalized conductance for these currents
that are closer to steady state are shown in Figure 5E by triangles. These G-V curves are shifted to
more negative voltages than the G-V from shorter pulses, as expected. The faster kinetics of AmHv1
is clearly evidenced when the time constant of activation, t , estimated using fits of the activation
time course to Equation 2, is compared for coral and human Hv1 channels. AmHv1 is more than ten-
fold faster at 0 mV and over a range of positive voltages (Figure 5F).
Effects of the pH gradient on gating
Both native and cloned voltage-gated proton channels are characteristically modulated by the pH
gradient (Cherny et al., 1995; Sasaki et al., 2006; Ramsey et al., 2006). We carried out experi-
ments to investigate the modulation of the coral Hv1 channels by different pH gradients. We first
recorded whole-cell currents at various DpH values and estimated the voltage-dependence of the
conductance. These G-V curves were fitted to Equation 2 to obtain the voltage of half activation,
V0.5, and apparent gating charge, q, which determines the steepness of the fit. As is the case with
other Hv1 channels, the V0.5 shifts to negative voltages when DpH is greater than 0 and to positive
voltages when DpH is less than 0 (Figure 6A). When we plot the V0.5 as a function of DpH, the rela-
tionship seems to be mostly linear over the range of DpH 1 to 2. This relationship is somewhat
steeper than the generally observed 40 mV/DpH (Figure 6B). We tried to obtain recordings over
an extended range of DpH values. To this end, we performed inside-out recordings in which the
composition of solutions can be better controlled, tends to be more stable, and the size of currents
is smaller. However, recordings were unstable at extreme pH values, and we only managed to
Figure 6. Modulation of channel activation by the pH gradient. (A) Conductance vs voltage relationships obtained at the indicated DpH values, from
whole-cell recordings of Acropora millepora Hv1 (AmHv1) proton currents. Continuous lines are fits to Equation 1. (B) The parameter V0.5 was obtained
from the fits in (A) and is displayed as a function of DpH. The dotted line is the 40 mV/DpH linear relationship. The continuous gray curve is the
prediction of the allosteric model (Figure 7). (C) Parameters V0.5 (green circles) and VThr (purple triangles) obtained from a different set of inside-out
current recordings. Data are mean ± sem. The continuous gray curve is the same prediction of the allosteric model (Figure 7) that is shown in panel (B).
The model parameters used to generate the theoretical curve are E = 5x10⁵, D = 105, C = 0.0002, Kv(0) = 0.00005, qg = 1.0 eo, pKo = 3.4, and pKi = 7.
The online version of this article includes the following source data, source code and figure supplement(s) for figure 6:
Source data 1. Source data for Figure 6.
Figure supplement 1. Equations for the model in Figure 7.
Figure supplement 2. Simulations of the voltage- and pH-dependent behavior predicted by the allosteric model.
Figure supplement 2—source code 1. Source code for Figure 6—figure supplement 2.
Rangel-Yescas et al. eLife 2021;10:e69248. DOI: https://doi.org/10.7554/eLife.69248 9 of 24Research article Structural Biology and Molecular Biophysics
reliably extend the data to a DpH value of 2. Figure 6C shows the summary of the inside-out
recordings. We have plotted both the V0.5 and the threshold voltage, VThr. To obtain this last param-
eter, we fitted the exponential rise of the G-V curve to a function of the form
GðV Þ ¼ G0 expqV=KB T
VThr was calculated as the voltage at which the fit reaches 10% of the maximum conductance. The
parameter VThr should be less sensitive than V0.5 to the possible change in the proton gradient that
can occur with large currents. It is clear from these data that at extreme values, the dependence of
V0.5 or VThr on DpH deviates from a simple linear relationship and instead appears to saturate at
extreme values of DpH.
Allosteric model of voltage- and pH-dependent gating
Currently, there is only one quantitative model that has been used to explain DpH gating of Hv1
channels (Cherny et al., 1995). However, this model is euristic and does not provide mechanistic
insight into the process of proton modulation of the voltage dependence of proton-permeable chan-
nels. In order to explain the modulation of the range of activation by the proton gradient, parame-
terized by the V0.5, we developed a structurally inspired allosteric model of voltage and proton
activation. As many voltage-sensing domains, Hv1 has two water-occupied cavities exposed to the
extracellular and intracellular media (Ramsey et al., 2010; Islas and Sigworth, 2001; Ahern and
Horn, 2005). Recent evidence suggests that these cavities function as proton-binding sites through
networks of electrostatic interactions (De La Rosa et al., 2018). In our model, we propose that these
two proton-binding sites, one intracellular and one extracellular, allosterically modulate the move-
ment of the voltage-sensing S4 segment and, thus, channel activation in opposite ways. The extra-
cellular site is postulated as inhibitory, while the intracellular site is excitatory, facilitating voltage
sensor movement. As a first approximation, we employed a simplified allosteric formalism based on
a Monod-Wyman-Changeux (MWC) style model (Horrigan and Aldrich, 2002; Changeux, 2012). As
a simplifying assumption, in this model we assume that the voltage sensor moves in a single voltage-
dependent activation step. We assume the external and internal proton-binding sites have simple
protonation given by a single pKa value. These sites operate as two allosteric modules and are cou-
pled to the voltage sensor according to coupling factors C and D, respectively. These binding sites
in turn interact with each other through the coupling factor E. The modular representations of the
model are illustrated in Figure 7A, while the full model depicting all open and closed states with all
permissible transitions and the corresponding equilibrium constants for each transition is shown in
Figure 7B. Full details of equations derived from these schemes are given in supplementary data.
This allosteric model represents the first attempt at producing a quantitative mechanistic under-
standing of the interaction of the voltage sensor and protons in Hv1 channels.
From the data shown in Figure 6C, it can be seen that the model is capable of reproducing the
very steep dependence of V0.5 on DpH and importantly, the saturation of this relationship at extreme
values. Some Hv1 channels from other organisms show a linear dependence of gating over a large
range of DpH values, while others show a reduced dependence and even saturation over some range
of DpH (Thomas et al., 2018). Our model can explain these different behaviors as different channels
having distinct values of pKas for the internal or external sites, differences in coupling factors, or dif-
ferences in the voltage-dependent parameters (Figure 6—figure supplements 1 and 2).
Block by Zn2+
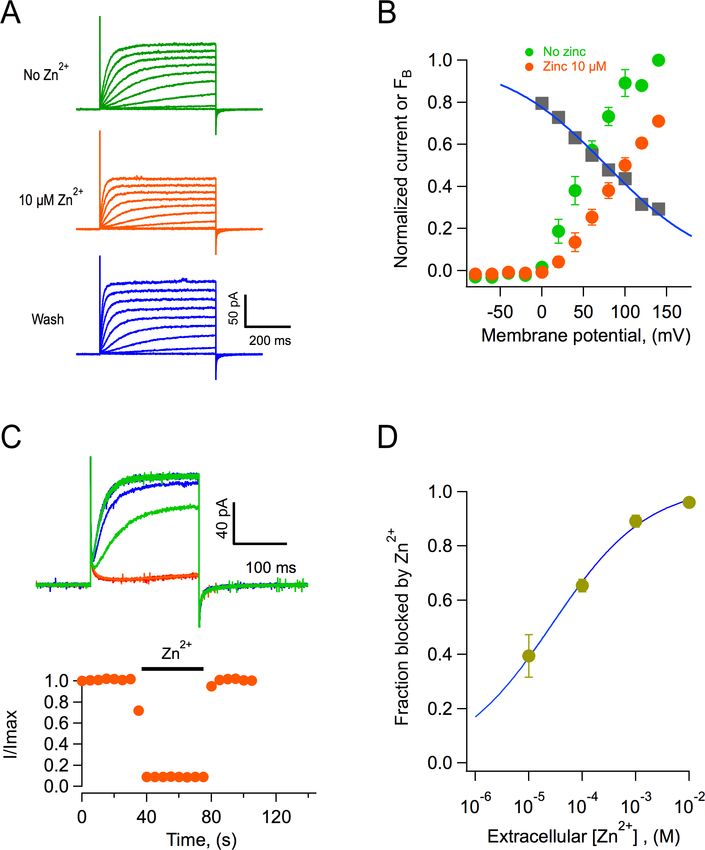
The best-characterized blocker of proton channels is the divalent ion zinc (Cherny et al., 2020;
De La Rosa et al., 2018; Qiu et al., 2016). We performed experiments to determine if AmHv1 chan-
nels are also inhibited by zinc. We found that indeed, extracellular application of zinc in outside-out
patches produced inhibition of the channels, reflected in reduced current amplitudes (Figure 8A).
Figure 8B shows average current-voltage (I-V) relationships in the absence and presence of 10 mM
external zinc. It can be seen that the fraction of current blocked is not the same at every voltage,
indicating that this inhibition might be voltage-dependent. The fraction of blocked channels was cal-
culated and is plotted at each voltage along with the I-V curves (Figure 8B). It can be clearly seen
that inhibition by Zn2+ is voltage-dependent. A simple mechanism for voltage-dependent blockage
was proposed by Woodhull, 1973. This model postulates that a charged blocker molecule interacts
Rangel-Yescas et al. eLife 2021;10:e69248. DOI: https://doi.org/10.7554/eLife.69248 10 of 24Research article Structural Biology and Molecular Biophysics
Figure 7. Gating scheme I. (A) Modular representation of a simple Monod-Wyman-Changeux (MWC) model; the channel opening transition is voltage-
dependent, with equilibrium constant K(V). Bo and Bi are the unbound states of the extracellular and intracellular proton-binding sites, respectively, and
BoHo and BiHi are the proton-bound states of these binding sites. Qo and Qi are equilibrium constants that depend on the pKa of each of these binding
states. C, D, and E are the coupling constants between each of the indicated modules. (B) All the individual states implied in (A) are depicted, along
with proton-binding states and the appropriate equilibrium constants. C, closed states, O, open states. OHx, OHxHx and CHx, CHxHx are single or
double proton-occupied states, where x can be o for outside or i for inside-facing binding sites.
with a binding site in the target molecule that is located within the electric field. Fitting the data
according to this model, and given that zinc is a divalent ion, its apparent binding site is located at a
fraction d = 0.2 of the membrane electric field from the extracellular side (Figure 8B).
Zinc blockage proceeds very fast. At 1 mM, the channels are blocked almost instantaneously, and
the inhibition washes off very fast as well (Figure 8C). Finally, we report the dose-response curve
(Figure 8D). The inhibition dose-response curve can be fit by a Hill equation (Equation 4) with a
slope factor of nearly 0.5 and an apparent dissociation constant, KD, of 27 mM.
Discussion
A few ion transport mechanisms in reef-building corals have been described, but up to now, no ion
channels have been characterized from any scleractinian species. Here we have shown that voltage-
gated proton-permeable channels formed by the Hv1 protein are present in corals. In particular, we
have cloned these channels from two species of the genus Acropora, A. millepora and A. palmata. It
is interesting that the protein sequence of these proteins shows a very high degree of conservation,
suggesting that, even when the two species are found in different oceans, they haven’t had time to
diverge substantially or alternatively; selective pressures on these channels are very similar in both
species. The presence of Hv1 sequences in many other species of corals from disparate clades sug-
gests that Hv1 plays an important role in coral physiology.
Hv1 channels are formed by a protein fold that is structurally equivalent to the VSDs of canonical
voltage-gated channels (Sasaki et al., 2006; Ramsey et al., 2006). The VSD is formed by a bundle
of four antiparallel alpha helices (Takeshita et al., 2014). In some species, it has been shown that
Hv1 channels are dimeric (Lee et al., 2008; Mony et al., 2020; Lee et al., 2008). Accordingly, we
have also shown here that the AmHv1 is a dimer. Our FRET results are consistent with the high pro-
pensity to form a coiled coil shown by its C-terminal domain.
Rangel-Yescas et al. eLife 2021;10:e69248. DOI: https://doi.org/10.7554/eLife.69248 11 of 24Research article Structural Biology and Molecular Biophysics Figure 8. Block of AmHv1 channels by extracellular zinc. (A) Acropora millepora Hv1 (AmHv1)-mediated currents from an outside-out patch in the absence (top) and presence of 10 mM zinc (middle) and after washing of zinc (bottom). The scale bars apply to the three current families. Voltage pulses lasted 500 ms and were from 80 to 140 mV in 20 mV steps. The DpH = 1 with pHi = 6 and pHo = 7. (B) Normalized current-voltage relationships before and in the presence of 10 mM zinc from four patches as in (A). The gray squares are the ratio Izinc(V)/I(V), which gives the voltage-dependence of Figure 8 continued on next page Rangel-Yescas et al. eLife 2021;10:e69248. DOI: https://doi.org/10.7554/eLife.69248 12 of 24
Research article                                                                                            Structural Biology and Molecular Biophysics

Figure 8 continued
                                                                                        1
the blocking reaction. The blue curve is the fit to the Woodhull equation FB ¼         dzðV V0:5 Þ
                                                                                                     , where FB is the fraction of the current blocked, d is the
                                                                                 1þe      KB T

fraction of the electric field where the blocker binds, z is the valence of the blocker, V0.5 is the potential where half of the current is blocked, KB is
Boltzmann’s constant, and T is the temperature in Kelvin. The fitting parameters are d = 0.19, V0.5 = 77.6 mV. (C) The effect of zinc is fast. Application of
1 mM zinc to an outside-out patch produces almost instantaneous block of ~90% of the current. The effect also washes off quickly upon removal of zinc.
Trace colors are as in (A). Voltage pulse was 100 mV applied every 5 s. (D) Dose-response curve of zinc block of AmHv1 obtained at 100 mV. The
continuous curve is a fit of the data to Equation 4 with apparent KD = 27.4 mM and n = 0.48.
The online version of this article includes the following source data for figure 8:
Source data 1. Source data for Figure 8.

                                          Hv1 channels are different from canonical voltage-gated channels in that both voltage sensing
                                      and permeation are mediated through a single protein domain. Voltage sensing is thought to occur
                                      through the interaction of charged amino acid side chains with the electric field, leading to
                                      the outward movement of the fourth domain or S4, in a similar fashion to other voltage-sensing
                                      domains (Carmona et al., 2018; De La Rosa and Ramsey, 2018). This outward movement of the S4
                                      is coupled to protons moving through the VSD in a manner that is not completely understood
                                      (Randolph et al., 2016). Most proton-permeable channels seem to have evolved to extrude protons
                                      from the cell, and toward this end, their voltage dependence is tightly modulated by the proton gra-
                                      dient between extracellular and intracellular solutions (Cherny et al., 1995).
                                          Our electrophysiology experiments show that these coral channels give rise to proton currents
                                      when expressed in HEK293 cells and that they retain the functional characteristics that have been
                                      shown to define the class in other species, such as very high selectivity for protons, activation by
                                      voltage, and modulation of this activation by the proton gradient. The new channels reported here
                                      activate faster than the human Hv1 channel. It has been known that different orthologs of Hv1 acti-
                                      vate with varying kinetics. For example, sea urchin, dinoflagellate, and recently, fungal Hv1 channels
                                      activate rapidly, while most mammalian counterparts have slow activation rates (Musset et al.,
                                      2008; Smith et al., 2011; Zhao and Tombola, 2021). A comparative study suggests that two amino
                                      acids in the S3 transmembrane segment are important determinants of kinetic differences between
                                      sea urchin and mouse Hv1 (Sakata et al., 2016). The authors suggest that the time course of activa-
                                      tion is slow in channels containing a histidine and a phenylalanine at positions 164 and 166, respec-
                                      tively (mouse sequence numbering). The AmHv1 has a histidine at an equivalent position, 132, and a
                                      methionine at 134. It is possible that this last amino acid in AmHv1 confers most of the fast kinetics
                                      phenotype. A separate work has shown that a lack of the amino-terminal segment in human sperm
                                      Hv1 also produced fast-activating channels (Berger et al., 2017). Interestingly, the Acropora chan-
                                      nels have a shorter amino-terminal sequence, which could also contribute to their fast kinetics.
                                          One of the most interesting characteristics found in these new proton channels is their modula-
                                      tion by the proton gradient. As opposed to other Hv1 channels, we can observe a trend toward satu-
                                      ration of the V0.5 for activation as a function of DpH at extreme values of this variable. A tendency
                                      toward saturation of the V0.5-DpH relationship has been observed in mutants of the hHv1 channel
                                      (Cherny et al., 2015) or at negative values of DpH for a snail Hv1 (Thomas et al., 2018), but it seems
                                      it can be fully appreciated in AmHv1. Since our model explains the observation of saturation of volt-
                                      age gating at extreme values of DpH as a consequence of the existence of two saturable sites for
                                      proton binding, we attribute this behavior to the large separation of pKa values for the extracellular
                                      and intracellular proton-binding sites. Thus, channels that do not show saturation might have sites
                                      with well-separated and differing pKa values. Evolutionary fine tuning of these pKa values will pro-
                                      duce channels with pH activation in ranges adapted to their physiological function.
                                          It is important to point out that the external and internal proton-binding sites can be part of the
                                      voltage sensor itself. We envision these sites as being formed not by distinct protonatable amino
                                      acids but by a network of electrostatic interactions between amino acids in S4 and other transmem-
                                      brane segments. In this context, the pKa values of the sites in our model do not reflect pKas of indi-
                                      vidual amino acids but of the whole proton-binding site. Recent works by Carmona et al., 2021
                                      and Schladt and Berger, 2020 suggest that voltage sensing is directly responsible for pH gating.
                                      These authors suggest that the energy of the pH gradient is part of the free energy needed for

Rangel-Yescas et al. eLife 2021;10:e69248. DOI: https://doi.org/10.7554/eLife.69248                                                                           13 of 24
Research article Structural Biology and Molecular Biophysics
voltage-sensor movement. This purely energetic statement is encompassed in our model as the cou-
pling factors between voltage-sensor movement and proton binding, which are in fact energetic
factors.
In our model, the strength of allosteric coupling of these sites and the voltage sensor determines
if saturation is observed over a short or extended range of DpH values and the range of values of
V0.5 that a particular channel can visit. Coupling also determines the value of the slope of the DpH vs
V0.5 curve. Values larger or smaller than the typical ~40 mV/pH are obtained as a consequence of
strong or weak coupling between binding and voltage-sensor movement, respectively (Figure 6—
figure supplement 2). Our model should provide a framework to better understand the gating
mechanisms in future work.
It is clear that more complicated models, with a larger number of voltage-dependent and -inde-
pendent steps (Villalba-Galea, 2014) and coupling to protonation sites, should be the next step to
improve data fitting and explore voltage- and proton-dependent kinetics. In particular, these types
of models can help explain mutagenesis experiments exploring the nature of the protonation sites.
For example, Villalba-Galea, 2014 proposed the existence of a voltage-independent step in Hv1
gating, and this can be easily incorporated in the model proposed here, as is the fact that hHv1 and
AmHv1 channels are dimers. The present form of the allosteric model has a single subunit. Since gat-
ing in dimeric channels seems to be cooperative, allosteric models have the advantage that coopera-
tivity between subunits can be handled naturally by including coupling between two voltage
sensors.
Hv1 proton channels seem fundamental in handling fluctuations in intracellular pH and take part
in several well-characterized physiological processes that depend on proton concentration changes,
such as intracellular pH regulation, sperm flagellum beating, reactive oxygen species production and
bacterial killing in immune cells, initiation of bioluminescence in single-celled algae, and so on
Castillo et al., 2015.
What is the function of voltage-gated proton channels in corals? The deposition of a CaCO3 exo-
skeleton is one of the main defining characteristics of scleractinians; however, the ionic transport
mechanisms involved in this process are mostly unknown. In order for aragonite precipitation to
occur favorably, the pH of the calicoblastic fluid, right next to the skeleton, is maintained at high lev-
els, between 8.5 and 9 and above the pH of sea water (Le Goff et al., 2017). It has been posited
that corals control this pH via vectorial transport of protons to the gastrodermal cavity (Jokiel, 2013).
Since proton transport away from the site of calcification would incur a drastically lower intracellular
pH in the cells of the aboral region, we propose that, given their ability to rapidly regulate
the intracellular pH (De-la-Rosa et al., 2016), Hv1 proton channels contribute by transporting pro-
tons from the cells. Thus, these proton channels could be a major component of the mechanisms of
intracellular pH regulation in corals. Given that the activation range of Hv1 is controlled by the pH
gradient, a large intracellular acidification would facilitate opening of these channels at the resting
potential of cells, which is presumably negative.
The finding that coral Hv1 channels retain their sensitivity to Zn2+ opens the possibility of using
this ion as a pharmacological tool to study the role of proton channels in pH homeostasis. It is inter-
esting that a recent report has shown detrimental effects of zinc supplementation on coral growth
(Tijssen et al., 2017), a result that could be explained by zinc inhibition of Hv1.
The physiological role of Hv1 channels in corals might be essential in the response of these organ-
isms to ocean acidification. Although further research is needed to understand the cellular and sub-
cellular localization of these channels, we theorize that as the pH of sea water acidifies, gating of
Hv1 should require stronger depolarization, thus hindering its capacity to transport protons from the
cell. This will contribute to a diminished calcification rate and less aragonite saturation of the CaCO3
skeleton. It would be interesting and important to study the effects of acidification on Hv1 physiol-
ogy and pH regulation in corals in vivo. Essentially nothing is known about the electrophysiological
properties of coral cells. This report represents the first time that an ion channel has been cloned
and characterized in any coral and should open a new avenue of research, such as uncovering the
cellular and possible subcellular localization of these channels and carefully measuring their physio-
logical role in vivo.
Rangel-Yescas et al. eLife 2021;10:e69248. DOI: https://doi.org/10.7554/eLife.69248 14 of 24Research article Structural Biology and Molecular Biophysics
Materials and methods
Identification of Hv1 sequences and cloning
Blast searches of the transcriptome of the Indo-Pacific coral A. millepora (Moya et al., 2012)
detected four sequences that we identified as belonging to a putative proton-permeable channel.
The GenBank accession numbers for these are XM_015907823.1, XM_015907824.1,
XM_029346499.1, and XM_029346498.1. We designed two pairs of oligonucleotides to amplify two
of these sequences (Table 1). Total RNA was extracted from the tissue obtained from a fragment of
A. millepora acquired from a local salt-water aquarium provider (Reefservices, Mexico City). RNA
was extracted by dipping the whole fragment for 2 min in 5 ml of solution D (4 M guanidinium thio-
cyanate, 25 mM sodium citrate, 5% sarkosyl, and 0.1 M 2-mercaptoethanol). After incubation,
the tissue was removed by gently pipetting the solution for 2 min. At this point, the calcareous skele-
ton was removed and RNA extraction continued according to Chomczynski and Sacchi, 1987. Total
RNA (1 mg) from A. millepora was used for reverse transcription polymerase chain reaction (RT-PCR),
employing oligo dT and SuperScripII reverse transcriptase (Invitrogen, USA). cDNA obtained from
RT-PCR was used in three PCRs using oligos (1) AcHv1Nter5´ and 3´, (2) AcHv1Cter5´ and 3´, and (3)
AcHv1Nter5´ and AcHv1Cter3´ (Table 1). The Platinium Pfx DNA polymerase (Invitrogen) was used
for amplification according to the manufacturer’s instructions. 1 ml of Taq DNA polymerase (Invitro-
gen, USA) was used for 10 min at 72˚C to add a poly-A tail at 5’ and 3’ ends and facilitate cloning
into the pGEM-T vector.
The PCR 3 gave rise to a full open reading frame (ORF) containing AmHv1. New oligos,
AcHv1Nter5´ and AcHv1Cter3´, containing restriction sites Kpn1 and Not1, respectively, were used
to re-amplify the ORF in pGEM-T and subclone it into pcDNA3.1 for heterologous expression.
The Hv1 channel from A. palmata was cloned from a fragment of an adult specimen collected
from the Limones Reef off of Puerto Morelos, Mexico. RNA extraction from small coral pieces was
carried out by flash freezing in liquid nitrogen and grinding the frozen tissue. All other cloning proce-
dures were as for A. millepora. All clones and DNA constructs were confirmed by automatic
sequencing at the Molecular Biology Facility of the Instituto de Fisiologı́a Celular at UNAM.
Heterologous expression of AmHv1
All electrophysiological and FRET experiments were carried out in HEK293 cells heterologously
expressing the specified clone or DNA construct. HEK293 cells were acquired from ATCC (Gaithers-
burg, MD, USA) and were found to be free of mycoplasma infection using a PCR-based detection kit
(Sigma-Aldrich, USA). Cells were grown on 100 mm culture dishes with 10 ml of Dulbecco’s Modified
Eagle Medium (DMEM, Invitrogen) containing 10% fetal bovine serum (FBS) (Invitrogen, USA) and
100 units/ml-100 mg/ml of penicillin-streptomycin (Invitrogen, USA), incubated at 37˚C in an incuba-
tor with 5.2% CO2 atmosphere. When cells reached 90% confluence, the medium was removed, and
the cells were treated with 1 ml of 0.05% trypsin-ethylenediaminetetraacetic acid (EDTA) (Invitrogen,
USA) for 5 min. Subsequently, 1 ml of DMEM with 10% FBS was added. The cells were mechanically
dislodged and reseeded in 35 mm culture dishes over 5x5 mm coverslips for electrophysiology or in
35 mm glass bottom dishes for FRET experiments. In both cases, 2 ml of complete medium was
used. Cells at 70% confluence were transfected with pcDNA3.1-AmHv1 prepared from a plasmid
midiprep, using jetPEI transfection reagent (Polyplus Transfection, France). For patch-clamp experi-
ments, pEGFP-N1 (BD Biosciences Clontech, USA) was cotransfected with the channel DNA to
Table 1. Oligonucleotides used to clone amino- and carboxy-terminal partial sequences of AmHv1
from total reverse-transcribed mRNA from A. millepora.
Oligo name Sequence
AcHvNt5´ ATGATTGATGCAAGAACCAGACGATCGAGCATGGATGAT
AcHvNt3´ TGATCCTGCTCTCAAGTCAAGAACCAACTCAGCAATGAC
AcHvCt5´ ATGGGATTCACATTTTCAAGCACAAATGGAGGTGTTT
AcHvCt3´ TCAGCTTTGTTTTAATGTTGTCAATTCAGACTCCAACTG
Rangel-Yescas et al. eLife 2021;10:e69248. DOI: https://doi.org/10.7554/eLife.69248 15 of 24Research article Structural Biology and Molecular Biophysics
visualize successfully transfected cells via their green fluorescence. Electrophysiological recordings
were done 1 or 2 days after transfection.
FRET measurement of stoichiometry
In order to measure the stoichiometry of subunit interaction employing FRET, we constructed fusion
proteins between AmHv1 and mCerulean and mCitrine FPs, to be used as the donor and acceptor,
respectively. The FPs were fused to the N-terminus of the channel in order to disrupt as little as pos-
sible the C-terminus-mediated interaction. These constructs were transfected into HEK293 cells as
described above. The apparent FRET efficiency between FP-containing constructs, Eapp, was mea-
sured via sensitized emission of the acceptor, employing the spectral-FRET method (De-la-
Rosa et al., 2013; Zheng et al., 2002). Fluorescence was measured in a home-modified TE-2000U
inverted epifluorescense microscope (Nikon, Japan). The excitation light source was an Argon Ion
laser (Spectra-Physics, Germany) mainly producing light at 458, 488, and 514 nm; the laser beam
was focused and then collimated using a 3 mm ball lens and a 50-mm focal length planoconvex lens.
Collimated light is steered with a mirror and then is focused into the objective back focal plane by a
300-mm focal length achromatic lens.
Cells were imaged with a Nikon 60x oil immersion objective (numerical aperture 1.4). The detec-
tion arm of the microscope is coupled to a spectrograph (Acton Instruments, USA) and an EM-CCD
camera (Ixon Ultra, Andor, Ireland) controlled by Micromanager software (Edelstein et al., 2014).
Excitation was achieved with appropriate excitation filters (Chroma, Vermont, USA) for mCerulean
(458 nm) and mCitrine (488 nm). The emission filter was a long-pass filter in order to collect the full
emission spectrum of the FRET pair. Apparent FRET efficiency is plotted as a function of the fluores-
cence intensity ratio (Idonor/Iacceptor). This relationship can be fitted with models of subunit association
with a fixed stoichiometry, according to De-la-Rosa et al., 2013.
Electrophysiology
All chemicals for solutions were acquired from Sigma-Aldrich (Mexico). Proton current recordings
were made from HEK293 cells expressing pCDNA3.1-AmHv1 in the inside-out, whole-cell, and out-
side-out configurations of the patch-clamp recording technique. For whole-cell and inside-out
recordings, the extracellular solution (bath and pipette, respectively) was (in mM) 80 tetramethylam-
monium and methanesulfonic acid (TMA-HMESO3), 100 buffer ((2-(N-morpholino)ethanesulfonic
acid (MES): pH 5.5, 6.0, and 6.5; 4-(2-hydroxyethyl)-1-piperazineethanesulfonic acid (HEPES): pH 7.0,
7.5), 2 CaCl2, 2 MgCl2, and pH-adjusted N-methyl-d-glucamine/tetramethylammonium
hydroxide (NMDG/TMA-OH) and HCl). The intracellular solution (pipette and bath, respectively) was
(in mM) 80 TMA-HMESO3, 100 buffer (MES: pH 5.5, 6.0, and 6.5; HEPES: pH 7.0, 7.5), 1 ethylene
glycol tetraacetic acid (EGTA), and pH-adjusted NMDG/TMA-OH and HCl.
Macroscopic currents were low-pass filtered at 2.5 kHz, sampled at 20 kHz with an Axopatch
200B amplifier (Axon Instruments, USA) using an Instrutech 1800 AD/DA board (HEKA Elektronik,
Germany) or an EPC-10 amplifier (HEKA Elektronik, Germany). Acquisition control and initial analysis
were done with PatchMaster software. Pipettes for recording were pulled from borosilicate glass
capillaries (Sutter Instrument, USA) and fire-polished to a resistance of 4–7 MW when filled with
recording solution for inside- and outside-out recordings and 1–3 MW for the whole-cell recording.
The bath (intracellular) solutions in inside-out patches were changed using a custom-built rapid solu-
tion changer. For whole-cell recordings, all the bath solution was exchanged to manipulate pH. In
some recordings, linear current components were subtracted using a p/4 subtraction protocol.
Conditions for recording zinc effects
The effect of zinc was evaluated in outside-out patches at a DpH of 1. The bath solution composition
was (in mM) 100 TMA-HMESO3, 100 HEPES, 8 HCl, 2 CaCl2, 2 MgCl2, and the indicated concentra-
tion of ZnCl2. The pipette solution was (in mM) 100 TMA-MESO3, 100 MES, 8 HCl, 10 EGTA, and 2
MgCl2. Both solutions were adjusted to pH 7 and pH 6, respectively, with TMA-OH/HCl. Patches
were placed in front of a perfusion tube that was gravity-fed with the appropriate solution. Tubes
were changed with a home-built rapid perfusion system.
Rangel-Yescas et al. eLife 2021;10:e69248. DOI: https://doi.org/10.7554/eLife.69248 16 of 24Research article Structural Biology and Molecular Biophysics
Data analysis
Conductance, G, was calculated from I-V relations assuming ohmic instantaneous currents, according
to
I ðV Þ ¼ G ðV Vrev Þ
The normalized G-V relations were fit to a Boltzmann function according to Equation 1,
G 1
¼ (1)
Gmax 1 þ exp qðV V0:5 Þ
KB T
Here, V0.5 is the voltage at which G/Gmax = 0.5, q is the apparent gating charge (in elementary
charges, eo), KB is the Boltzmann constant, and T is the temperature in Kelvin (22˚C).
The time constant of activation was estimated via a fit of the second half of currents to the
equation
ðt dÞ
I ðtÞ ¼ Iss 1 eð t Þ (2)
where Iss is the amplitude of the current at steady state, d is the delay of the exponential with
respect to the start of the voltage pulse, and t is the time constant, both with units of ms. The volt-
age-dependence of d and t was estimated from a fit to equation
k ðV Þ ¼ k ð0Þeð Vqi =KB T Þ
(3)
where i stands for d or t and k(0) is the value of either parameter at 0 mV.
Currents in the presence of zinc were normalized to the current before application of the ion to
obtain a normalized fraction of current blocked as FB = 1-I/Imax. The zinc dose-response curve was
fitted to Hill’s equation in the form
1
FB ¼ n H (4)
KD
1þ ½Zn2þ o
where KD is the apparent dissociation constant, [Zn2+]o is the extracellular zinc concentration, and nH
is the Hill coefficient.
Acknowledgements
We would like to thank Itzel A Llorente for the excellent technical assistance. We also thank Gerardo
Coello from IFC-UNAM for help with analysis of coral transcriptomes. This work was funded in part
by grant no. IN215621 from DGAPA-PAPIIT-UNAM to LDI, grant no. 247765 to ATB, and grant no.
IN200720 to TR. EM was funded by Conacyt-Fronteras en la Ciencia Grant No. 2.
Additional information
Competing interests
Leon D Islas: Reviewing editor, eLife. The other authors declare that no competing interests exist.
Funding
Funder Grant reference number Author
Universidad Nacional Autóno- IN215621 Leon D Islas
ma de México
Universidad Nacional Autóno- IN200720 Tamara Rosenbaum
ma de México
Universidad Nacional Autóno- IN247765 Anastazia T Banaszak
ma de México
Rangel-Yescas et al. eLife 2021;10:e69248. DOI: https://doi.org/10.7554/eLife.69248 17 of 24You can also read