Discovering Common Motifs in Cursor Movement Data for Improving Web Search
←
→
Page content transcription
If your browser does not render page correctly, please read the page content below
Discovering Common Motifs in Cursor Movement Data
                    for Improving Web Search

                          Dmitry Lagun                                          Mikhail Ageev ∗                                Qi Guo ∗
                         Emory University                                 Moscow State University                              Microsoft
              dlagun@mathcs.emory.edu                                      mageev@yandex.ru                         qiguo@microsoft.com

                                                                             Eugene Agichtein
                                                                                 Emory University
                                                                     eugene@mathcs.emory.edu

ABSTRACT                                                                                      become an active area of research, as these interactions provide addi-
Web search behavior and interaction data, such as mouse cursor                                tional insights into searcher behavior compared to coarser models of
movements, can provide valuable information on how searchers                                  clicks alone. In particular, recent work has demonstrated the coordi-
examine and engage with the web search results. This interaction                              nation between eye gaze position and mouse cursor movements [38,
data is far richer than traditional search click data, and can be used                        19, 25] and showed that both gaze and cursor interactions indicate
to improve search ranking, evaluation, and presentation. Unfortu-                             user preferences [7, 27, 20]. Search engine companies also began
nately, the diversity and complexity inherent in this interaction data                        investigating and modelling the cursor movement data to improve
make it more difficult to capture salient behavior characteristics                            understanding of search result examination patterns [38], ranking
through traditional feature engineering. To address this problem, we                          of search results [26, 43], understanding of search result abandon-
introduce a novel approach of automatically discovering frequent                              ment [27], and evaluation of content layout and noticeability [36].
subsequences, or motifs, in mouse cursor movement data. In or-                                   While the importance of analyzing mouse cursor data for search
der to scale our approach to realistic datasets, we introduce novel                           is now evident, it often involves intensive manual effort [7, 20, 25]
optimizations for motif discovery, specifically designed for mining                           to gain insights about the data, and to make use of it for practical
cursor movement data. As a practical application, we show that by                             applications. For example, video recordings (or, similarly, a series of
encoding the motifs discovered from thousands of real web search                              snapshots) from online analytic services, typically allow the replay
sessions as features, enables significant improvements on result                              of visitor interactions in great detail, but the process of viewing
relevance estimation and re-ranking tasks, compared to a state-of-                            the replays is time-consuming – it is virtually impossible to view
the-art baseline that relies on extensive feature engineering. These                          all the replays even for a relatively small site with thousands of
results, complemented with visualization and qualitative analysis,                            daily visits, not to mention for larger web sites with millions of
demonstrate that our approach is able to automatically capture key                            visitors. The alternative approach of visualizing areas of high cursor
characteristics of mouse cursor movement behavior, providing a                                activity by using “heatmaps”, that use different colors to indicate
valuable new tool for search behavior analysis.                                               different levels of activity, provides a more complete view of the
                                                                                              user behavior data in aggregate, but suffers from loss of detail about
                                                                                              the sequences of interactions of individual users.
Keywords                                                                                         In this paper, we propose a novel technique to automatically and
Web search behavior mining; mouse cursor movement analysis; web                               efficiently extract common patterns from search result and landing
search ranking and evaluation                                                                 page examination data, obtained via mouse cursor tracking. Our
                                                                                              method, based on frequent subsequence mining, is able to capture
1.      INTRODUCTION                                                                          common user- and location-invariant sequences from the mouse cur-
   Millions of users interact with Web search engines daily. These                            sor data, some of which would be difficult to identify or describe by
interaction patterns contain valuable information, which could be                             manual inspection or feature engineering. In data mining literature,
useful for search engines to improve user experience, and for site                            such frequent sub-sequences have been called motifs [34] because of
designers to improve website layout and usability [2, 11, 6, 32]. Re-                         the analogy to their discrete counterparts in computational biology.
cently, studying fine-grained user behavior such as eye-gaze move-                            For the rest of the paper, we adapt the term motif to refer to a fre-
ments [16, 11, 7] and mouse cursor movements [38, 18, 27] have                                quent pattern, representing a group of similar subsequences derived
                                                                                              from the the mouse cursor movement data. We will define mouse
∗
    Work done at Emory University.                                                            cursor motifs more precisely in Section 3.
                                                                                                 An example of a common motif extracted from the mouse cursor
Permission to make digital or hard copies of all or part of this work for personal or         data is shown in Figure 1. This motif corresponds to the common
classroom use is granted without fee provided that copies are not made or distributed         search behavior of “following” examination behavior (identified by
for profit or commercial advantage and that copies bear this notice and the full cita-
tion on the first page. Copyrights for components of this work owned by others than
                                                                                              Rodden et al. [38]). In this example, the user appears to examine the
ACM must be honored. Abstracting with credit is permitted. To copy otherwise, or re-          second and third search results, before returning to click on the first
publish, to post on servers or to redistribute to lists, requires prior specific permission   result. This behavior could be used to infer that a user has examined
and/or a fee. Request permissions from Permissions@acm.org.                                   the second and third results and judged them to be non-relevant,
WSDM’14, February 24–28, 2014, New York, New York, USA.                                       providing valuable additional information to augment the click data.
Copyright 2014 ACM 978-1-4503-2351-2/14/02 ...$15.00.
http://dx.doi.org/10.1145/2556195.2556265.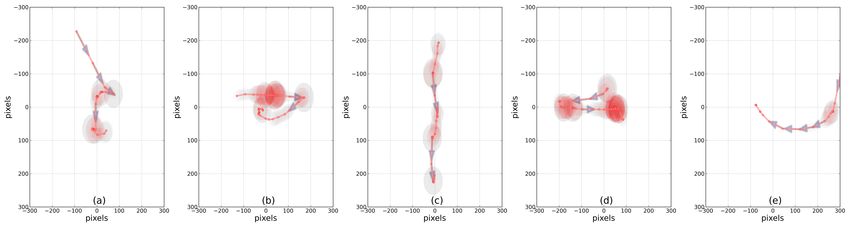
Mouse Cursor Data in Web Search: Modeling searcher attention
                                                                           and interest has wide-ranging applications in web search ranking,
                                                                           evaluation, and interface design. while traditionally most of the
                                                                           experimental work on user attention relied on infrared eye tracking
                                                                           which allows tracking eye movement on computer screen at great
                                                                           detail, however recently, mouse cursor tracking emerged as more
                                                                           accessible and scalable proxy for user’s attention (e.g., [19] and
                                                                           [25]). One of the earliest studies of mouse cursor and eye gaze
                                                                           alignment in search was reported by Rodden et al. [38], where the
                                                                           authors discovered the coordination between a user’s eye movements
                                                                           and mouse movements when scanning a web search results page,
                                                                           and identified three patterns of active mouse usage: following the
                                                                           eye vertically with the mouse, following the eye horizontally with the
                                                                           mouse, and using the mouse to mark a promising result. Guo and
                                                                           Agichtein [19] extended this work to predict eye-mouse coordination
                                                                           (i.e., whether the mouse cursor is in close proximity to eye gaze at
                                                                           any given point in time) by modeling mouse movements. This work
                                                                           was further extended by Huang et al. [25] to directly predict the gaze
                                                                           position from mouse cursor movement. These efforts solidify the
                                                                           evidence that a user’s attention in web search can be approximated
                                                                           by using mouse cursor movement and other interaction data.
                                                                              In addition to studying user attention, mouse cursor data have
                                                                           been used for more practical tasks. Goecks and Shavlik [15] mod-
                                                                           eled user actions such as mouse activity to infer user’s interest in
                                                                           web pages. Shapira [41] studied several mouse cursor-based implicit
Figure 1: An example automatically discovered motif from mouse             interest indicators and found that the ratio of mouse movement to
cursor data (shaded in green), corresponding to the common “follow”        reading time was a good indicator of the explicit page rating. Guo
searcher behavior, where gaze (red circles) briefly follows the mouse      and Agichtein [17] modeled mouse cursor movement and other in-
cursor (blue crosses). The “end” label indicates the result click.         teractions for inferring general search intent such as navigational
                                                                           vs. informational, as well as other intent categories, allowing for
                                                                           more accurate future ad clickthrough prediction [18]. Huang et
   As searchers examine results and pages at different rates, it is dif-   al. [27] found that hovering over a search result provides indication
ficult to find exact matches between mouse cursor movements across         of relevance in addition to result clickthrough. Huang et al. [26] also
different users. For this reason, we adapt a more robust distance          developed models to predict result clickthrough by incorporating
measure, namely Dynamic Time Warping (DTW), that is capable                mouse hovering and scrolling information. White and Buscher [43]
to identify similar mouse cursor trajectories. However, discovering        proposed a method that uses text selections as implicit feedback.
such motifs from large cursor movement datasets is computationally         Guo and Agichtein [20] proposed a Post Click Behavior (PCB)
expensive, and is not feasible with existing motif mining techniques.      model to estimate the “intrinsic” relevance by engineering a wide
To address this problem, we propose novel optimizations for motif          array of features to capture post-click behavior such as mouse cursor
discovery, specifically designed for cursor movement data, based           movements and scrolling, resulting in substantial improvements
on spatial indexing and learning-based similarity metrics. These           in estimating personalized search relevance and re-ranking search
optimizations enable an order of magnitude speed-up in motif dis-          results. Recently, Ageev et al. [1] demonstrated that cursor data
covery on realistic datasets. As a practical application, the cursor       collected on search result landing pages can also be used to improve
movement motifs discovered by our approach can then be used as             quality of search result summaries, or “snippets”.
features for more accurate estimation of search result relevance and          Unfortunately, mouse cursor activity is complex and noisy, and
for significantly improving the quality of search result ranking.          often specific to each user (e.g., [43]) – making it difficult to ef-
   Specifically, our contributions are threefold:                          fectively discover robust predictive features. Previous approaches,
• A new scalable method for automatically discovering frequent             therefore, relied on extensive feature engineering (e.g., [20] and
  patterns, or motifs, from cursor movement data (Section 3).              [23]) to manually craft features applicable a specific task (e.g. rele-
                                                                           vance prediction). In contrast, we propose to automatically discover
• The first empirical study of common mouse cursor motifs discov-          common mouse cursor movement patterns, by adapting time series
  ered from real web search examination data (Section 4).                  analysis techniques from the data mining literature, to complement
• A practical demonstration of using the discovered mouse cursor           manual feature engineering used in prior research.
  motifs as features, resulting in significant improvements on search      Time Series Mining: Research on mining time series databases
  relevance estimation and re-ranking tasks (Section 5).                   included several directions: constructing low cardinality symbolized
                                                                           representations such as iSAX [42], Piecewise Aggregate Approxima-
Next, we describe related work, in order to place our contributions        tion [13] or other types of representations, such as discrete Fourier
in context.                                                                Transform or Discrete Wavelet Transform, for more comprehensive
                                                                           review consult [42]. Principle Component Analysis (PCA) [28]
2.    RELATED WORK                                                         is another popular dimensionality reduction technique employed
                                                                           for indexing and fast search in time series data bases. Despite the
  The related work spans several areas of research, namely web             efficiency benefits offered by dimensionality reduction techniques,
search behavior and interaction mining, time series mining, and fast       they only provide approximate search with respect to the original
similarity search.
representation, hence potentially degrading the accuracy of retrieval       3.    MOTIF MINING FROM CURSOR DATA
and thus potentially missing important patterns.                               This section describes our pattern (motif) extraction system. First,
    Taking a different tack, exact search in time series databases can      we define mouse cursor motifs more precisely, and state the problem
also be significantly sped-up by various pruning strategies. The            more formally. Then, we describe, in turn, the key components of
most well-known pruning strategies rely on some sort of a lower             our solution, that involves first generating and pre-processing many
bound, after calculating which, one can decide whether exact dis-           possible candidate subsequences, and then efficiently computing the
tance calculation is needed or it can be abandoned. Such lower              similarity between them to find the groups of similar subsequences
bounds include LB_Kim [31], LB_Yi [45], LB_Keogh [29] and                   to discover the frequent motifs. Thus, the steps are, respectively,
LB_Improved [33]. Among them, LB_Keogh, introduced by Keogh                 Candidate Generation and Pre-Processing (Section 3.2), Similarity
[29], exhibited excellent performance, and was successfully used            Computation (Section 3.4) and Efficient Computation of a Distance
in many time series applications [29]. Recently, Mueen et al.[35]           Measure (Section 3.5), which together comprise our frequent motif
introduced an efficient exact motif discovery algorithm, known as           discovery method.
the KM algorithm.
    Recall, that in order to account for the high variability between       3.1     Problem Statement
users’ examination speeds and different page layouts, we would                 We start with introducing the necessary notation to define a motif
like to use a more flexible distance measure, such as Dynamic Time          and our problem. Intuitively, we first need to define what constitutes
Warping (DTW). DTW [39] was initially introduced for spoken                 a non-trivial match between subsequences in cursor movement data,
word recognition, but since then, DTW has been applied to a vari-           and then use this definition to define frequent subsequences (or mo-
ety of applications including hand writing recognition, information         tifs), and in turn state our motif discovery problem more precisely.
retrieval, image recognition, shape matching for security purposes.         Match: Given a positive real number R as the range, or maximum
We refer an interested reader to the comprehensive review[29, 33,           distance, and a dataset of time series of cursor movements contain-
30]. DTW allows matching two time series with possibly different            ing subsequences A and B, then B is called a matching subsequence
lengths by computing the closest warping path between them. Thus,           of A, if Dist(A, B) ≤ R, and A and B were recorded from differ-
it is a flexible distance measure that is able to tolerate a web surfer’s   ent page visits. Here Dist(·, ·) a generic distance measure, such as
own pace of mouse cursor movement, allowing us to discover com-             Euclidian Distance or Dynamic Time Warping (DTW), defined be-
mon cursor movements across different users. Unfortunately, the             low. The reason to insist on different page visits is to avoid “trivial”
KM algorithm [35] was specifically designed for finding motifs              matches, most notably where A and B significantly overlap.
under Euclidian Distance, for which triangle inequality holds, and          Motif: For a set of two dimensional time series T = {(xi , yi )}N  i=1 ,
is therefore not appropriate for pattern discovery with DTW as the          and a subsequence length n, a motif M is defined as the subsequence
distance measure.                                                           M in T that has at least min_count matches, as defined above.
    More recently, there has been an effort in mining predictive subse-     Cursor Motif Discovery Problem: Given a set of two-dimensional
quences, called shapelets, from labeled data [44] or un-labeled [46]        time series representing mouse cursor movements T = {(xi , yi )}N    i=1 ,
time series data. Unfortunately, in applications with large amounts         the range R, the subsequence length n, and a threshold min_count,
of data, where coverage of the extracted motifs is important (e.g.,         find all motifs with match count higher than (min_count) and the
for asking questions such as “how many users perform a particular           distance Dist(·, ·) between each two of them is at least R.
mouse cursor movement?”), previous approaches do not scale up
to large datasets. That is, in our setting we are interested in find-       3.2     Candidate generation and pre-processing
ing all occurrences of a common motif, and not merely a single
                                                                               At this step our system creates all possible motif candidates that
re-occurrence of a given pattern.
                                                                            will be matched against each other in the similarity search. The
Similarity Search: The most common approach to speed-up search
                                                                            candidate motifs are generated by maintaining a sliding window of a
for similar objects is to construct an index that allows pruning far
                                                                            given length and shifting it for every example in the database. Every
objects without computation of similarity measure for each object
                                                                            shift of the time window creates a motif candidate. In our experi-
in index. The main idea for pruning similarity search is to prune
                                                                            ments we used a sliding window of 5 seconds. We experimented
far objects using triangle inequality [47]. For Euclidean distance
                                                                            with different values during development, and chose 5 seconds as
in a low-dimensional space there are efficient indexing techniques
                                                                            long enough to capture interesting behavior patterns, and yet short
such as R-Tree [4], approximation trees [40], and k-d Tree [9]. But
                                                                            enough to be able to capture short-term page visits. Other parameter
the DTW distance measure does not satisfy triangle inequality [33],
                                                                            values might be possible, to be explored further in future work.
and a heuristic approach is required to build an efficient index for a
                                                                               After a candidate sequence has been generated, we normalize
specific application [12]. Similarity measure learning has received
                                                                            the values by subtracting the means of the x and y coordinates
significant attention in machine learning community, primarily in
                                                                            for that given candidate. This step is crucial as it allows us to
clustering applications [5, 10, 3]. Surprisingly, to the best of our
                                                                            match subsequences in different regions of the page, focusing on the
knowledge, learning-based similarity measures have not yet been
                                                                            their shape similarity instead of mining sub-sequences that occur
applied to optimize similarity search in time series databases.
                                                                            in the same region area of screen. We do not otherwise rescale the
    In summary, prior work on using cursor data for implicit feedback
                                                                            values: in our development experiments with eye-gaze data, z-score
heavily relied on manually engineering cursor movement features
                                                                            normalization (suggested by Keogh et al. [37]) resulted in poor
in order to capture specific aspects of the cursor movement. This
                                                                            matches, as it leads to matching sub-sequences with large range to
process can be tedious and time-consuming, and has to be re-done
                                                                            small oscillations of eye-gaze within the fixation.
for each application. Our work proposes a general approach that
automatically and efficiently discovers common mouse cursor mo-             3.3     Distance Measure
tifs, which are not easily described by manual feature engineering.
To accomplish this, our work builds upon the state-of-the art in              A distance measure defines the similarity between different motif
time series mining, allowing for efficient motif extraction at scale,       candidates for grouping. As discussed above, we adapted a ro-
specifically optimized for mining cursor movement data.                     bust distance measure, namely Dynamic Time Warping (DTW) [29].
                                                                            DTW method calculates the smallest possible distance between two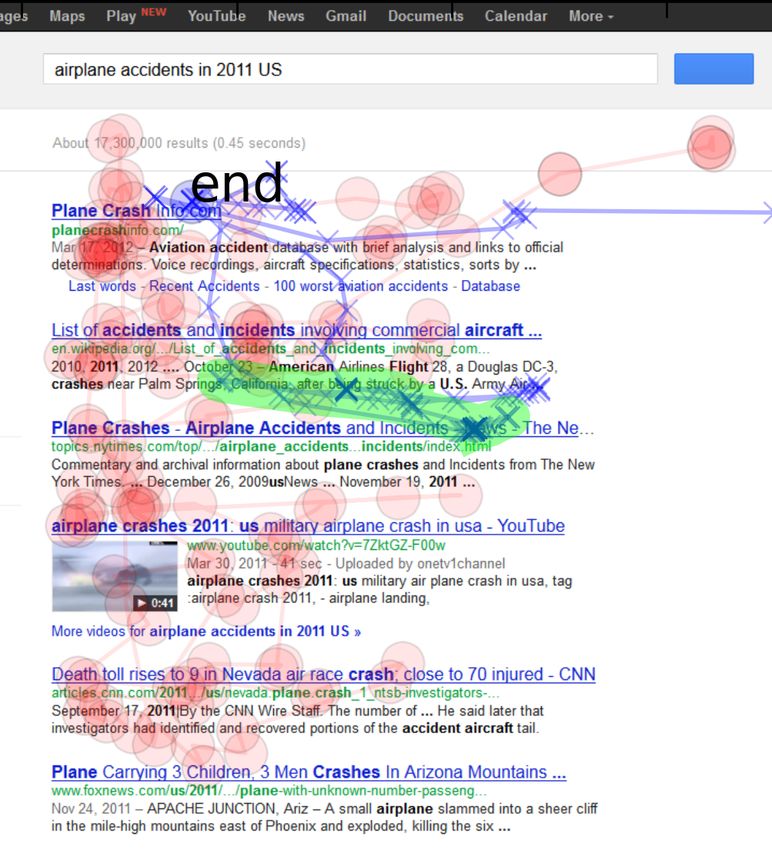
Algorithm 1 FindMotifs                                                  that are similar (have distance smaller than a R) to the candidate.
  function F IND M OTIFS(candidates, R, min_count)                      As motif candidates may match large number of overlapping sub-
     motif s ← {∅}                                                      sequences, the match count computed by F indSimilar can be
     for i = 1 to length(candidates) do                                 overestimated. To circumvent this problem, we only count matches
         similar ← F indSimilar(candidates, i, R)                       that are distinct, i.e. are outside of R range from each other. Finally,
         distinct ← DeDuplicate(similar, R)                             if motif frequency defined as number of distinct matches exceeds
         if length (distinct) ≥ min_count then                          min_count threshold the candidate is added to the set of discovered
              motif s ← motif s ∪ {i}                                   motifs. Note that exact implementation of F indSimilar depends
         end if                                                         on particular pruning strategy and is discussed below.
     end for
     return motif s
                                                                        3.5      Scaling Up Motif Discovery
  end function                                                             In order to scale up motif discover to realistic datasets, we adapt
                                                                        a number of optimization techniques, some well known, and some
                                                                        novel, combining them to speed up motif discovery by an order of
                                                                        magnitude.
time series by aligning one time series with another, such that, dis-
                                                                        Lower bounding: The idea of lower bounding has already become
tance between them is minimized. The example shown in Figure 2
                                                                        a standard technique to eliminate needless distance computations.
motivates the choice of DTW for mining mouse cursor data. Figure
                                                                        In order to do that, one needs to compute a relatively cheap lower
2 plots the x coordinates of a discovered cursor motif (shown in
                                                                        bound to see if DTW computation can be omitted. It is important to
blue) along with similar, but not identical, cursor movements (shown
                                                                        ensure that lower bound is exact, that is, it does not prune candidates
in different colors). While all movements exhibit similar periodic
                                                                        in proximity of the distance threshold. Among several known lower
behavior, each individual movement peaks at different point in time,
                                                                        bounds for DTW, the LB_Keogh lower bound is the commonly
making it impossible for a simple distance measure, e.g., Euclidean
                                                                        used solution due to its good pruning power and relatively fast
distance, to identify the common similarity between them. In con-
                                                                        computation time. LB_Keogh is calculated by computing Euclidian
trast, DTW allows to warp the series in time, such that they are
                                                                        distance between “envelope” time series, hence it is O(n). We
best aligned. The flexibility of DTW comes with an expense – the
                                                                        implemented LB_Keogh as suggested and outlined in [37] and
                                                                        supporting web page of the UCR-Suite1 . Other lower bounds are
                                                                        either more computationally expensive [33] or produce looser lower
                                                                        bounds, making pruning less efficient [31].
                                                                        Early Abandoning: During the computation of either DTW or
                                                                        LB_Keogh, if our current value of lower bound measure exceeds a
                                                                        given distance threshold, we can safely abandon the computation
                                                                        for the remaining candidates at that point, since the resulting lower
                                                                        bound value will be higher than the distance threshold. Similar idea
                                                                        can be implemented for DTW. As this idea comes with no additional
                                                                        computation cost we employ it in multiple places in our code. For
                                                                        example, due to the nature of mouse tracking data we can early
Figure 2: The x coordinate of an example motif (shown in blue)          abandon after LB_Keogh or DTW values exceeded on either x or
together with similar cursor movements recorded for different users     dimension.
(shown in different colors).                                            Distance Measure Learning (Novel Optimization): As an alter-
                                                                        nate way to speed up similarity search directly, one can consider
                                                                        reducing dimensionality of time series data by either obtaining
time required to compute DTW is O(n2 ), as opposed to O(n) for
                                                                        symbol representation such as iSAX [42] or Principal Component
Euclidean distance. To reduce the computation time, constrained
                                                                        Analysis (PCA [28]). Neither of these approaches directly address
version of DTW [39] is often used in practice. Constrained DTW
                                                                        the inaccuracy of time series measure calculated in the feature space
disallows warping (aligning) points that are farther than W time
                                                                        caused by the reduction. Instead, we employ the idea of learning
steps from each other. In our system we employ DTW constrained
                                                                        the distance metric, which was previously investigated by a number
with Sakoe-Chiba band [39] with W = n/2, where n is time se-
                                                                        of authors [5, 10, 3]. Note that DTW is not a metric, and trian-
ries length. Finally, the distance between two cursor movements is
                                                                        gular inequality does not hold for it [33]. However, it is possible
defined as the sum of DTW distances on the x and y dimensions.
                                                                        to approximate DTW by the Euclidian metric in the feature space.
3.4    Candidate Similarity Computation                                 More specifically, feature space comprised of simple time series
                                                                        statistics such as standard deviation and range of x and y coordinates
   As the number of motif candidates can grow large (e.g., for even     may well differentiate time series that are not similar and eliminate
a small realistic dataset we use for experiments, there are several     the need to compute the lower bound. In our experiments we use
millions of candidate motifs and tens of millions of time series        five features: standard deviation and ranges of x and y coordinates,
objects), we need an efficient way to search among the candidates       respectively, and the mean squared speed of cursor movement. The
to find similar objects. We employ early abandonment and lower          intuition is that we can expect distinct mouse gestures to have dif-
bounding techniques, described below, that are commonly used in         ferent shape characteristics such as ranges, and speed, thus being
time series mining applications [37] which allow us to speed up the     sufficiently separated in the simplified feature space. To learn the
similarity search significantly. Algorithm 1 describes our FindMotifs   feature weights directly from the data, we construct training and test
algorithm more precisely. The algorithm starts with initially empty     data sets by sampling a large number of time series candidates, and
set of motifs and considers each motif candidate one-by-one. For        computing the exact DTW for pairs of these time series. To obtain
each candidate F indSimilar function computes the raw number of
                                                                        1
matches, i.e. number of sub-sequences from the time series database         UCR-Suite: http://www.cs.ucr.edu/ eamonn/UCRsuite.html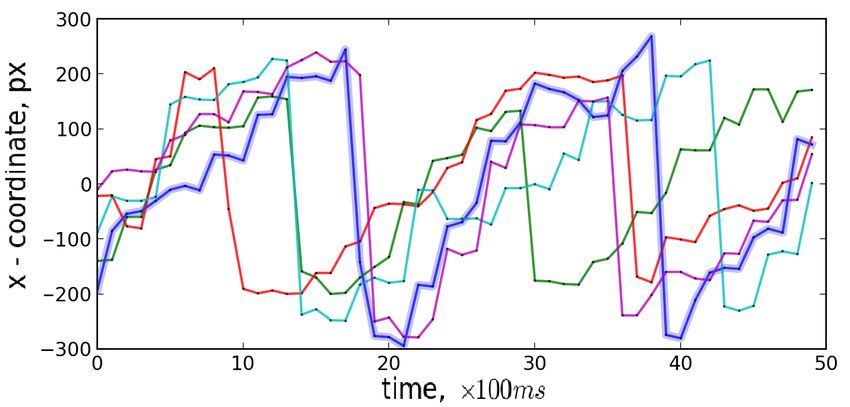
the weights of the features, such that the error between the feature-        Notation         Description
based Euclidian metric and the true DTW of the original time series          N                the number of sequences in the database
is minimized, we solve the following minimization problem:                   k                average time sequence length
                                                                                             distance threshold for DTW similarity
                                                        2 2
                                  d
                                                          !
                    X       2
                                 X
                                             (k)    (k)
                                                                             δ                Euclidean distance threshold for DM
     minimize             yij  −     w k xi − xj                  (1)                         pruning factor for DM, the average ratio of
         w                                                                   τDM (δ)
                     i,j         k=1                                                          instances in δ-neighborhood of a query point
   where x ∈ Rd and d is the number of time series features; i and j         τLB_Keogh ()    pruning factor for LB_Keogh
are index i-th and j-th time series example in the training data, yij is     PP = 1 − τ∗      pruning power of DM and LB_Keogh pruning
the DTW for pair of these time series and indices i and j enumerate          d=5              dimension of approximate distance function
all the training examples. Since it is an unconstrained optimization
problem, we can derive an efficient gradient descent-based method                       Table 1: Notations for Complexity Analysis
to find the feature weights w that minimize the error between the
feature-based Euclidian metric and DTW on the original pair of time         System Name                      LB_Keogh       DM     DM-RTree
series. The resulting distance measure is referred as DM through-           Exact
out the paper. As the reduced feature space dimensionality is smaller       LB_Keogh                              X
than the typical length of time series we are interested in, such a         DM                                    X          X
measure allows us to index time series efficiently using any of the         DM-RTree                              X          X          X
available spatial data structures, and subsequently pruning candi-
dates that are unlikely to be similar at much smaller computational              Table 2: Pruning strategies considered for each system.
cost.
R-Tree Indexing (Novel Optimization): For efficient query pro-
                                                                           depends on output size as O (τDM (δ)N log N ), so the complexity
cessing and effective candidate pruning we employ spatial indexing
                                                                           of our algorithm is:
using the R-Tree data structure. The R-Tree [24] is one of the most
                                                                                            O τDM (δ)N 2 d log N + k2

popular index structure for large multidimensional databases. Data
in the R-tree is organized in a tree, where each node contains a
bounding box of all entries in the corresponding subtree, and the          Thus, DM-RTree is expected to perform better than LB_Keogh prun-
leaf nodes store the data required for each child. In our case, the        ing, if the pruning factor τDM (δ)  1, as we verify experimentally
entries are points in five-dimensional space of similarity features        in the next section.
described above.                                                           4.    SCALABLE MOTIF DISCOVERY
   To search the R-tree for similar subsequences, the “query” is a
                                                                             This section demonstrates feasibility of our approach for large
five-dimensional hypercube, a δ-environment of a given sequence.
                                                                           scale mouse cursor dataset, and evaluates its efficiency along with
The search recursively traverses the tree starting from the root node.
                                                                           currently known techniques.
When a leaf node that overlaps with the query is reached, all entries
in that node are tested against the distance measure to a query point.     4.1    Experimental Setup and Dataset
If the distance is less then δ, then the candidate point is returned.
                                                                              We experiment with a dataset of mouse cursor movement col-
   It is known [4] that R-Tree performance degrades in high-dimensional
                                                                           lected “in the wild” using the EMU browser plugin [22] from over
spaces, where d > 16. In our case, the dimensionality is 5, allowing
                                                                           5,000 real users of a university library. The EMU plugin recorded
us to effectively reduce search space of candidates for the exact
                                                                           time-stamped events of user actions or changes in the web browser
computation of DTW measures.
                                                                           state, including url change, mouse cursor movements, clicks, page
Combining Pruning Strategies: Clearly, combining several prun-
                                                                           rendering and page content change events. The dataset contains
ing techniques may speed up our algorithm. In this paper we con-
                                                                           52,378 search engine result page (SERP) views, and 48,345 landing
sider four system variations depending on the pruning utilized. Ta-
                                                                           page views, resulting from over 31,860 queries. From this data,
ble 2 summarizes the pruning strategies enabled for each of the
                                                                           100,723 cursor movement trajectory subsequences were extracted,
system variations we have tested. The combined system, which we
                                                                           comprising the sequence dataset for the experiments in the rest of
call DM-RTree in the remainder of the paper, is expected to scale
                                                                           this section. We use this dataset for empirical performance com-
well to large datasets.
                                                                           parisons between LB_Keogh and our approach (Section 4.3), and
   We analyze the expected complexity of the approximate DM dis-
                                                                           to mine common motifs (Section 4.4) for subsequent relevance
tance measure, using the notation in Table 1. The exact computation
                                                                           experiments.
of DTW for a single query point requires O(k2 ) time, so the com-
putation of all -neighbors for all instances will take O(N 2 k2 ) time.   4.2    Evaluating Distance Measure Learning
The computation of LB_Keogh lower bound requires O(k) time
                                                                              To verify the feasibility of effective distance measure learning we
for a single point, so adoption of LB_Keogh pruning requires N 2
                                                                           constructed the training and test data splits by randomly sampling
LB_Keogh computations, plus the time for computation of exact
                                                                           a large number of time series pairs and calculating DTW for these
DTW for all selected points, a total of
                                                                           pairs. Overall, our data set contains nearly 500,000 pairs and as-
                   O N 2 k + τLB_Keogh ()N 2 k2

                                                                           sociated DTW distance values. The test and training datasets are
                                                                           split in equal proportions of 50%. We experimented with the five
time, which is better than exhaustive DTW computation, but also            similarity features described above. We obtain the feature weights
quadratic over the the number of sequences in the database. Using          w by minimizing the objective function from Equation 1. Stochastic
                                                τ          ()
DM gives kd speedup at the pruning stage, and LB_Keogh
                                                   τDM (δ)
                                                               differ-     gradient descent is used to perform the optimization, converging in
ence in DTW computation stage. Using R-Tree index allows us to             fewer than 10 iterations.
eliminate N 2 multiplier in pruning stage. The height of R-Tree is            We now verify that we do not prune the truly similar candidates
O (log N ), and for a sufficiently small δ, the R-Tree search time         within -proximity of the query candidate. In other words, we inves-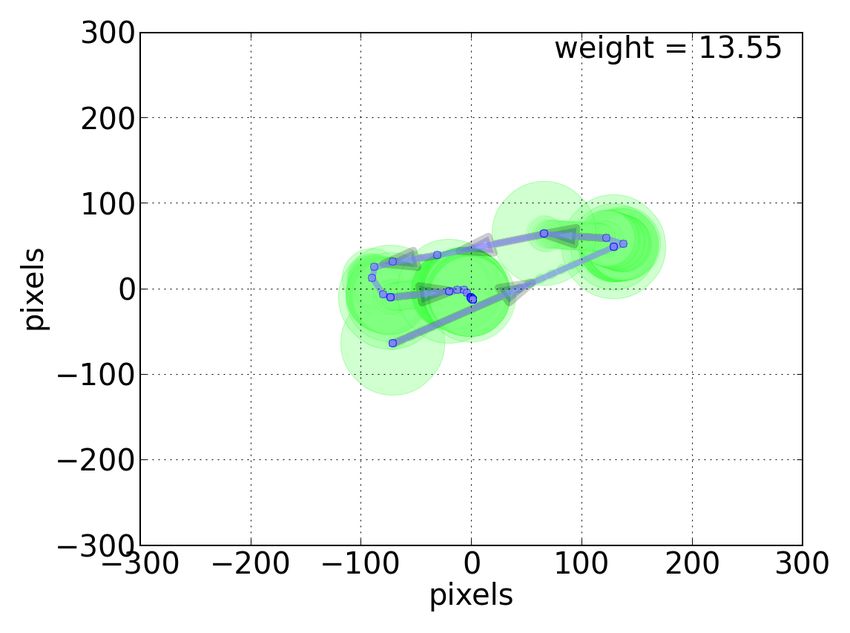
(a) < 300 (b) < 500 (c) < 1000
Figure 3: Recall of finding similar motifs vs. Pruning Power for LB_Keogh and DM methods, shown for representative values of .
tigate the “Recall” of our distance measure, vs. the corresponding
“pruning power”. Here, Recall is defined as the number of candi-
dates found by our algorithm in -vicinity, divided by a total number
of true positives according to exact DTW computation. Pruning
power is defined as fraction of candidates pruned away early by
our algorithm, and therefore eliminated from the (expensive) exact
distance computation. By increasing the parameter δ, defined in
Section 3.5, one can achieve better Recall, but lower Pruning Power,
as more candidates are retained for exact distance computation. In
our experiments we set the δ = 135 resulting in desirable Recall
of 95%. Figure 3 shows the Recall vs. Pruning Power curves for
DM and LB_Keogh methods, with sub-figures corresponding to
different values of . DM outperforms LB_Keogh exhibiting higher
pruning power with 100% Recall, while significantly decreasing the
computation cost. Figure 4: Comparison of running time for LB_Keogh, DM and
DM-RTree systems.
4.3 Runtime Performance Results
In order to compare the performance of our final system DM-
RTree (defined in Section 3.5), we performed benchmark tests for
the three systems, using the dataset described above. Specifically,
we compared: LB_Keogh, which uses pruning based on the lower
bound; DM, our system based on distance measure with linear finding hundreds of motifs, we focus on the top 5 frequent motifs.
search among all candidates; and our DM-RTree system. We do Figure 5 reports the top 5 most frequent motifs (out of 127) discov-
not report the runtimes of the exact DTW computation, as it is 17 ered from the cursor movement data on the search result pages, or
times slower than LB_Keogh, and more than 100 times slower than SERPs. Figure 6 reports top five most frequent motifs (out of 157),
DM-RTree, and takes over several days to run for larger datasets. All extracted from cursor data on the landing (clicked results) pages. In
experiments we performed on Intel Xeon CPU E5-2630 2.30GHz both figures, the mouse traces are annotated with arrows pointing in
with 20 cores. Figure 4 reports the time performance for the systems the direction of cursor movement, and shading of the circles indi-
as the size of the data is increased. Notably, DM-RTree system cates lower speed of cursor movement, or higher density of cursor
exhibits the lowest computation time, while growing at the slowest positions. The common motifs extracted from SERPs correspond
rate as the data size increases. The DM-RTree system outperforms to previously (heuristically) identified patterns of cursor usage by
the state-of-the art LB_Keogh by nearly an order of magnitude (8 Rodden et al. [38], such as marking of promising search results (a
- 9.5 times speedup), for different data sizes, without degrading and d), and using mouse as a reading aid while following along a
Recall below 95%. Note that the speed-up factor increases with the line of text (b), or interacting with the search query box (c), and fol-
data size, as the R-Tree index becomes more efficient in pruning lowing the attention vertically (e). Similarly, the discovered motifs
candidates, compared to linear scanning performed by other systems. on landing pages appear to indicate patterns of marking important
The benchmark test was repeated 10 times. For datasets greater than information on page (a, b and d), and vertical movement (c) – po-
200K, the differences in running times are significant with p < 0.01. tentially indicating the rapid shift of the user’s attention downward,
and directing the mouse cursor to click on a link (e), corresponding
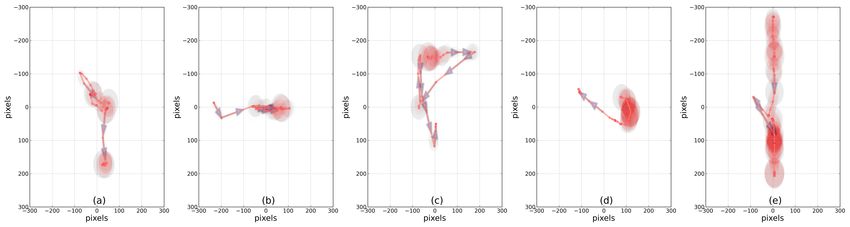
4.4 Discovered Cursor Motifs to heuristically identified patterns of cursor movement on landing
To demonstrate that our approach is not only efficient, but also pages in Guo et al. [20]. We emphasize that both SERP and landing
effective in discovering meaningful motifs, we focus on the mo- page motifs above were discovered automatically, without changing
tifs extracted from the large dataset described above. At the same the algorithm for the different page types. As we demonstrate in the
time, we investigate – whether common cursor motifs vary between next section, the motifs automatically discovered using our approach
search results pages and landing pages with possibly arbitrary lay- provide valuable information about the user’s interactions with the
out. While applying motif extraction to a large dataset may result in result pages, and are effective for relevance estimation and ranking.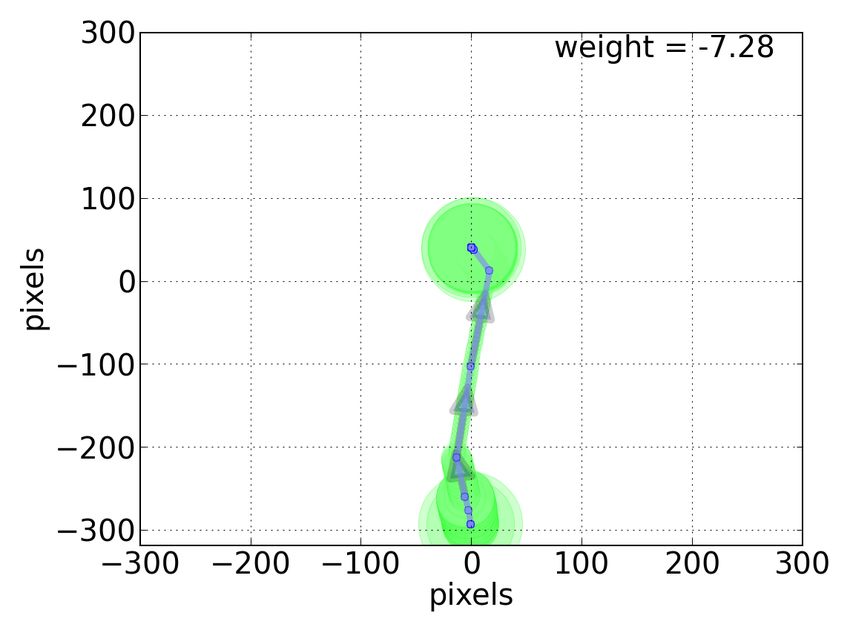
Figure 5: Top frequent motifs discovered from mouse traces recorded on search result pages (SERPs).

                    Figure 6: Top frequent motifs discovered from mouse traces recorded on landing pages (non-SERPs).

5.    USING MOTIFS FOR RELEVANCE PRE-                                    5.2    Motif-based Relevance Prediction System
      DICTION AND RANKING                                                   We now describe our system for predicting relevance of a doc-
   Estimation of document relevance from large scale user behavior       ument using our automatically discovered motifs as features, as
data is of critical importance to Web search engines. In this sections   a standalone system Motifs. We also compare Motifs against a
we demonstrate how automatically discovered mouse cursors motifs         state-of-the-art relevance prediction system, PCB, using manually
can be used to improve estimation of search result relevance and         engineered features [20], and the combination of the two feature sets,
ranking. To ensure proper comparison with prior work of Huang            as PCB+Motifs. The specific features used are described below.
et al. [27] and Guo et al. [20], we adhere to the same evaluation        PCB Features The features or predictors of the PCB model include
metrics: Pearson correlation coefficient and Normalized Discounted       the document viewing time – also known as dwell time, the charac-
Cumulative Gain (NDCG). In the rest of the section, we describe          teristics of mouse cursor movements and scrolling behavior, such
how motif-based features can be incorporated into the existing PCB       as ranges of mouse cursor movements for x and y, cursor move-
model and significantly improve the quality of personalized rele-        ment speed, scrolling direction and frequencies, hovering certain
vance prediction.                                                        area of interest on a web page by mouse cursor and various click
                                                                         statistics. These features aim to capture the searcher engagement
5.1    Experimental Setup and Dataset                                    with the examined document and viewing patterns such as “reading”
                                                                         and “skimming”, which are shown to be indicative of document
   Our test dataset, also referred to as D1 in subsequent experiments,
                                                                         relevance [20]. The complete list of PCB features, and other model
was constructed in a user study with 21 participants, following the
                                                                         details can be found in reference [20].
methodology described by Feild et al. [14]. The dataset contains
                                                                         Motif Features All of the motifs discovered from the user study
566 queries and corresponding 1,340 page views, including search
                                                                         dataset were encoded as features. We only considered mouse cursor
engine result pages (SERPs), with dwell times of at least 5 seconds.
                                                                         data from landing pages, as relevance judgements are not defined
Each user was asked to provide a relevance rating for the web page
                                                                         for search result pages. Each document was then represented with
(on five point scale), immediately prior to navigating to the next web
                                                                         a vector of features, each feature corresponding to one motif. The
page. Mouse cursor position recording was stopped prior to showing
                                                                         feature values were computed as the minimum distances between a
the rating interface, thus the data was not “polluted” by extraneous
                                                                         motif and the observed mouse cursor trajectory, using the following
cursor movements. The subjects were only asked to provide their
                                                                         formula:
ratings on landing pages (non-SERP). This allowed us to analyze
mouse movements performed by a user on the landing page and
                                                                                MinDist(motif, mouse) =
relate them to the explicit relevance rating given by the very same
user. Overall, there were 854 relevance judgments provided by                                min     DTW(motif, mouse[t, t + w])           (2)
                                                                                          0
Feature Group Pearson correlation 2 p-value
Hover [27] 0.12 p < 0.001
PCB [20] 0.392 (n/a) p < 0.001
Motifs 0.394 (+0.5%) p < 0.001
PCB + Motifs 0.468 (+19.4%) p < 0.001
Table 3: Pearson correlation between the actual relevance judgments
and the predicted ratings for PCB, Motifs and PCB+Motifs models
on Dataset D1.
see, the best performing model results from combining the auto-
matically extracted motifs and the PCB predictors (PCB + Motifs),
achieving the correlation of 0.468 between the actual personally
judged relevance and the estimated relevance. Our model improved
the prediction effectiveness over the state-of-the-art PCB model by
over 19%. The system using the automatically extracted motifs
alone (Motifs) correlated with the actual relevance judgments at
Figure 7: Example match of a “follow” motif (shaded green) to 0.394, which is comparable with the PCB model. This demonstrates
cursor trace (blue crosses) on a relevant landing page for a query that our approach indeed enables discovery of valuable patterns that
“best selling books of 2011”. For reference, eye gaze positions are are not easily identifiable through manual effort. To compare with
marked as light red circles. prior work of Huang et al. [27] reported as Hover, we calculated
Pearson correlation between cursor the hover rate and the explicit
labels provided by the participants. We have not found a substantial
(5000 ms in our case) and DT W (·, ·) is the Dynamic Time Warping correlation between hover rate and relevance labels measured for
distance between the motif and sub-sequence. Therefore, the smaller all participants. However, correlation coefficient calculated for each
the minimum distance in the Equation 2, the higher the match be- participant separately, varies from -0.23 to 0.27, which explains
tween the motif and the mouse trajectory (and corresponding feature the small correlation across the users. In our comparison we report
value). In fact, if the motif perfectly matches any subsequence of a average absolute value for all participants, thus giving an advan-
page view, M inDist is equal to zero. This is analogous to a bag-of- tage to Hover. Nevertheless, it provides little correlation, and is
words document representation that is widely used in information outperformed by PCB and Motif models by a substantial margin.
retrieval, except that in our case the “words” represent the common
mouse cursor movements represented as motifs that occur in a page
5.4 Result Ranking
examination time series (analogous to a “document”), and the value We now turn to the other practical application of motif discov-
interpretations are reversed (lower is better). Figure 7 illustrates this ery, result ranking. As in the relevance prediction experiments, we
idea by highlighting the best match between the cursor trace, and a compare four models: Hover [27], Motifs, PCB and the combined
discovered “follow” motif, also seen in Figure 5(d). The figure plots PCB+Motifs. For consistency, we use the same Linear Ridge Re-
the cursor positions (shown as blue crosses) and eye gaze positions gression as for the experiments above. We perform cross validation
(shown as light red circles), and overlays the best match of the motif stratified by user: that is, for each run we hold out documents seen
(shaded in green). The user searched for book bestsellers of 2011, by a single user, and train the model on the rest of the data. The
and has subsequently judged this page as relevant, as it contains the same motifs are used as before, as they were discovered on a disjoint,
list of top-20 book best sellers at the bottom of the page (full page unlabeled dataset described in section 5.3. We repeat the training
snapshot cropped due to lack of space). and testing procedure for each of 21 users in our dataset and report
the ranking performance averaged across all the users, resulting in
5.3 Relevance Prediction a leave-one-out form of cross validation. Specifically, as a metric
We now report the performance of the different systems on pre- we use Normalized Discounted Cumulative Gain (NDCG), widely
dicting document relevance. As evaluation metric, we use the Pear- accepted for assessing the quality of Web search results ranking.
son correlation coefficient ρ, between the predicted and the true Normalized Discounted Cumulative Gain at K (NDCG@k) is
relevance labels, defined as: parametrized by cutoff position k, that is, to calculate NDCG@k we
P consider only top k results. NDCG@k is defined as:
(x,y)∈D (f (x) − µf )(y − µy ) k
ρf,y = DCG@k X 2reli − 1
(|D| − 1)σf σy N DCG@k = , DCG@k =
IDCG@k i=1
log2 (i + 1)
where µ is the observed sample mean and σ is the observed sample
standard deviation. Pearson correlation is the evaluation metric of where IDCG@k is the DCG@k value of the ideal document rank-
choice in previous work [20, 27], thus appropriate for comparison to ing according to the relevance labels, and reli is relevance score
previously proposed methods, namely PCB and cursor hover [27]. for a i-th document. DCG@k penalizes ranking with relevant
Predicting Relevance: We formulate the prediction problem as documents appearing at lower position in the list with logarithmic
regression, and conduct 10-fold cross validation. The regression discount. The N DCG@k value of 1.0 indicates a perfect rank-
algorithm we used is Ridge Linear Regression, which is a variant of ing. At test stage we compute relevance scores for the held out
Multiple Linear Regression. Ridge linear regression is reported to documents and calculate N DCG@k based on the actual relevance
be more robust against predictor collinearity and overfitting. labels.
Results: Table 3 summarizes the performance of four regression Results: Figure 8 reports N DCG@k for the values of k ranging
models with distinguished with different feature subsets. As we can from 1 to 50. Interestingly, despite similar performance measuredFor exploratory applications, researchers and practitioners may,
for example, choose to only look at search queries accompanied with
extensive “skimming” behavior, as search results for these queries
are more likely to be poor and require more attention. Similarly,
search result documents with substantial “reading” behavior may
be more relevant than those without. For example, we have shown
that by using motif presence (as feature values) as predictors, search
result ranking can be substantially and significantly improved. Gen-
erally speaking, with our approach, one may construct a dictionary
of mouse cursor motifs, and use them to predict various user metrics,
e.g., affect, satisfaction, frustration, or user interest and engage-
ment with web pages, not necessarily only search results. And,
since our motif discovery approach is completely automatic and
Figure 8: NDCG@K of result rankings based on Hover, PCB, and application-independent, no application-specific feature engineering
motif models (Motifs and PCB+Motifs), on dataset D1. is required.
This work opens a number of future research directions. While
our proposed technique are page- and user-independent, the behav-
by Pearson correlation, ranking based on motif features behaves ioral patterns may vary for different users, page layouts or tasks.
differently from the ranking based on the PCB model. Specifically, For example, while the extracted motifs are prevalent across users,
the motif model has significantly higher NDCG values at positions some of the patterns may be more dominant for particular users.
1 through 10 (with the improvement on NDCG@1 over the original Therefore, modeling individual characteristics may be helpful for
PCB model of 27%, p-value < 0.001). However, this improvement segmenting and targeting different user groups (e.g., more active
decreases with higher values of k. The combined PCB+Motifs users vs. more passive users [8]), which would further improve the
model outperforms both PCB and Motifs at lower rank positions relevance prediction models. Our approach can also be naturally
with relative improvements from 13% at rank 10 decreasing to 6% at extended to touch screen devices that do not use mouse cursor, but
rank 30. By comparison, Hover model alone performs consistently provide other interaction features such as swiping and zooming
poorly, especially at lower ranks. (requiring novel features and models, such the recent work by Guo
et al. [21]), and is a promising direction for future work.
5.5 Most predictive motifs In summary, we introduced a novel technique for automatically
To gain a better understanding of the motif features, we conducted and efficiently extracting frequent mouse-cursor movement patterns
feature importance analysis using the weights assigned to the fea- (motifs) from web search examination data. To enable motif min-
tures by the linear ridge regression algorithm. The distribution of ing on realistic datasets, we introduced novel optimizations, using
feature weights is reported in Figure 9. Note that the majority of the spatial indexing and learning distance measures, which resulted in
feature weights are concentrated near zero, suggesting that the motif an order of magnitude improvement in runtime performance. As a
feature set could potentially be further pruned by applying standard result, meaningful motifs such as reading, marking, and skimming a
feature selection algorithms. Ridge regression also naturally sup- page were discovered from the search behavior data of real users,
ports the interpretation of motif correlation directions through the The discovered motifs were shown to be valuable for estimating
signs of the feature weights. That is, the motif features with positive document relevance for improving Web search result ranking, en-
weights are positively correlated with the relevance label, while mo- abling over 19% improvement in relevance estimation and over 27%
tif features with negative weights are anti-correlated with relevance improvement in result ranking over the state-of-the-art baselines.
labels. Figures 10 and 11 show two examples of motifs with high Thus, our novel techniques provide a general, robust, and scalable
absolute weights. In Figure 10, the example motif has a high posi- method for analyzing search behavior data, while enabling signifi-
tive weight, suggesting a high level of user interest and engagement cant improvements on practical search tasks.
with the page content, in turn, indicating high document relevance.
In Figure 11, the example motif has relatively large negative weight, ACKNOWLEDGMENTS This work was supported by the Na-
corresponding to the pattern of link pointing or other types of page tional Science Foundation grant IIS-1018321, the DARPA grant
D11AP00269, and the Yahoo! Faculty Research Engagement Pro-
navigation (e.g., clicking the “Back” button to leave the current gram.
page), indicating the viewed page to be non-relevant. Note that
these, and other most predictive motifs such as “follow”, are not
captured by the PCB model, and in fact would be difficult to capture
by manually engineered features. Thus, motif discovery provides a 7. REFERENCES
powerful way of building a dictionary of complex behavior features, [1] M. Ageev, D. Lagun, and E. Agichtein. Improving search result
with minimal application-specific effort. summaries by using searcher behavior data. In Proc. of SIGIR, 2013.
[2] E. Arroyo, T. Selker, and W. Wei. Usability tool for analysis of web
designs using mouse tracks. In CHI extended abstracts, 2006.
6. DISCUSSION AND CONCLUSIONS [3] H. Becker, M. Naaman, and L. Gravano. Learning similarity metrics
Our relevance prediction and ranking experiments demonstrated for event identification in social media. In Proc. of WSDM, 2010.
that the automatically extracted motifs are helpful for improving [4] N. Beckmann, H.-P. Kriegel, R. Schneider, and B. Seeger. The r*-tree:
Web search result ranking, and provide additional clues about docu- an efficient and robust access method for points and rectangles. In
Proc. of SIGMOD, 1990.
ment relevance, over previously discovered patterns developed by
[5] M. Bilenko, S. Basu, and R. J. Mooney. Integrating constraints and
manual examinations. We believe that these findings can facilitate metric learning in semi-supervised clustering. In Proc. of ICML, 2004.
the research and development of the mouse cursor movement data, [6] G. Buscher, E. Cutrell, and M. R. Morris. What do you see when
especially at large scale. you’re surfing?: using eye tracking to predict salient regions of web
pages. In Proc. of CHI, 2009.Figure 9: Distribution of motif feature
Figure 10: Most predictive positive motif. Figure 11: Most predictive negative motif.
weights.
[7] G. Buscher, A. Dengel, and L. van Elst. Query expansion using [30] E. Keogh, X. Xi, L. Wei, and C. A. Ratanamahatana. The ucr time
gaze-based feedback on the subdocument level. In Proc. of SIGIR, series classification/clustering homepage, 2006.
2008. [31] S.-W. Kim, S. Park, and W. W. Chu. An index-based approach for
[8] G. Buscher, R. W. White, S. Dumais, and J. Huang. Large-scale similarity search supporting time warping in large sequence databases.
analysis of individual and task differences in search result page In Proc. of ICDE, 2001.
examination strategies. In Proc. of WSDM, 2012. [32] L. Leiva. Automatic web design refinements based on collective user
[9] E. Chávez, G. Navarro, R. Baeza-Yates, and J. L. Marroquín. behavior. In CHI Extended Abstracts, 2012.
Searching in metric spaces. ACM Comput. Surv., Sept. 2001. [33] D. Lemire. Faster retrieval with a two-pass dynamic-time-warping
[10] S. Chopra, R. Hadsell, and Y. LeCun. Learning a similarity metric lower bound. Pattern recognition, 42(9):2169–2180, 2009.
discriminatively, with application to face verification. In Proc. of [34] L. Lonardi, Jessica, K. Eamonn, Stefano, and P. Patel. Finding motifs
CVPR, 2005. in time series. In Proc. of the 2nd Workshop on Temporal Data Mining,
[11] E. Cutrell and Z. Guan. What are you looking for?: an eye-tracking 2002.
study of information usage in web search. In Proc. of CHI, 2007. [35] A. Mueen, E. Keogh, Q. Zhu, S. Cash, and B. Westover. Exact
[12] P. Esling and C. Agon. Time-series data mining. ACM Comput. Surv., discovery of time series motifs. In Proc. of SIAM International Conf.
2012. on Data Mining, 2009.
[13] C. Faloutsos, M. Ranganathan, and Y. Manolopoulos. Fast [36] V. Navalpakkam and E. Churchill. Mouse tracking: measuring and
subsequence matching in time-series databases. 1994. predicting users’ experience of web-based content. In Proc. of CHI,
[14] H. A. Feild, J. Allan, and R. Jones. Predicting searcher frustration. In 2012.
Proc. of SIGIR, 2010. [37] T. Rakthanmanon, B. Campana, A. Mueen, G. Batista, B. Westover,
[15] J. Goecks and J. Shavlik. Learning users’ interests by unobtrusively Q. Zhu, J. Zakaria, and E. Keogh. Searching and mining trillions of
observing their normal behavior. In Proc. of IUI, 2000. time series subsequences under dynamic time warping. In Proc. of
[16] L. A. Granka, T. Joachims, and G. Gay. Eye-tracking analysis of user KDD, 2012.
behavior in WWW search. In Proc. of SIGIR, 2004. [38] K. Rodden, X. Fu, A. Aula, and I. Spiro. Eye-mouse coordination
[17] Q. Guo and E. Agichtein. Exploring mouse movements for inferring patterns on web search results pages. In Proc. of CHI, 2008.
query intent. In Proc. of SIGIR, 2008. [39] H. Sakoe and S. Chiba. Dynamic programming algorithm optimization
[18] Q. Guo and E. Agichtein. Ready to buy or just browsing?: detecting for spoken word recognition. Acoustics, Speech and Signal Processing,
web searcher goals from interaction data. In Proc. of SIGIR, 2010. IEEE Transactions on, 26(1), 1978.
[19] Q. Guo and E. Agichtein. Towards predicting web searcher gaze [40] Y. Sakurai, M. Yoshikawa, S. Uemura, H. Kojima, et al. The a-tree:
position from mouse movements. In Proc. of CHI, 2010. An index structure for high-dimensional spaces using relative
[20] Q. Guo and E. Agichtein. Beyond dwell time: estimating document approximation. In Proc. of the VLDB, 2000.
relevance from cursor movements and other post-click searcher [41] B. Shapira, M. Taieb-Maimon, and A. Moskowitz. Study of the
behavior. In Proc. of WWW, 2012. usefulness of known and new implicit indicators and their optimal
[21] Q. Guo, H. Jin, D. Lagun, S. Yuan, and E. Agichtein. Mining touch combination for accurate inference of users interests. In Proc. of ACM
interaction data on mobile devices to predict web search result SAC, 2006.
relevance. In Proc. of SIGIR, 2013. [42] J. Shieh and E. Keogh. i sax: indexing and mining terabyte sized time
[22] Q. Guo, R. P. Kelly, S. Deemer, A. Murphy, J. A. Smith, and series. In Proc. of KDD, 2008.
E. Agichtein. EMU: the emory user behavior data management system [43] R. W. White and G. Buscher. Text selections as implicit relevance
for automatic library search evaluation. In Proc. of JCDL’09, 2009. feedback. In Proc. of SIGIR, 2012.
[23] Q. Guo, D. Lagun, and E. Agichtein. Predicting web search success [44] L. Ye and E. Keogh. Time series shapelets: a new primitive for data
with fine-grained interaction data. In Proc. of CIKM, 2012. mining. In Proc. KDD, 2009.
[24] A. Guttman. R-trees: a dynamic index structure for spatial searching. [45] B.-K. Yi, H. Jagadish, and C. Faloutsos. Efficient retrieval of similar
SIGMOD Rec., 14(2), June 1984. time sequences under time warping. In Proc. of ICDE, 1998.
[25] J. Huang, R. White, and G. Buscher. User see, user point: gaze and [46] J. Zakaria, A. Mueen, and E. Keogh. Clustering time series using
cursor alignment in web search. In Proc. of CHI, 2012. unsupervised-shapelets. In Proc. of ICDM, 2012.
[26] J. Huang, R. W. White, G. Buscher, and K. Wang. Improving searcher [47] P. Zezula, G. Amato, V. Dohnal, and M. Batko. Similarity Search: The
models using mouse cursor activity. In Proc. of SIGIR, 2012. Metric Space Approach. Springer, 2010.
[27] J. Huang, R. W. White, and S. Dumais. No clicks, no problem: using
cursor movements to understand and improve search. In Proc. of CHI,
2011.
[28] I. Jolliffe. Principal component analysis. Wiley Online Library, 2005.
[29] E. Keogh and C. Ratanamahatana. Exact indexing of dynamic time
warping. Knowledge and information systems, 7(3):358–386, 2005.You can also read