DEVELOPMENT
  TASKFORCE
MONTHLY MEETING
 MARCH 17, 2023
←
→
Page content transcription
If your browser does not render page correctly, please read the page content below
DEVELOPMENT TASKFORCE MONTHLY MEETING MARCH 17, 2023

Nick Winkelman –
Planning & Engineering Manager
Blanca Villanueva –
Interim Compliance Superintendent
o Backflow Prevention Program
o Use of Treated Water
Departments w/ Standing Invites
Parks & Recreation
Engineering Services
Solid Waste
Public Works
Planning
See Purple – Save Blue
Effluent Water Reuse Project

Nicholas Winkelmann, P.E.
March 17, 2023
                               3
4
    4
5
    5
Backflow Prevention
Compliance Project

Blanca Villanueva
March 17, 2023
                      6
Overview
• Project Background

• Objectives

• Related Codes

                       7
                           7
Project Background
• On December 14, 2016, a citywide water ban was issued after city officials
  said they found reason to believe an asphalt emulsifier, originating from a
  leak in the industrial district, had the potential to breach the public water
  supply. As a result of the water ban, TCEQ and the City of Corpus Christi
  filed a claim against both parties and entered an agreed final judgement in
  which the City was awarded $1.3m.
• The judgement requires the City of Corpus Christi to achieve the objectives
  set forth in the agreement which is titled City of Corpus Christi Backflow
  Prevention Compliance Project. The City must utilize the funding within 365
  days of the execution date. The order was officially signed and executed on
  December 7, 2022.
• The project consists of the City of Corpus Christi to provide employees and
  registered backflow testers with Backflow Prevention and Assembly Testing
  (BPAT) training and test gauges. In addition, the City will use the funds to
  provide backflow assemblies to commercial & industrial customers,
  develop a CSI database, and provide customer service inspections
  throughout the City.

                                                                              8
                                                                                  8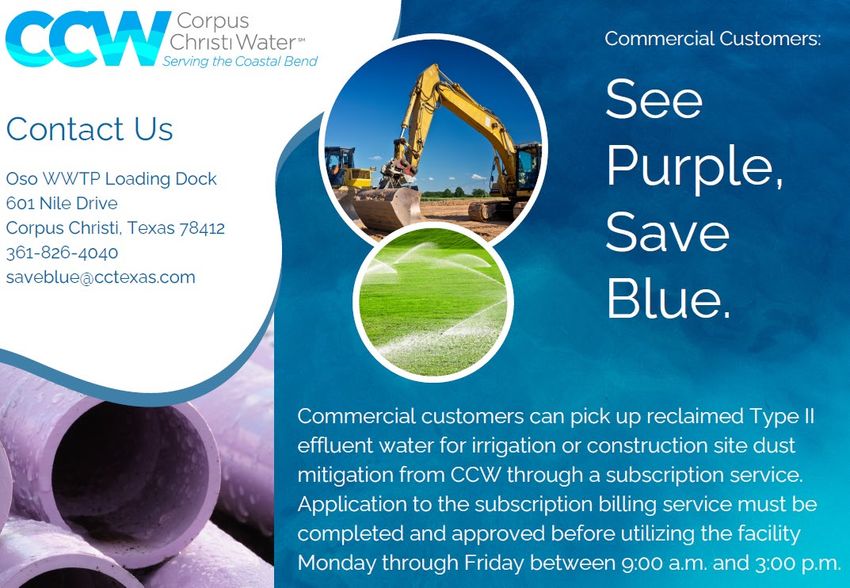
Objectives
• Backflow Prevention Assembly Tester (BPAT) Training
  • This course will be offered to city staff and other companies that provide
    backflow testing within the city. This course will provide training on
    regulations, assembly testing, and safety.
• Customer Service Inspections (CSI)
  • A customer service inspection (CSI) identifies threats to our water
    system and is not to be confused with backflow assembly testing. The
    City has contracted with TX Utilities & Environmental LLC to provide CSIs
    for commercial customers to ensure all connections into the water
    system are safe from risk of backflow and contamination. The CSIs will
    help the City determine which customers pose a risk to the City’s water
    distribution system. There are over 6,000 estimated customers without a
    customer service inspection on file.

                                                                             9
                                                                                 9
Objectives Continued
• Customer Service Inspection Software Program
  • Vepo developed a program by using information provided by UBO
    and comparing it to our current third party backflow database to
    identify commercial and industrial customers that may not have
    the required backflow protection.
• Backflow Equipment
  • The City will provide free backflow assemblies to customers who
    fail CSIs due to not have adequate backflow protection. This
    includes reduced pressure assemblies, double check valves as
    well as non-testable devices.

                                                                      10
                                                                           10
Objectives Continued
• Test Gauges
• The City will issue registered backflow testers new test gauges
which are used to test backflow assemblies. Testers must be
registered with Development Services.
• Storage
• The City has rented a U-Haul storage unit to house all backflow
assemblies and test gauges.
11
11Related City Codes
• SEC 14-281. - PLUMBING CODE
• SEC 14-231 – BUILDING CODE
• SEC 55-96 – INDUSTRIAL BACKFLOW
• SEC 55-37 – PROCEDURES FOR INSTALLATION, TESTING,
REPAIR, AND REPLACEMENT OF BACKFLOW PREVENTION
DEVICES AND ASSOCIATED BILLING
12
12DSD Certifications Roger Rojas -Residential Plumbing Inspector Blasa Rodriguez -Building Plan Examiner S t e v e n K a rg -Mechanical Plans Inspector -Plumbing Plans Examiner Pa t r i c i a Lo p e z - G a rc i a - Pro p e r t y Maintenance Housing Inspector
DSD’s New Team Members

Nicole Radney                                    Michael San Miguel
Administrative Support III                       Contracts & Funds Administrator
Land Development

 Nominations Annual
Preservation Awards –          Update UDC Article 8
  Deadline April 3rd                (Camiros)

              Trust Fund Update & City
             Participation Fund Update
Historic Preservation
UDC Update (Ch. 8)
March
•   Draft being developed for staff review/comment
•   Additional staff review as warranted

March/April
•   DSTAC review

April/May
•   Public Draft Prepared
•   Public Comment
     • DS Task Force
     • Stakeholder comment opportunities
•   Planning Commission Briefing
Trust Fund Balance
Water Arterial Water Sanitary Sewer Sanitary Sewer
Transmission & Distribution Trunk System Collection Line
($227,221.94) Grid Main Trust Main Trust Trust Trust
($328,803.47) $31,399.66 $40,745.39 $29,436.38
Approved:
• Caroline’s Heights Unit 1 – Water Arterial/Grid Main - $471,448.10 Approved 12/20/22 City Council
Pending:
• Pozo-Flores-Cruz (OCL) - Water Arterial/Grid Main – $1,267,032.80 Pending Annexation/Zoning
• Charlotte Estates (OCL) – Water Arterial/Grid Main - $1,467,000.00 EST. Pending Annexation
18City Participation
Available Balance Participation Funds as of 02/08/23
• Bond 18 - $1,324,078.11
• Note: There were no City Participation Funds allocated in the 2020
Bond initiative
• Note: There are no City Participation Funds proposed for the 2022 Bond
Initiative
City Participation Activity FY 2022-2023:
Approved:
• Kings Landing Unit 2 – Street Participation - $192,253.75 – Approved 12.20.2022
19Building Department
Launch of the
INFOR Ongoing ICC STAR Program
Update Training
April 3, 2023Directors
Report
This Photo by Unknown Author is licensed under CC BY-SAMaster Planning & Impact Fee Schedule
Update will be sent out soon…
All CIAC Meetings - 11:30 am to 3:30 pmPerformance Metrics
February 2023 Performance Metrics
• 898 Lobby Customers
• 1,485 Permits Issued
• 96% Next Day Inspections (Goal = 85%)
• 2.18 Residential Average Review Time (Goal = 3 Days)
• 8.81 Commercial Average Review Time (Goal = 10 Days)
• 2 Zoning Applications Submitted
• 5 Applications taken to Planning Commission
• 1 Applications taken to City Council
• 78 Average days to City Council (Goal = Less than 90 days)
• 9 Platting Applications Submitted
• 9 Plats taken to Technical Review Committee (TRC)
• 11 Plats taken to Planning Commission
• 51 Average days to Planning Commission (Goal = Less than 45 days)
• 1 Public Improvement Plans (PIP) Submitted
• 1 Public Improvement Plans Reviewed
• 6 Average Review Time (Goal = 15 Days)Financials
Vacancy Report
                            Quarter 1       January      February Vacancy
      Division
                           Vacancy Rate   Vacancy Rate         Rate

 Land Development            26.67%         26.67%           26.67%
   Administration            12.50%         36.36%           36.36%
Inspection Operations         6.67%         25.45%           25.45%
                 Totals:     11.76%         28.40%           25.93%
City of Corpus Christi Development Services Department March 2023
Building Division                       1,800                                                                                                                                            4,500

                                              1,600                                                                                                                                            4,000

                                              1,400                                                                                                                                            3,500

      Residential                             1,200

                                              1,000
                                                                                                                                                                                               3,000

                                                                                                                                                                                               2,500

      Permitting
                                               800                                                                                                                                             2,000

                                               600                                                                                                                                             1,500

                                               400                                                                                                                                             1,000

      Demand                                   200

                                                 -
                                                              2018                   2019                   2020                  2021               2022                2023 (Est)
                                                                                                                                                                                               500

                                                                                                                                                                                               -

                                                           Sitework     Survey           Mobile Home Tie Down         Additions   Remodel     Accessory      New        Total Permits Issued

   In 2018 Development Services                                   In 2023 Development Services is                                                                 Demand is estimated to decline 26%
  Issued 2,231 Residential Permits                              Estimating to Issue 3,599 Residential                                                             on new residential but increase 61%
                                                                               Permits                                                                                    overall since 2018
Fiscal Year           Sitework       Survey   Mobile Home Tie Down               Additions                Remodel                 Accessory               New               Total Residential Permits
   2018                    0           1               95                           74                      684                      425                   952                        2,231
   2019                    3           0               49                           82                      509                      546                   981                        2,170
   2020                   16           0               53                           88                      556                      870                  1,087                       2,670
  2021                   38            0              39                            78                          487                 1,334                 1,515                        3,491
  2022                    52           0               0                           196                       757                   1,694                  1,312                        4,011
2023 (Est)               199           0               0                           206                      1,029                  1,457                   708                         3,599
Building Division 400 1,200
350
1,000
300
Commercial
800
250
200 600
Permitting 150
100
400
200
Demand
50
- -
2018 2019 2020 2021 2022 2023 (Est)
Shell Addition Sitework Accessory Tenant Finish Out New Sign Remodel Total Commercial Permits
In 2018 Development Services In 2023 Development Services is Demand is up 41% since 2018
issued 851 commercial permits estimating to issue 1,200 commercial
permits
Fiscal Year Shell Addition Sitework Accessory Tenant Finish Out New Sign Remodel Total Commercial Permits
2018 12 25 25 55 90 135 216 293 851
2019 3 15 26 84 75 125 276 388 992
2020 8 13 16 133 61 185 210 276 902
2021 4 9 26 146 62 88 236 267 838
2022 5 103 40 125 75 102 272 226 948
2023 (est) 12 178 38 166 86 192 310 218 1,200Staffing Over the Years
• 2018 Staff Size – 64
• 2023 Staff Size – 86
• Added 16 staff in 2023 to address increased demand
and provide optimal service
Fiscal Year Staff Size Year Over Year Percent Change
2018 64 3% Inc
2019 65 1.5% Inc
2020 67 3% Inc
2021 64 4.5% Dec
2022 71 10% Inc
2023 86 21% Inc
2019 2020 2021 2022 2023Development Services Revenue
• Between 2018 and 2023 revenue
increased by 21.6%
Percent Change
• In 2022 Development Services Fiscal Year Actual/Estimated
Year Over Year
adjusted majority of fees
• Setting revenues to keep pace with cost
and demand of service 2018 7,874,256 14%
• In 2023 estimated revenue projection 2019 6,533,351 -17%
is $9.6 million 2020 7,040,842 1.3%
2021 7,135,208 1%
• Second year of fee adjustments
2022 9,151,061 28%
• In 2024 DSD will propose to move to 2023 9,581,949 5%
year 3 of the rate plan; allowing the
department to continue optimal
service to stakeholdersDevelopment Services Expenditures
• In 2021 Development Services signed
the master plan study
• Total cost to Development Services: Fiscal Year Actual/Estimated
Percent Change
$2,953,600 (Includes two change orders) Year Over Year
• Contract slated to complete in FY 24
(Early)
2018 6,025,456 1%
• In 2023 estimated expenditure 2019 6,503,485 8%
projection is $15.97 million 2020 6,790,916 4.5%
• $614K for building design 2021 6,610,907 -2.7%
• $2.56 million is master plan contract 2022 8,425,585 27.4%
• $5.94 million is sent to CIP for Building Remodel 2023 15,967,135 89.5%
Project
• 2023 expenditures include using funds in fund
balance; not current year revenues.Financial Recap
Actual/Estimated Actual/Estimated
Fiscal Year Excess/(Deficit)
Revenue Expenditures
2017 6,921,318 5,991,183 930,135
2018 7,874,256 6,025,456 1,848,800
2019 6,533,351 6,503,485 29,866
2020 7,040,842 6,790,916 249,926
2021 7,135,208 6,610,907 524,301
2022 9,926,796 8,425,585 1,501,211
2023 (Est) 9,581,948 15,967,135 (6,385,187)Normalized Cost of Business
2023 Budget Details
Personnel: $ 6,521,749
Operating: $ 7,748,646
Allocations: $ 1,696,740
Adopted Budget: $ 15,967,135
Less One Time Purchases:
Building Remodel $ 5,854,807
Engineering Cost $ 99,522
Vehicle Purchases $ 255,000
Professional Services Contracts $ 200,000
Total of One Time Purchases: $ 6,409,329
Proposed Budget Less One Time Purchases
Personnel: $ 6,521,749
Operating: $ 1,339,317
Allocations: $ 1,696,740
Normalized Cost of Doing Business: $ 9,557,806Questions, Comments, Suggestions…
*Next Development Task Force Meeting*
April 21, 2023You can also read


