Development of a Novel Fuzzy Logic-Based Wetland Risk Assessment Approach for the Management of Freshwater Wetland Ecosystems
←
→
Page content transcription
If your browser does not render page correctly, please read the page content below

Development of a Novel Fuzzy Logic-Based Wetland Risk Assessment Approach for the Management of Freshwater Wetland Ecosystems Sajad Soleymani Hasani University of Tabriz Faculty of Civil Engineering Alireza Mojtahedi ( a.mojtahed@tabrizu.ac.ir ) University of Tabriz Faculty of Civil Engineering Mir Amir Mohammad Reshadi KN Toosi: KN Toosi University of Technology Research Article Keywords: Wetland ecosystem, Wetland management, Risk assessment, Water quality, Fuzzy inference system, Analytic hierarchy process Posted Date: May 10th, 2021 DOI: https://doi.org/10.21203/rs.3.rs-326933/v1 License: This work is licensed under a Creative Commons Attribution 4.0 International License. Read Full License

1 Development of a novel fuzzy logic-based wetland risk assessment
 2 approach for the management of freshwater wetland ecosystems
 3
 4
 5 Sajad Soleymani Hasani
 6 Msc. Student, Faculty of Civil Engineering, University of Tabriz, Tabriz, Iran
 7 s.soleymanihasani@gmail.com
 8
 9 Alireza Mojtahedi * (corresponding author)
10 Associate professor, Faculty of Civil Engineering, University of Tabriz, Tabriz, Iran
11 a.mojtahed@tabrizu.ac.ir
12
13 Mir Amir Mohammad Reshadi
14 Msc. Student, Faculty of Civil Engineering, K. N. Toosi University of Technology, Tehran, Iran
15 a.m.reshadi@email.kntu.ac.ir
16
17
18 Abstract
19 In the present study, a new wetland risk assessment approach based on the fuzzy inference system (FIS) was
20 developed and proposed for the first time to improve the traditional ESCOM's wetland classification and risk
21 assessment index (WCRAI). As two of the twenty-five Iranian wetlands of international importance, the Kani
22 Barazan and Choghakhor wetlands were selected as the study areas due to their significant roles in protecting
23 the biodiversity of their regions. The wetlands are supported by the international Ramsar Convention on
24 Wetlands to mandate and encourage the local authorities for their conservation and sustainable exploitation.
25 In this regard, the Iranian Department of Environment, in cooperation with UNDP/GEF, selected these
26 wetlands to demonstrate new approaches to managing the wetland areas protected by the Conservation of
27 Iranian Wetlands Project (CIWP). A real-time wetland monitoring station with hydrological instruments,
28 including water level, air temperature, air humidity, and water quality multi-parameter sensors recording water
29 temperature, pH, specific conductance, and dissolved oxygen, was implanted at the deepest part of both
30 wetlands. The manual sampling of water quality parameters was also carried out periodically during specific
31 time intervals. The relative importance of the wetland health indicators involved in the FIS was determined
32 using the analytic hierarchy process (AHP). In turn, the health level categories of both wetlands were assessed
33 using the traditional and proposed wetland risk assessment approaches. The efficiency of the proposed method
34 was evaluated with the considered scenarios, and it was shown to be a more flexible and appropriate approach
35 for wetland health assessment. Furthermore, the observed differences between the health level categories of
36 the first case study indicated the importance of using the AHP-FIS method to improve the traditional ESCOM's
37 WCRAI.
38 Keywords
39 Wetland ecosystem; Wetland management; Risk assessment; Water quality; Fuzzy inference system; Analytic
40 hierarchy process
41 Highlights
42 1. A wetland risk assessment approach based on fuzzy logic was developed.
43 2. Process was improved using integrated fuzzy inference system and analytic hierarchy process.
44 3. Two real-time wetland monitoring stations were used to gather the required data.
45 4. Two freshwater wetlands were selected as real case study areas.
46 5. The proposed approach showed more flexibility and efficiency.

 1

47 1. Introduction
48 Wetlands are among the most valuable and productive ecosystems on the earth. They provide various
49 supporting, provisioning, regulating, and cultural services, all of which make a significant contribution to the
50 well-being of human populations (Thapa et al., 2020; Xu et al., 2020). These delicate ecosystems have been
51 long exposed to unsustainable resource extraction and various anthropogenic activities such as the spread of
52 urbanization, industrialization, and land-use change (Mao et al., 2019; Salimi et al., 2021). Iran has 25 sites
53 designated as wetlands of international importance (Ramsar sites) out of 2,290 worldwide. From 25 sites,
54 about one-third are under pressure or in a critical condition. Although Wetland management in Iran has
55 received more and more attention in recent years, in many instances, these efforts are being held back by the
56 lack of comprehensive assessment tools, insufficient coordination among stakeholders, weak policy and
57 legislative frameworks. The risk assessment of these endangered ecosystems is highly required so that the
58 appropriate management actions to prevent or limit the risk(s) can be carried out in time. As the only
59 intergovernmental treaty, the Ramsar Convention on Wetlands promotes the conservation and wise use of
60 wetlands. The convention has developed a framework for predicting and assessing the changes in ecological
61 characteristics of wetlands and highlighted the role of early warning systems in wetland conservation (Gardner
62 and Finlayson, 2018). Moreover, The U.S. Environmental Protection Agency (USEPA) has proposed a three-
63 level hierarchical approach, known as the three-tier framework, for wetland assessment and monitoring. This
64 framework ranges from extensive, landscape-scale assessments (level 1), rapid field assessments (level 2) to
65 intensive biological and hydrogeomorphic approaches, termed level 3 (Stryszowska-Hill et al., 2019).
66 In recent years, wetland risk assessment has gained increased attention among scholars, becoming an integral
67 part of sustainable wetland management worldwide. In this regard, various studies, using different indicators
68 and methodologies, have been conducted to evaluate wetland health status and determine the factors
69 threatening these delicate ecosystems. In previous studies, a remote sensing and GIS-based approach, using a
70 set of social and infrastructural indicators, was developed to evaluate the risk level of the East Kolkata Wetland
71 Area in India (Sarkar et al., 2016). In addition, a combination of external threats (natural and artificial hazards)
72 and internal wetland attributes (area, structure, and function) was used to assess the marsh wetlands
73 degradation risk (Jianga et al., 2017). Studies were also conducted considering the significance of social and
74 landscape factors to establish an indicator system for diagnosing wetland health using remote sensing,
75 statistical data, and field sampling (Wu et al., 2018). Additionally, the conservation status of high Andean
76 wetlands was investigated by developing an index that integrates soil, water, biodiversity, and landscape
77 fragmentation indicators (Yepes and Pérez, 2019). Furthermore, the conversion risk assessment of East
78 Kolkata Wetland was carried out using machine learning models, namely, random forest and support vector
79 machine based on population growth and density and a set of proximity factors (Ghosh and Das, 2020).
80 Among various risk assessment approaches, rapid appraisal methods are of particular importance in wetland
81 regulatory and management purposes, as they are easy to implement, less time consuming, and relatively
82 inexpensive. Furthermore, the rapid development of sensor and wireless communication technologies has led

 2
83 to the widespread use of automatic sensors in environmental monitoring to address the need for temporally
 84 and spatially accurate data for handling complex environmental problems. In this regard, the UNDP Global
 85 Environmental Finance (UNDP-GEF) in cooperation with the Conservation of Iranian Wetlands Project
 86 (CIWP) selected the Kani Barazan (in local language means "the spring of the hogs") and Choghakhor (in
 87 local language means "the sun hill") wetlands as hotspot sites to demonstrate new approaches to the
 88 management of Iran's wetland protected areas. A real-time wetland monitoring station equipped with
 89 hydrological instruments was installed within the wetland regions by order of CIWP. The station uses a Blue
 90 Box modular for transferring the measured data via a website to the database. Such systems provide a large
 91 amount of data, which poses challenges for ensuring data quality; thereby, highlighting the role of appropriate
 92 data-mining tools. However, rapid appraisal methods use a finite set of field measurements and indicators to
 93 assess the ecological conditions of wetlands. These approaches have proven to be fruitful in providing reliable
 94 and quantitative information on the overall health status of wetlands (Fennessy et al., 2004; Stein et al., 2009),
 95 one of which is the ESCOM's wetland classification and risk assessment index (WCRAI) developed by
 96 Oberholster et al. (2014). This traditional index, which involves various water quality variables and physical
 97 characteristics of wetlands, was successfully applied to several wetlands in South Africa. However, most rapid
 98 risk assessment indices lack the capability to deal with uncertainties and subjectivity associated with these
 99 complex environmental problems. In this sense, fuzzy logic has emerged as a robust way of dealing with
100 vague, incomplete, and inconsistent information (Abdel-Basset and Mohamed, 2018; de Oliveira et al., 2019;
101 Seyedmohammadi et al., 2018). Fuzzy logic developed on fuzzy set theory allocates a degree of membership,
102 generally a value between zero and one, to elements of a universe of discourse (Oladipo et al., 2021). Where
103 zero represents "no membership" or "totally false," and one represents "full membership" or "totally true." It
104 has been shown that the linguistic computations conducted in a fuzzy inference system (FIS) are superior to
105 common algebraic expressions and provide more realistic results when dealing with environmental problems
106 (Lermontov et al., 2009; Ocampo-Duque et al., 2013). The successful application of a FIS depends on proper
107 weight assignment to the fuzzy rules (Ocampo-Duque et al., 2006). In this regard, researchers from different
108 disciplines, including water quality and wetland health studies, have used the analytic hierarchy process (AHP)
109 as a reliable approach for weighting variables included in a FIS (Al Mamun et al., 2019; Ávila-Flores et al.,
110 2020; Hu et al., 2021; Srđević et al., 2020). The AHP is a robust multi-objective mathematical method
111 developed by Saaty (2003), which explicitly ranks tangible and intangible criteria against each other by
112 making pairwise comparisons between them (Sun et al., 2019).
113 Until the past few years, there have been relatively few investigations dealing with real-time and water quality
114 data to assess wetlands within arid and semi-arid regions. The development of time-series data mining
115 techniques has provided an emerging method for wetland health assessment. This paper aims to propose a
116 novel framework for wetland health assessment considering real case studies. In this regard, a fuzzy logic-
117 based wetland risk assessment approach (FLWRAA) was developed and proposed to introduce fundamental
118 improvements to the non-fuzzy ESCOM's WCRAI. This traditional non-fuzzy index was developed using an

 3

119 unweighted set of parameters, where crisp sets were used to divide their ranges. The problem associated with
120 crisp sets is that they fail to handle the epistemic uncertainty that arises from the limits of our knowledge about
121 natural systems. Furthermore, equally valued (unweighted) parameters lead to imprecise results since
122 parameters such as dissolved oxygen (DO) and electrical conductivity (EC) play a vital role in aquatic
123 ecosystems; therefore, they should be regarded with higher importance. To deal with these limitations, a FIS,
124 combined with the AHP methodology, was integrated with this traditional index to provide a more flexible
125 and reliable approach for wetland health assessment. In this regard, crisp sets were superseded by fuzzy sets,
126 and the AHP method was used to assign weights to wetland health indicators. This rapid assessment method
127 holds a central position in monitoring programs because once established, it can provide sound and
128 quantitative information on wetland health status with a relatively small investment of time and effort. The
129 applicability of the proposed approach has been evaluated by applying it to the Kani Barazan and Choghakhor
130 Ramsar sites, the Iranian wetlands with international importance, and comparing the achieved results to that
131 of the ESCOM's WCRAI.

132 2. Materials and Methods
133 2.1. Rapid risk assessment index
134 Increases in the need for effective wetland assessment and monitoring programs have resulted in numerous
135 rapid appraisal methods. Among them, the ESCOM's WCRAI is a reliable approach to determine the overall
136 wetland health status, which can be implemented by non-wetland experts (Wanda et al., 2016). This index
137 involves field sampling and in situ measurement of some water physicochemical parameters, including DO,
138 EC, and pH, which are described in section 2.3.3, as well as various physical characteristics of the wetland.
139 Data collection on the wetland's physical characteristics consists of investigating soil, fringing vegetation, and
140 aquatic vegetation of the area. These parameters are listed in Table 1.

 Table 1. Physical characteristics used in the wetland health assessment
 Indicator Description Reference
 Aquatic vegetation cover The percentage of the water surface covered with aquatic
 vegetation, including emergent, submerged, and floating plants,
 was estimated visually.
 Attached algae The relative abundance of macroalgae, as an indicator of the (Oberholster et
 trophic status of wetlands, was measured using the rapid appraisal al., 2014)
 method proposed by Oberholster et al. The categories used for the
 index are represented in Table 2.
 Spatial heterogeneity of The number of layers of aquatic vegetation was assessed (Oberholster et
 macrophytes according to Oberholster et al. and Spencer et al., where the al., 2010; Spencer
 following five macrophyte layers were included: (i) free-floating et al., 1998)
 at the surface, (ii) free-floating beneath the surface, (iii) emergent,
 (iv) in the substrate with floating leaves, and (v) submerged.
 Width of fringing vegetation The mean width of fringing vegetation was determined based on
 visual estimations of the riparian vegetation strip at four parts of
 the wetland.

 4

Degree of bank stability The degree of bank stability was assessed visually following a
 walk throughout the whole study area. The categories used for the
 index are listed in Table 2.
 Degree of pugging Degree of pugging: The mean number of animal hoof marks was (Spencer et al.,
 determined according to Spencer et al., where ten 1-m2 quadrants 1998)
 were randomly placed on the sediment surface at the wetland's
 edge.
141
 Table 2. Scoring categories for the abundance of attached algae and degree of bank stability (Oberholster et
 al., 2014)
 The abundance of attached algae
 Description Category
 Mats of microalgae present > 1.0 m2 0
 Clumps or mats of drifting microalgae present (0.51 – 1.0 m ) 2
 1
 Microalgae present (0.11 – 0.5 m ) 2
 2
 Microalgae present (0.01 – 0.1 m ) 2
 3
 Absence of algae mats 4

 Degree of bank stability
 Description Category
 Wetland banks are stable and well protected by vegetation cover High = 4
 Some minor spot erosion occurring or areas of limited vegetation Moderately high = 3
 Some erosion occurring, spot erosion points are often interlinked, and Medium = 2
 possibly minor structural and vegetation damage
 Significant areas of erosion occurring, little vegetation present Moderately low = 1
 Extensive erosion occurring, bare banks, steep or undercut banks Low = 0

142 In order to facilitate the measurements, and considering the fact that different parts of the selected wetlands
143 are exposed to different anthropogenic activities, including agricultural activities, wastewater disposal,
144 tourism, and livestock grazing, they were divided into four parts, and the results obtained from these parts
145 were averaged to calculate the overall values. The optimized ranges for scoring the described indicators as
146 well as the physicochemical parameters of water, which are described in section 2.3.2, are shown in Table 3.
147 After scoring all indicators, they are added to calculate the total score, ranging from zero to thirty-six. The
148 overall score is transferred to a percentage to determine the wetland's ecological status based on categorical
149 variables. More detailed information can be found in Oberholster et al. (2014).

 Table 3. The ESCOM's WCRAI scoring ranges for wetland health indicators (Oberholster et al., 2014)
 Score Range
 Indicator Unit
 4 3 2 1 0
 Dissolved oxygen mg/l >7 5.01 – 7.0 2.01 – 5.0 1.5 – 2.0 < 1.5
 Electrical conductivity (non- 0 - 292 293 - 833 834 - 2500 2501 - 5833 > 5833
 μS/cm
 pans)
 Electrical conductivity (pans a) μS/cm 0 – 418 419 – 2450 2451 - 7832 7833 - 11600 > 11600
 pH 7.01 – 7.5 6.61 – 7.0 6.21 – 6.6 6.0 – 6.2 < 6 or > 8
 5

7.51 – 8.0
 Width of fringing vegetation m > 30 8 – 30 3 – 7.9 0.5 - 2.9 < 0.5
 Degree of bank stability High Moderately high Medium Moderately low Low
 Degree of pugging #/m2 0 1–6 7 – 12 13 - 19 > 19
 Aquatic vegetation cover % 41 – 65 26 – 40 5 – 25 > 65 3 3 2 1 0
 macrophytes #
 Attached algae cm2 0 1 - 1000 1001 - 5000 5001 - 10000 > 10000
 a
 Small depression with an inward draining flow pattern and no outflow.

150 2.2. Development of the fuzzy logic-based wetland risk assessment approach (FLWRAA)
151 The traditional non-fuzzy wetland risk assessment indices inherit several weaknesses, leading to imprecise
152 and subjective results. Most indices use crisp sets that cannot deal with the epistemic uncertainty involved in
153 these complex environmental problems. Moreover, such indices do not consider the relative importance of the
154 parameters, i.e., they do not employ weighted parameters. In turn, some parameters with relatively less
155 importance can dramatically influence the final score. However, the need for more flexible and appropriate
156 methods to assess the wetland health level (WHL) is clearly recognized.

157 2.2.1. Fuzzy inference system
158 Fuzzy set theory has been successfully used to deal with the ambiguity and uncertainty involved in complex
159 environmental problems. As opposed to crisp sets, fuzzy logic provides sets with vague boundaries whose
160 elements are defined with degrees of membership. They can be used for mapping a set of inputs to an
161 appropriate set of outputs. Fig. 1 illustrates an input-output map for the wetland health classification problem
162 using a given set of wetland health indicators.
163 Mamdani fuzzy inference method has been shown to be the most commonly used fuzzy inference system (Al
164 Mamun et al., 2019; Komsiyah and Desvania, 2021). It provides easier to interpret and understand rule bases,
165 specifically when rules are generated based on human knowledge. The development of a fuzzy inference
166 system includes five main stages that are briefly described below.
167 a) Fuzzification: Fuzzification includes the definition of input and output variables as well as the
168 determination of the membership functions (MFs) that transform the crisp values of variables into
169 appropriate fuzzy sets through membership grades.
170 b) Rule combination: In this step, membership values are combined to obtain a single value that represents
171 the result of multiple-part antecedents. The combining process is mainly done by applying fuzzy
172 operators, namely, AND, OR, and NOT.
173 c) Weighting: Since the rules vary in importance, a weight, typically a number between 0 and 1, is
174 assigned to each one to determine the relative effect of each input variable in the final score. The
175 weighting methodology used in this study is the analytic hierarchy process, which is described in
176 section 2.2.2.

 6

177 d) Implication and aggregation: During the implication process, the consequence of a rule, which is a 178 fuzzy set, is determined by calculating the fulfillment degree of the rule. Aggregation is the process of 179 combining the outputs of all fuzzy rules, which were previously generated by the implication process, 180 to produce a single fuzzy set for each output variable. 181 e) Defuzzification: Finally, the fuzzy inference output is defuzzified to obtain a single non-fuzzy crisp 182 value for each output. The center of area (COA) has been shown to be the most widely used 183 defuzzification method (Mojtahedi et al., 2020; Shwetank et al., 2020; Wang, 2001). Fig. 1. Input-output map for the wetland health level problem in a fuzzy inference system. 184 2.2.2. The analytic hierarchy process 185 Since the efficiency of a FIS is concerned with the rule weights, an appropriate approach for weight assignment 186 is highly required. The weighting methodology used in this study is the AHP developed by Saaty (2003). The 187 AHP is a robust and widely used multi-criteria decision-making tool that solves the problem by prioritizing 188 the alternatives. It arranges the problem into three general hierarchical levels, including the goal, criteria, and 189 alternatives (Hu et al., 2021). The prioritization of the elements is carried out through pairwise comparisons. 190 For this reason, the components of each level are transferred into a × reciprocal matrix A [aij ]n n , 191 where aij elements of A represent the numerical estimates made by the decision-maker using a 1–9 scoring 192 range (Table 4). Table 4. The AHP comparison scales (Saaty, 2001) Intensity of importance Definition Explanation 1 Equal Importance Two activities contribute equally to the objective 3 Moderate importance Experience and judgment slightly favor one activity over another 7

5 Essential or Strong importance Experience and judgment strongly favor one activity over another 7 Very strong or demonstrated importance An activity is favored very strongly over another; its dominance demonstrated in practice 9 Extreme importance The evidence favoring one activity over another is of the highest possible order of affirmation 2, 4, 6, 8 Intermediate values between the two adjacent When compromise is needed judgment Reciprocals If activity i has one of the above non-zero numbers assigned to it when compared with activity j, then j has the reciprocal value when compared with i Rational Ratios arising from the scale If consistency is to be forced by obtaining n numerical values to span the matrix 193 In this matrix, elements of the main diagonal (aii) denote the same pair of components; hence, they equal 1, 194 and the symmetrical elements are mutually reciprocal (Eq. 1). 1 aij , aij > 0, i, j = 1, 2,…, n. (1) a ji 195 Therefore, the matrix A is built up of ( − 1)/2 judgments. The goal is to find a vector of priorities 196 w [w 1,w 2 ,...,w n ]T , with the normalized components (Eq. 2): n w i 1 i 1 , wi > 0, i = 1, 2,…, n (2) 197 where the × matrix of ratios W [w i / w j ]n n approximates the comparison matrix A. Matrix A is 198 consistent if (Eq. 3): ui aij , ui > 0, i, j = 1, 2,…, n. (3) uj 199 A consistent matrix naturally satisfies the transitivity relation (Eq. 4): aik aij a jk , i, j, k = 1, 2,…, n. (4) 200 Also, every element of the consistent matrix A can be determined from its first row, since (Eq. 5): a1k aik , i, k = 1, 2,…, n. (5) a1i 201 Therefore, A is a rank-one matrix with exactly one non-zero eigenvalue n , where (Eq. 6): Au nu (6) Finally, the normalized eigenvector w [w 1 ,w 2 ,...,w n ] , with the components (Eq. 7): T 202 8
ui
wi n
, j = 1, 2,…, n
(7)
u
j 1
j
203 can be determined.
204 To ensure consistency of the judgments, a consistency check must be applied (Eq. 8):
max n
CI (8)
n 1
205 where CI is the consistency index and max is the largest eigenvalue. In turn, the consistency ratio (CR) can be
206 determined as (Eq. 9):
CI
CR (9)
RI
207 where RI is the random index that can be elicited from Table 5. If CR is less than 0.10, then the matrix A is
208 considered consistent; otherwise, the judgments should be revised (Andrecut, 2014; Saaty, 2001).
Table 5. Random indices from Saaty (2004)
n 1 2 3 4 5 6 7 8 9 10
RI 0 0 0.52 0.89 1.11 1.25 1.35 1.40 1.45 1.49
209 2.2.3. Framework for the assessment of wetland health level using the fuzzy logic system
210 In this study, a fuzzy logic-based approach for evaluating wetland health level has been developed. For this
211 purpose, nine parameters, classified into three groups, are used to assess the overall wetland health. These
212 groups are as follows:
213 Group 1 (physicochemical parameters of water): DO, EC, and pH.
214 Group 2 (aquatic vegetation): aquatic vegetation cover, attached algae, and spatial heterogeneity of
215 aquatic vegetation.
216 Group 3 (soil and fringing vegetation): width of fringing vegetation, degree of bank stability, and
217 degree of pugging.
218 Trapezoidal and triangular membership functions (MFs) were used to represent the input and output variables.
219 It has been shown that trapezoidal and triangular MFs yield more efficient computations in practical
220 applications and can characterize the dynamic behavior of environmental indicators such as water quality
221 parameters (Bilgiç and TürkŞen, 2000; Dutta and Ali, 2012; Nasseri, 2008; Oladipo et al., 2021). In this study,
222 Five fuzzy sets, namely "low," "moderately low" (ML), "medium," "moderately high" (MH), and "high," were
223 used to split the inputs and outputs, except for pH, which two more sets ("slightly low" (SL) and "very low"
224 (VL)) were required to cover the whole scoring range (Fig. 2).
9Fig. 2. Linguistic variables and membership functions of the input and output variables 10
225 The physicochemical parameters of water, percentage of aquatic vegetation cover, the abundance of attached 226 algae, the width of fringing vegetation, and the wetland health level (output variable) were represented with 227 trapezoidal MFs. The number of layers of aquatic vegetation, the degree of pugging, and the degree of bank 228 stability were identified with triangular MFs to assign the maximum membership value to the values obtained 229 from field assessments and observations. Trapezoidal and triangular membership functions are represented as 230 Eq. (10) and Eq. (11), respectively (Al Mamun et al., 2019; Nayak et al., 2020). x a dx f (x;a, b, c, d) max min ,1, ,0 (10) ba dc x a cx f (x;a, b, c) max min , , 0 (11) ba cb 231 Where a, b, c, and d represent the membership function parameters. Ranges for fuzzy sets were based on the 232 ranges of the ESCOM's wetland risk assessment index. 233 Sixty rules were defined, five for each indicator and five for each group of indicators. In order to facilitate the 234 weight assignment, each rule had only one antecedent. Fuzzy rules were mainly based on two structures, but 235 there were exceptions for pH and the aquatic vegetation cover. The fuzzy rule structures are shown in Table 236 6. The rules for DO, the width of fringing vegetation, degree of bank stability, and the number of macrophyte 237 layers were based on structure I (positive correlation). While the rules for EC, degree of pugging, and the 238 abundance of attached algae followed structure II (negative correlation). The fuzzy rules for pH and aquatic 239 vegetation cover did not follow any of these structures and were based on exclusive structures. Experts with 240 either academic or field experience in wetland studies were consulted to ensure the fuzzy rules' appropriate 241 weighting. The framework of FLWRAA is shown in Fig. 3. Table 6. The fuzzy rules for wetland health indicators. (a) Structure I; (b) Structure II; (c) pH; (d) Aquatic vegetation cover (a) Structure I (positive correlation) If indicator i is a) high then wetland health level is a) high b) moderately high b) moderately high c) medium c) medium d) moderately low d) moderately low e) low e) low (b) Structure II (negative correlation) If indicator i is a) low then wetland health level is a) high b) moderately low b) moderately high c) medium c) medium d) moderately high d) moderately low e) high e) low (c) pH 11
If pH is a) medium then wetland health level is a) high
 b) slightly low b) moderately high
 c) moderately low or c) medium
 moderately high d) moderately low
 d) low e) low
 e) very low or high

 (d) Aquatic vegetation cover
 If aquatic vegetation a) moderately high then wetland health level is a) high
 cover is b) medium b) moderately high
 c) moderately low c) medium
 d) moderately low
 d) high
 e) low
 e) low
242

 Fig. 3. The framework of the fuzzy logic-based wetland risk assessment approach

243 2.3.1. Case study
244 (a) The Kani Barazan wetland in northwest Iran
245 The Kani Barazan (in local language means "the spring of the hogs") wetland, as part of the southern ecology
246 of Lake Urmia, encompasses an area of approximately 900 hectares and is located along the northern part of
247 Mahabad city (36° 59′ 32″ latitude North and 45° 46′ 32″ longitude East) in the province of West Azerbaijan,
248 Iran (Fig. 4). The wetland is supplied by the Mahabad dam and its downstream river. The area experiences a
249 semi-arid climate with distinct seasons. The annual average rainfall is 410 mm, with the most precipitation
250 falling from October to May. Regarding its unique geological characteristics, the Kani Barazn wetland was
 12
251 added to the list of Ramsar sites in 2011 and recorded as the first Iranian birdwatching site home to various
252 indigenous and migratory species (Mansouri and Majnoni, 2014). Based on Escom's WCRAI (Oberholster et
253 al., 2014), this area can be categorized as a hillslope seepage wetland. Water quality in the Kani Barazan
254 wetland is monitored with an online monitoring station (Fig. 5) established in 2019 as a part of the
255 Conservation of Iranian Wetlands Project (CIWP). The CIWP started as a joint initiative between the
256 Government of Iran, Global Environmental Facility (GEF), and the United Nations Development Program
257 (UNDP) to enhance the sustainability of Iran's protected wetland areas and preserve their globally-significant
258 biodiversity (Ruzbahani and Manager, 2013). The online monitoring station regularly measures the DO, EC,
259 pH, water temperature, water level, and meteorological parameters such as air pressure and temperature.
260 Consequently, this station was selected as one of the four water sampling points.

261 (b) The Choghakhor wetland in the central west of Iran
262 The Choghakhor (in local language means "the sun hill") wetland in the south of Shahr-e Kord, Chaharmahal
263 and Bakhtiari province (31° 55' 23" latitude North, 50° 53' 59" longitude East) is located at the northern slopes
264 of Kallar mountain (Fig. 4). The topography of the region is such that the plain formed by the mountains
265 "Baraftab" in the north, "Shapurnaz" in the west, and "Kallar" from the west to the south has created a drainage
266 basin of 114 square kilometers as a suitable location to feed a wetland with a surface area of about 1500
267 hectares. The main water sources for this water body of 44-46 million cubic meters are upstream rainfall of
268 the drainage basin, numerous springs, and groundwater flow due to snowmelt in warm seasons. Due to the
269 wetland's location in the Zagros mountain range, various factors such as the presence of a high-pressure belt
270 cause significant changes in the region's climate during the year. As a result, when the belt shifts to lower
271 latitudes in hot seasons, rainfall decreases, and in winter, when the belt shifts to the Persian Gulf, it provides
272 suitable conditions for the entry of western cyclones and subsequent increase in rainfall. Annual precipitation
273 in the wetland varies from 500 to 750 mm.
274 Based on the ESCOM's WCRAI (Oberholster et al., 2014), this area can be categorized as a permanently
275 inundated lake wetland. The Choghakhor wetland is known as one of the Important Bird Areas (IBA) for it is
276 the habitat of a wide range of animals and plants, including more than 20 bird species (2 endangered species).
277 Also, in 2011, Choghakhor was listed as a Ramsar site according to its international importance (Ramsar
278 Convention, 2020). Providing a safe water source along with flood control are some of the services that this
279 wetland has provided to encompassing populations. Like other Ramsar sites under the protection of the CIWP,
280 the Choghakhor wetland is equipped with an online monitoring station that was established and connected to
281 the central server present at CIWP headquarters in 2018 (Fig. 5). The station continuously measures various
282 parameters, including DO, EC, and pH at three different levels (0.3, 0.85, and 1.4 meters), water temperature,
283 water level, and meteorological parameters such as air pressure, temperature, and humidity. The station was
284 chosen as one of the four periodic water sampling points.

 13
(a) Satellite view of the Kani Barazan wetland

 Fig. 4. (b) Satellite view of the Choghakhor wetland
285
 14
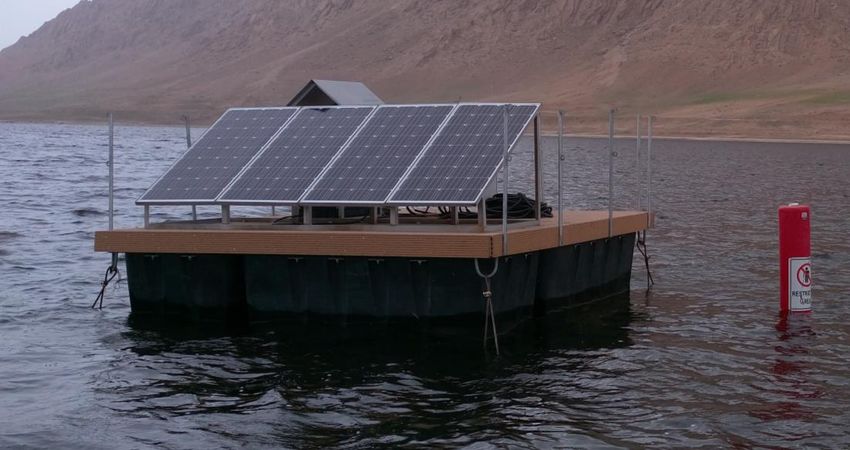
(a) The online monitoring station in the Kani Barazan wetland

 Fig. 5. (b) The online monitoring station in the Choghakhor wetland

286 2.3.2. Eutrophication control by the Iranian Department of Environment
287 Eutrophication is inherently a natural process that may take thousands of years to occur, but human
288 intervention can accelerate it, in which case it is called human-induced eutrophication, which is one of the
289 problems and threats to water bodies. Stopping natural eutrophication is an arduous and almost impossible
290 task, while the human-induced type can be controlled with appropriate measures to limit nutrient-producing
291 resources. The aging of a lake due to eutrophication occurs with warmer and shallower water and eventually
292 turns into a bog or swamp.
293 The Iranian Department of Environment has recently inaugurated a project to identify the problems associated
294 with Iranian wetlands and accordingly educate local populations to reduce imposed hazards to a possible
295 minimum. Unprecedented algal bloom in the Kani Barazan wetland is one of the main problems caused by its
296 high eutrophication level. As a part of this project, field studies have been conducted to detect and control the

 15
297 factors that aggravate the wetland's eutrophication (Mahabad Environmental Protection Organization, 2020).
298 After examining the type of land use in the area, it was found that irrigated agriculture, orchards, dryland
299 agriculture, pastures, saline lands, and wetland are the six main types of land use within the ecological area of
300 the Kani Barazan wetland. According to the results, phosphate and nitrate ions enter the wetland as the main
301 nutritional factors from industrial, rural, and agricultural effluents. Discharging sewage of Qarah Dagh village
302 has been identified as the primary source of entering nutrition into the wetland (Fig. 6). In this regard, training
303 workshops were organized in the surrounding villages to obtain a more comprehensive perspective on the
304 matter to establish a ceiling on human activities that intensify the eutrophication of the wetland.
305 In this project, the participatory rural appraisal (PRA) survey method was implemented to ask the locals about
306 the wetland's main problems. According to the results, chemical fertilizers, detergents, spraying, manures, and
307 rural sewage were raised as the major problems associated with the wetland's health. Consequently, several
308 solutions were proposed and implemented to resolve this issue, including reducing the usage of chemical
309 fertilizers, separation of sewage from surrounding villages and avoiding its discharge into Mahabad river,
310 treatment of rural domestic wastewater, discharge of rural wastewater into absorbing wells or the use of septic
311 tanks for each neighborhood of the village, sanitary disposal of waste and no dumping into the river, and the
312 use of organic detergents for domestic applications were pointed out to alleviate eutrophication in the wetland.
313 So far, promising results are achieved through continuous monitoring activities and friendly collaboration of
314 local people with authorities.

 Fig. 6. Relative location of the Kani Barazan wetland and Qarah Dagh village

315 2.3.3. Water sampling
316 Water samples were collected periodically every three months from April 2019 to April 2020 in the Kani
317 Barazan wetland and from January 2019 to November 2020 in the Choghakhor wetland. Four sampling points
318 (SP) are located in the study areas, with SP3 and SP2 being the online monitoring stations in the Kani Barazan
319 and Choghakhor wetlands, respectively (Fig. 7). The periodic values obtained from these sampling points
320 were averaged to calculate the overall values of the indicators. In line with standard sampling methods,
 16
321 nonreactive sampling bottles were rinsed thoroughly two times using the wetland water before sampling. Each
322 sample was analyzed for DO, EC, and pH. All the final samples were collected at the same water level.
323 Immediately after sampling, pH and EC were measured in situ using a multi-parameter portable meter (TES-
324 1381K, Taiwan), while DO was measured in the laboratory. The ranges used for scoring these parameters are
325 listed in Table 3.

 (a) Four parts of the Kani Barazan with water sampling points

 Fig. 7. (b) Four parts of the Choghakhor wetland with water sampling points

326 3. Results and discussion
327 A fuzzy logic-based approach to assess the wetland health level was developed. The mean values of the
328 selected wetland health indicators were used to test this approach. Weights for wetland health indicators
 17
329 calculated with the AHP method are shown in Fig. 8. A questionnaire survey was conducted to collect experts'
330 opinions, including authorities from the Iranian Department of Environment, about the fuzzy rules' weight
331 assignment. The questionnaire consisted of a formally written set of questions and pairwise comparisons of
332 the parameters. Due to topographical, cultural, and political differences between the two selected wetlands
333 and different extents of anthropogenic activities, especially agriculture and livestock grazing in these areas,
334 the use of localized rule weights is necessary to provide a sound evaluation of the ecosystem health status and
335 reflect the local conditions. Therefore, it will be possible to adopt managerial approaches appropriate to each
336 wetland through localized rule weights. In this regard, different rule weights were achieved based on experts'
337 opinions for each study area. However, the physicochemical parameters of water and aquatic vegetation
338 indicators generally played a critical role in the health status of both wetlands.

 Fig. 8. Optimized weights used in the FLWRAA obtained by the AHP methodology.

 18
339 3.1. Monitoring and interpretation of variations in wetland characteristics
340 Among various water quality indicators, the temperature is one of the most instrumental factor influencing
341 nearly all other quality indices to different extents. Apart from its impacts on water quality parameters,
342 physical changes associated with temperature fluctuations in waterbodies also influence the biological
343 activities of organisms present in the aquatic environment, hence, changing oxidation-reduction potential
344 (ORP), metabolic, photosynthetic, and toxicity patterns (Wilde, 2006). Moreover, an increase in water
345 temperature by 10 °C approximately doubles the physiological function (Di Santo and Bennett, 2011). The
346 higher temperature of wetland water leads to increased respiration rates. Consequently, if extended for a long
347 period, higher oxygen consumption militates against desirable fish life through putrefaction of sludge deposits
348 and facilitating sewage fungus growth. Plants are also other victims of temperature fluctuations. Severe
349 phenomena such as elevated temperatures and droughts can increase the evaporation rate of water, leading to
350 the evolution from aquatic vegetation to semi-arid vegetation and endangering the diversity and biomass of
351 wetland vegetation (Fu et al., 2020). On the other hand, various algae species require different temperature
352 peaks for proper algal photosynthesis (Borlongan et al., 2020). For these reasons, long-term monitoring data
353 on temperature fluctuations can provide useful information about the overall wetland health status and its
354 biological activities.
355 Exposed to highly variable climatic conditions, the Kani Barazan and Choghakhor wetlands undergo
356 considerable temperature fluctuations throughout the year. During the study period, the mean daily water
357 temperature differences between the coldest and warmest times were respectively 21.87 °C and 26.08 °C in
358 2019 and 2020 in the Choghakhor wetland and 23.6 °C in the Kani Barazan wetland (Fig. 9).

 (a) The relationship between mean daily air and water temperature in the Kani Barazan wetland between
 March 2019 and April 2020.

 19
Fig. 9. (b) Relationship between mean daily air and water temperature in the Choghakhor wetland between
 December 2018 and January 2021

359 As two of the most influential physicochemical parameters of water, DO and EC make a significant
360 contribution to the ecological integrity of aquatic ecosystems. In this regard, the relation between water
361 temperature and DO, the most influential parameter in the FLWRAA, along with the impact of EC on DO,
362 was separately tracked by the installed sensors in both wetlands (Fig. 10). Besides the seasonal variations in
363 DO and EC levels caused by natural factors such as climatic processes, inflow, and outflow of the water body,
364 anthropogenic activities can also dramatically influence these parameters, which are the main concern for
365 water resources managers. According to Fig. 10, DO concentrations decrease as water temperature increases,
366 indicating the inverse relationship between DO and temperature. In addition, the seasonal variations in EC
367 levels of the Choghakhor wetland as an indicator of salinity are clearly evident in Fig. 11. On the other hand,
368 there are some abrupt and unusual changes in EC levels of the Kani Barazan wetland that are mainly caused
369 by wastewater discharge and agricultural runoff rich in nutrients and dissolved salts, which in turn facilitate
370 algal growth and promote EC levels. However, this problem is being dealt with by the Iranian Department of
371 Environment as a part of a comprehensive project, which is described in section 3.2, for detecting primary
372 pollution sources to control flows of nutrients and dissolved salts into the wetland.

 20
(a) The relationship between mean daily DO and water temperature in the Kani Barazan wetland between
 March 2019 and April 2020.

 Fig. 10. (b) The relationship between mean daily DO and water temperature in the Choghakhor wetland
 between December 2018 and January 2021
373

 21
(a) The relationship between mean daily DO and EC in the Kani Barazan wetland between March 2019 and
 April 2020.

 Fig. 11. (b) The relationship between mean daily DO and EC in the Choghakhor wetland between December
 2018 and January 2021.

374 Part 3 of the Kani Barazan wetland was selected to explore short-term temporal variations in this part's health
375 level based on the highest and lowest DO and EC levels via the FLWRAA. The reason for selecting this part
376 was that it is the deepest part of the wetland in which water is always present, and the data on physicochemical
377 parameters of water is recorded every thirty minutes in this part via the online monitoring station, making it
378 possible to track abrupt and short-term changes in water quality parameters. However, the whole wetland's
379 health level was determined using the data collected from all four parts. The mean daily DO and EC values
380 between March 2019 and April 2020 were obtained by averaging the online monitoring station's time-series

 22
381 data (Fig. 10). The lowest (0.87 mg/l) and highest (28.31 mg/l) DO levels respectively appeared on July 30,
382 2019, and January 2, 2020. Also, the highest (9264.95 μS/cm) and lowest (121.75 μS/cm) EC levels were
383 recorded on August 22, 2019, and October 25, 2019, respectively. The values of respective mean daily DO
384 and EC, as well as other wetland health indicators, are represented in Table 7.

 Table 7. Values of wetland health indicators for part 3 of the Kani Barazan wetland
 Date
 Indicator Unit
 2-Jan-20 30-Jul-19 22-Aug-2019 25-Oct-19
 DO (mg/l) 28.31 0.87 3.79 10.98
 EC (μs/cm) 889.70 7246.21 9264.95 121.75
 pH 8.61 8.78 8.78 8.32
 Aquatic vegetation cover (%) 30 35 35 35
 Attached Algae (cm2) 2200 4800 4800 2000
 Spatial heterogeneity of 5 5 5 5
 macrophytes (#)
 Width of fringing vegetation (m) 18 22 22 20
 Degree of bank stability Moderately high Moderately high Moderately high Moderately high
 Degree of pugging (#/m ) 2 9 11 11 10
 Closest periodic data 16-Jan-20 16-Jul-19 16-Jul-19 16-Oct-19
 collection date

385 It should be noted that the non-time series data (pH, aquatic vegetation, and soil and fringing vegetation) used
386 in the assessment of WHL based on extreme values of DO and EC were acquired from the closest assessment
387 and data collection period that was carried out with a three-month interval. A comparison between water
388 temperature and WHL results for part 3 based on the mentioned extreme values is shown in Fig. 12.

 Fig. 12. A comparison between wetland health levels (part 3) based on DO and EC extreme values and
 mean daily water temperature.

 23
389 The wetland health level is in an undesirable state in July, in which the basic ecosystem functions can be
390 disrupted if such a condition persists. On August 22, despite the continuous increase of EC levels, the wetland
391 partially recovers from this state as DO levels increase. As it is evident, a dramatic increase in the EC level
392 followed by a decreased DO level can significantly affect wetland health, even though the values of other
393 indicators, except for pH, remain above moderate levels. The DO levels remain under an acceptable hypoxia
394 threshold (5-6 mg/l) (Farrell and Richards, 2009) for freshwater environments from late June to September.
395 This phenomenon can be traced back to a sudden increase in EC levels caused by an excessive supply of
396 nutrients, especially nitrogen and phosphorus, from agricultural runoff and elevated temperatures. High
397 availability of nutrients (eutrophication) stimulates the excessive growth of algae, causing dissolved oxygen
398 depletion. Such a long-lasting eutrophic state, followed by hypoxia (low dissolved oxygen levels), can cause
399 irreversible damage to the wetland's sensitive species. In the following months, as DO levels increase and EC
400 levels drop remarkably, the conditions become more favorable for further improvement of the wetland health.
401 As it is evident, physicochemical parameters of water play a more crucial role in the overall health status of
402 the wetland than other groups of parameters. Although the wetland experiences severe short-term conditions,
403 its overall function and biological integrity will remain undisturbed as long as such conditions do not persist
404 for an extended time. Physicochemical parameters are highly susceptible to human disturbance and can
405 undergo dramatic changes to a point where the wetland's overall health status can be impacted; therefore, an
406 optimized approach that incorporates weighted parameters and is sensitive to local conditions and the human
407 activities that take place in the area is essential for providing more realistic wetland health status results.

408 3.2. Evaluation of the wetland health level via FLWRAA
409 Risk assessment is an integral part of sustainable wetland management, where the ecosystem's health and wise
410 exploitation are ensured. In this regard, the health status of the Kani Barazan and Choghakhor wetlands, as
411 two of the most important Iranian Ramsar sites, were assessed with both the proposed FLWRAA and the
412 traditional ESCOM's WCRAI to ensure an accurate and reliable risk assessment of the ecosystems and
413 evaluate the applicability of the proposed approach. Table 8 represents the results of field measurements for
414 four parts of the study areas. The measurements were carried out periodically every three months from April
415 2019 to April 2020 in the Kani Barazan wetland and from January 2019 to November 2020 in the Choghakhor
416 wetland

 Table 8. Mean values of the wetland health indicators
 The Kani Barazan wetland
 Wetland part
 Indicator Unit
 Part 1 Part 2 Part 3 Part 4
 DO (mg/l) 6.82 7.22 8.42 7.14
 EC (μs/cm) 3856 4466 3122 4258
 pH 8.2 8.51 8.67 8.75
 Aquatic vegetation cover (%) 20 30 35 45

 24
Attached Algae (cm2) 2300 3600 3200 3000
 Spatial heterogeneity of macrophytes (#) 5 6 5 6
 Width of fringing vegetation (m) 23 32 21 38
 Degree of bank stability High High Moderately high Moderately high
 2
 Degree of pugging (#/m ) 5 8 11 14

 The Choghakhor wetland (2019)
 Wetland part
 Indicator Unit
 Part 1 Part 2 Part 3 Part 4
 DO (mg/l) 6.28 6.59 5.26 5.64
 EC (μs/cm) 340.69 328.98 510.17 507.42
 pH 9.65 9.73 9.86 9.92
 Aquatic vegetation cover (%) 25 20 30 30
 Attached Algae (cm2) 3800 3700 4200 4000
 Spatial heterogeneity of macrophytes (#) 3 2 3 2
 Width of fringing vegetation (m) 2.5 1.5 2 1.5
 Degree of bank stability Medium Medium Moderately high Moderately high
 Degree of pugging (#/m2) 11 12 8 10

 The Choghakhor wetland (2020)
 Wetland part
 Indicator Unit
 Part 1 Part 2 Part 3 Part 4
 DO (mg/l) 4.62 5.18 4.34 4.23
 EC (μs/cm) 351.72 330.16 532.26 546.34
 pH 9.13 9.04 9.21 9.37
 Aquatic vegetation cover (%) 20 20 25 25
 Attached Algae (cm2) 4000 4000 4500 4700
 Spatial heterogeneity of macrophytes (#) 3 2 3 2
 Width of fringing vegetation (m) 2 2 1.5 2
 Degree of bank stability Medium Medium Moderately high Medium
 Degree of pugging (#/m2) 13 12 8 10

417 For the Kani Barazan wetland health level, the overall output scores of 58.62% and 63.19% were respectively
418 obtained from the FLWRAA and the traditional framework. The health assessment of the Choghakhor wetland
419 was conducted between 2019 and 2020. The results obtained from both frameworks confirmed a decline in
420 the wetland health level in 2020 compared to 2019. The FLWRAA generated overall scores of 48.75% and
421 42.92% for the Choghakhor wetland health level for 2019 and 2020, respectively. On the other hand, the
422 overall scores of 51.38% and 46.52% were respectively achieved for 2019 and 2020 using the traditional
423 framework. Although the traditional framework generated higher scores than FLWRAA, the results of both
424 frameworks were consistent. The output scores were categorized using an A-F ecological scale to determine
425 the wetland health status (Table 9).

 25
Table 9. Description of the A-F ecological categories (Oberholster et al., 2014)
 Ecological category Score in percentage (%) Description
 A 90-100 Unmodified (natural)
 B 80-90 Mostly natural with few modifications. A few small-scale natural
 habitats and biota changes may have occurred, but the ecosystem
 functions are essentially unchanged.
 C 60-80 Moderately modified. Changes in and loss of natural habitat and
 biota have occurred, but the basic ecosystem functions are still
 predominantly unchanged.
 D 40-60 Largely modified. A massive loss of natural habitat, biota, and
 basic ecosystem function has occurred.
 E 20-40 Seriously modified. The loss of natural habitat, biota, and basic
 ecosystem functions is extensive.
 F 0-20 Critically modified. Modifications have reached a critical level,
 and the system has been entirely modified with an almost
 complete loss of natural habitat and biota.

426 Based on this scale, the output score of the FLWRAA for the Kani Barazan wetland can be categorized as
427 "D," while the output score of the traditional framework falls into the category of "C." Similarly, scores
428 obtained from the FLWRAA and the traditional framework for the Choghakhor wetland can be categorized
429 as "D," albeit a decline of about 5% is evident in the scores of both frameworks for 2020 in comparison to that
430 of 2019. In general, the FLWRAA yielded lower scores for both study areas. For the Kani Barazan wetland,
431 parts 1, 4, and the wetland's overall health status fell into lower categories, indicating a more disturbed
432 ecosystem. A similar trend is also evident in the Choghakhor wetland's scores, even though they fell into the
433 same ecological categories when using the A-F scale. A comparison between the results of the proposed
434 FLWRAA and the ESCOM's WCRAI is depicted in Fig. 13. The difference in results stems from the fact that
435 the traditional framework employs equally weighted indicators in which parameters with lower importance,
436 such as the degree of pugging, dramatically affect the output score and lead to unrealistic results. On the other
437 hand, the role of critical parameters such as DO and aquatic vegetation cover was underestimated. According
438 to the achieved results, more deliberate and conservative managerial strategies are required to prevent the
439 further degradation of both wetlands and alleviate their damaged parts.

 26
(a) Results for health level of the Kani Barazan wetland

 Fig. 13. (b) Results for health level of the Choghakhor wetland in 2019 and 2020

440 4. Conclusions
441 This paper investigates a new fuzzy logic-based wetland risk assessment approach (FLWRAA) to improve
442 the traditional ESCOM's wetland classification and risk assessment index (WCRAI), using automatically and

 27
443 manually collected data. For this purpose, the relative importance of the wetland health indicators involved in
444 the fuzzy inference system was determined using the AHP weighting methodology. The Kani Barazan and
445 Choghakhor wetlands were selected as hotspot sites to demonstrate the applicability of the proposed approach
446 for managing Iran's wetland protected areas. The following conclusions can be drawn:
447 The sensitivity analysis process emphasizes that the untreated wastewater and agricultural runoff that contain
448 high amounts of nutrients and dissolved salts considerably influence DO levels of the Kani Barazan wetland
449 by manifesting their effects on facilitating algal growth and promoting EC levels. By averaging time-series
450 data obtained from the Kani Barazan wetland's online monitoring station, it was observed that the lowest (0.87
451 mg/l) and highest (28.31 mg/l) mean daily DO levels respectively appeared on July 30, 2019, and January 2,
452 2020. Also, the highest (9264.95 μS/cm) and lowest (121.75 μS/cm) mean daily EC levels were recorded on
453 August 22, 2019, and October 25, 2019, respectively. However, according to the comprehensive project
454 conducted by the Iranian Department of Environment for controlling eutrophication in Iranian wetlands,
455 including the considered wetlands of this study, promising improvements were observed in the overall wetland
456 health level. In this regard, managing the agricultural runoff and preventing the discharge of untreated
457 wastewater to the wetlands can significantly contribute to the wetland health status and pave the way for the
458 success of the Iranian Department of Environment in controlling the eutrophication in Iranian wetlands.
459 The health level of the Kani Barazan and Choghakhor wetlands were assessed with both the FLWRAA and
460 the ESCOM's WCRAI. For the Kani Barazan wetland, an overall output score of 63.19% (C) was obtained
461 from the traditional index. In turn, the overall score of 58.62% (D) was achieved using the FLWRAA,
462 indicating a more disturbed wetland that falls into a lower ecological category compared to the result yielded
463 by the traditional index. On the other hand, for the Choghakhor wetland, the overall scores of 51.38% (D) and
464 46.52% (D) were achieved using the ESCOM's WCRAI for 2019 and 2020, respectively. In turn, the
465 FLWRAA yielded 48.75% (D) and 42.92% (D), respectively, for 2019 and 2020. Although the scores
466 generated by the FLWRAA for the Choghakhor wetland were lower than that of the ESCOM's WCRAI, they
467 all were categorized as "D" based on the A-F ecological category. The differences in both wetlands' scores
468 stem from the fact that the traditional framework employs unweighted indicators, which in turn, parameters
469 with lower importance, such as the degree of pugging, significantly affect the output score, and critical
470 parameters such as DO is underestimated.
471 This study highlights the importance of continuous wetland health monitoring and early warning systems.
472 Properly utilizing the daily time-series data recorded by the online monitoring stations' sensors can secure the
473 wetland's ecological integrity against anthropogenic and natural hazards. Moreover, the proposed AHP-FIS
474 based wetland risk assessment approach can yield more realistic results due to using exclusively weighted
475 parameters for the wetland that are generated based on experts' opinions and knowledge to deal with the
476 inefficiencies associated with the traditional approach. While it does not necessarily lead to different
477 categories of aggregated scores, as seen for the second case study (the Choghakhor wetland), the observed
478 differences in health level categories of the first case study emphasize the importance of using the AHP-FIS

 28
You can also read