Detection of Anomalous Diffusion with Deep Residual Networks
←
→
Page content transcription
If your browser does not render page correctly, please read the page content below

entropy
Article
Detection of Anomalous Diffusion with Deep Residual Networks
Miłosz Gajowczyk † and Janusz Szwabiński *,†

                                          Faculty of Pure and Applied Mathematics, Hugo Steinhaus Center, Wrocław University of Science
                                          and Technology, 50-370 Wrocław, Poland; gajowczyk.milosz@gmail.com
                                          * Correspondence: janusz.szwabinski@pwr.edu.pl
                                          † These authors contributed equally to this work.

                                          Abstract: Identification of the diffusion type of molecules in living cells is crucial to deduct their
                                          driving forces and hence to get insight into the characteristics of the cells. In this paper, deep
                                          residual networks have been used to classify the trajectories of molecules. We started from the well
                                          known ResNet architecture, developed for image classification, and carried out a series of numerical
                                          experiments to adapt it to detection of diffusion modes. We managed to find a model that has a better
                                          accuracy than the initial network, but contains only a small fraction of its parameters. The reduced
                                          size significantly shortened the training time of the model. Moreover, the resulting network has less
                                          tendency to overfitting and generalizes better to unseen data.

                                          Keywords: SPT; anomalous diffusion; machine learning classification; deep learning; residual neural
                                          networks

                                1. Introduction

                                               Recent advances in single particle tracking (SPT) [1–4] have allowed to observe single
Citation: Gajowczyk, M.;
Szwabiński, J. Detection of
                                          molecules in living cells with remarkable spatio-temporal resolution. Monitoring the details
Anomalous Diffusion with Deep
                                          of molecules’ diffusion has become the key method for investigation of their complex
Residual Networks. Entropy 2021, 23,
                                          environments.
649. https://doi.org/10.3390/                  The data collected in SPT experiments often reveal deviations from the Brownian
e23060649                                 motion [5], i.e., the normal diffusion governed by the Fick’s laws [6] and characterized
                                          by a linear time-dependence of the mean square displacement (MSD) of the molecules.
Academic Editor: Alberto Guillén          Those deviations are referred to as anomalous diffusion, a field intensively studied in the
                                          physical community [7–10]. Since Richardson found a cubic scaling of MSD for particles
Received: 6 April 2021                    in turbulent flows [11], anomalous diffusion was observed in many processes including
Accepted: 19 May 2021                     tracer particles in living cells [12–14], transport on fractal geometries [15], charge carrier
Published: 22 May 2021                    transport in amorphous semiconductors [16], quantum optics [17], bacterial motion [18],
                                          foraging of animals [19], human travel patterns [20] and trends in financial markets [21].
Publisher’s Note: MDPI stays neutral      Depending on the type of nonlinearity, the anomalous diffusion is further divided into
with regard to jurisdictional claims in   sub- and superdiffusion—two categories corresponding to sub- and superlinear MSD,
published maps and institutional affil-   respectively.
iations.                                       Several analytical approaches have already been attempted to analyze mobility patterns
                                          of molecules. The most popular one is based on the mean square displacement [7,22–25].
                                          The appeal of this method lies in its relative simplicity. However, it is known to have
                                          several limitations due to the finite precision of SPT setups [7,22,26,27] and the lack of
Copyright: © 2021 by the authors.         significant statistics (short trajectories and/or very few ones). To overcome these problems,
Licensee MDPI, Basel, Switzerland.        several other analytic methods have been proposed [27–38]. Most of them simply replace
This article is an open access article    MSD by other features calculated from trajectories (e.g., radius of gyration [28] or velocity
distributed under the terms and           autocorrelation function [39]).
conditions of the Creative Commons             In the last few years, classification of diffusion modes utilizing machine learning (ML)
Attribution (CC BY) license (https://
                                          algorithms is gaining on popularity. Bayesian approach [40–42], random forests [43–47],
creativecommons.org/licenses/by/
                                          gradient boosting [44–47], neural networks [48], and deep neural networks [44,49–51]
4.0/).

Entropy 2021, 23, 649. https://doi.org/10.3390/e23060649                                                   https://www.mdpi.com/journal/entropy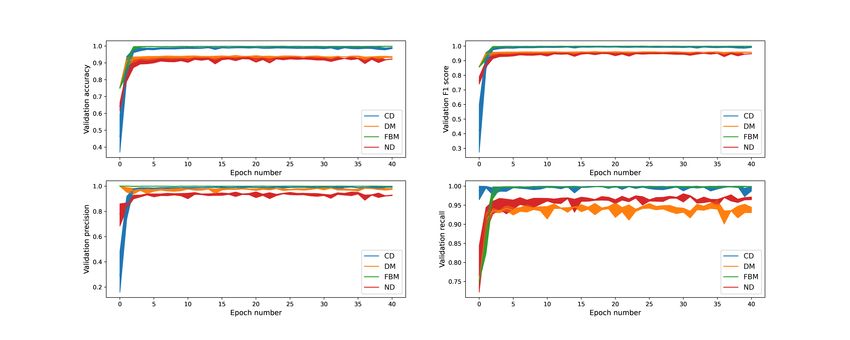
Entropy 2021, 23, 649                                                                                              2 of 21

                        have already been used in an attempt to either just classify the trajectories or to extract
                        quantitative information about them (e.g., the anomalous exponent [45,49,51]). The ML
                        approach seems to be more powerful than the analytical one. However, the latter usually
                        offers a deeper insight into the underlying processes governing the dynamics of molecules.
                             Despite the enormous progress in both the analytical and ML methods, the analysis of
                        SPT data remains challenging. The classification results produced by different methods
                        often do not agree with each other [27,38,46,47]. The reasons are similar to the ones limiting
                        the applicability of MSD: localization errors, short trajectories, or irregular sampling.
                        Thus, there is still need for new robust methods for anomalous diffusion. To catalog the
                        already existing approaches, to assess their usability and to trigger the search for new
                        ones, a challenge (called AnDi challenge) was launched last year by a team of international
                        scientists [52].
                             In this paper, we are going to present a novel approach to anomalous diffusion based
                        on deep residual networks (ResNets) [53]. In general, deep learning is quite interesting
                        from the perspective of an end user, since it is able to extract features from raw data
                        automatically, without any intervention by a human expert [54]. We already tested the
                        applicability of convolutional neural networks (CNN) to SPT data [44]. They turned out
                        to be very accurate. However, their architecture was quite complicated and the training
                        times (including an automatic search for an optimal model) were of the order of days.
                        Moreover, the resulting network had problems with the generalization to data coming
                        from sources different than the ones used to generate the training set. Residual networks
                        are a class of CNNs able to cure most of the problems the original CNN architecture is
                        facing (i.e., vanishing and/or exploding gradients, saturiation of accuracy with increasing
                        depth). They excel in image classification—a ResNet network won the ImageNet Large
                        Scale Visual Recognition Challenge (ILSVRC) in 2015.
                             We will start from the smallest of the residual architectures, i.e., ResNet18, and then
                        perform a series of numerical experiments in order to adopt it to characterization of
                        anomalous diffusion. Our strategy for model tuning will be quite simple and focused
                        mainly on the reduction of the parameters of the network. However, it should be noted
                        here that there exist already sophisticated methods for designing small models with good
                        performance [55–58]. The resulting network will then be applied to the G protein-coupled
                        receptors and G proteins data set, already analyzed in Refs. [38,46,47]. Although our
                        method is not a direct response to the AnDi Challenge [52] (e.g., we use different diffusion
                        models for training), it is consistent with its goal to search for new robust algorithms for
                        classification.
                             The paper is structured as follows. In Section 2, we briefly introduce the basics of
                        MSD-based methods, the diffusion models we are interested in as well as the residual
                        networks, which will be used for classification. In Section 3, data sets are briefly discussed.
                        The search for the optimal architecture and the performance of the resulting model are
                        presented in Section 4. The results are concluded in the last section.

                        2. Models and Methods
                        2.1. Traditional Analysis
                              A typical SPT experiment yields a series of coordinates (2D or 3D) over time for every
                        observed particle. Those series have to be analyzed in order to find a relationship between
                        the individual trajectories and the characteristics of the system at hand [59]. Typically, the
                        first step of the analysis is the detection of the type of diffusion encoded in the trajectories.
                              The most common approach to classification of diffusion is based on the mean-square
                        displacement (MSD) of particles [7,22–25]. The recorded time series is evaluated in terms
                        of the time averaged MSD (TAMSD),
                                                                    Z ∞
                                                               1                               2
                                                  δt2 (∆) =                x (t0 + ∆) − x (t0 ) dt0                   (1)
                                                              t−∆   0
Entropy 2021, 23, 649 3 of 21
where x (t) is the position of the particle at time t and ∆ is the time lag separating the
consequtive positions of the particle. Typically, δt2 (∆) is calculated in the limit ∆
t to
obtain good statistics, since the number of positions contributing to the average decreases
with the increasing ∆.
The idea behind the MSD-based method is simply to evaluate the experimental MSD
curves, i.e., δt2 (∆) as a function of the varying time lag ∆ and then to fit them with a
theoretical model of the form
δt2 (∆) ' Kα ∆α , (2)
where Kα is the generalized diffusion coefficient and α is the so-called anomalous exponent.
The value of the latter one is used to discriminate between different diffusion types.
The case α = 1 corresponds to the normal diffusion (ND), also known as the Brownian
motion [5]. In this physical scenario, a particle moves freely in its environment. In other
words, it does not meet any obstacles in its path, and it also does not interact with other
distant molecules. Any non-Brownian (α 6= 1) emanation of particle transport is referred
to as the anomalous diffusion. A sublinear MSD (α < 1) stands for subdiffusion, which
is appropriate to represent particles slowed down due to viscoelastic properties of their
surroundings [60], particles colliding with obstacles [61,62] or trapped particles [63,64].
A superlinear case (α > 1) indicates superdiffusion, which relates to a fast and usually
directed motion of particles driven by molecular motors [65].
2.2. Choice of Diffusion Models
Many different theoretical models of diffusion may be used for analysis of experimen-
tal data (see Ref. [9] for a detailed overview). However, following Refs. [43,44], we decided
to consider four models: normal diffusion [5], directed motion (DM) [22,66,67], fractional
Brownian motion (FBM) in subdiffusive mode [68], and confined diffusion (CD) [40].
According to Saxton [7], for those basic models of diffusion in 2D, we have:
δ2ND (∆) = 4D∆,
2
δFBM (∆) = 4D∆α , (3)
2 (∆) 2
δDM = 4D∆ + (v∆) ,
−4A2 D∆
2
δCD (∆) ' rc 1 − A1 exp
2 .
rc2
Here, v is the drift velocity in the directed motion, the constants A1 and A2 characterize
the shape of the confinement, and rc is the confinement radius.
2.3. Deep Learning Classification Methods
The above method has become very popular in the SPT community due to its simplicity.
It should work flawlessly for pure long trajectories with no localization errors. However,
real trajectories usually contain a lot of noise, which makes the fitting of mathematical
models to MSD curves challenging, even in the case of normal diffusion [22]. Moreover,
many experimental trajectories are short, limiting the evaluation of the MSD curves to
just a few time lags. As a consequence, there is a need for methods going beyond MSD to
provide a reliable information concerning the trajectories.
In a recent paper [44], we proposed two machine learning methods that outperform
the MSD analysis in case of noisy data. The first one is perceived as traditional machine
learning and utilizes a set of human-engineered features that should be extracted from
trajectories to feed the classifiers (see also Refs. [46,47] for a more extensive analysis). The
second one is based on deep neural networks, which constitute the state-of-the-art of the
modern machine learning classification. We showed that both methods perform similarly
on the synthetic test data. However, the deep learning approach may seem appealing to
practitioners from the SPT community because it usually operates on raw trajectories as
input data and does not require human intervention to create features for each trajectory.Entropy 2021, 23, 649 4 of 21
A cascade of multiple layers of nonlinear processing units is used in this case for automatic
feature identification, extraction, and transformation [69].
2.3.1. Convolutional Neural Networks
Convolutional neural networks (CNN) were used in Ref. [44] for classification pur-
poses. This choice was triggered by the fact that those networks have already been success-
ful in many tasks including time series analysis [70]. A CNN has usually two components.
The first one consisting of hidden layers extracts features from raw data. The fully con-
nected part of the network is responsible for classification (see Figure 1 for a schematic
representation of a CNN). In order to detect features in the input data, the hidden layers
perform a series of convolutions and pooling operations. Each convolution provides its
own map of features (a 3D array) by utilizing a filter that is sliding over the input data. The
size of the maps is reduced in the pooling elements.
Convolution Convolution Convolution Fully connected Output
Input and pooling and pooling and pooling layers
Hidden layers Classification
(feature extraction)
Figure 1. A schematic representation of a CNN network (source: Ref. [44]).
Choosing the right depth of the network is a challenging task. In Ref. [44], we assumed
the architecture of the form (see also Ref. [71] for implementation details)
Batch − [Conv − Batch − ReLu] ∗ N − Dense − ReLu − Dense − Batch − So f tMax, (4)
and then performed a random search in the architecture and hyperparameter space in
order to find the optimal model as well as other parameters required to initialize it. Here,
Batch is the batch normalization layer, i.e., a layer performing normalization of the data
(not explicitly shown in Figure 1). Conv and Dense stand for convolution and dense layers,
respectively. ReLu is the abbreviation of the rectified linear unit, which is an activation
function filtering out negative values from the output of the preceding layer. Finally,
So f tMax is the activation function determining the final output of the classifier. We haven’t
used the pooling layers in this model because reducing the spatial size of the 2D trajectories
is usually not necessary. The procedure resulted in a network consisting of six convolutional
layers and two dense ones.
2.3.2. ResNet Architecture
Although the model resulting from the above procedure performed well on our
synthetic data (accuracy at the level of 97%), its architecture was quite complicated and the
network itself was relatively deep, resulting in processing times of the order of days on a
cluster of 24 CPUs with 50 GB total memory. However, long training times were not the
only issue. It is known that with the increasing depth the problem of vanishing/exploding
gradients may appear in the training phase of neural networks. Moreover, the training
error may increase with the number of layers, resulting in a saturation of accuracy [53].
This is the reason why in this paper we decided to use the residual network (ResNet) [53].
It is a class of CNNs, which utilizes shortcuts (skip connections) to jump over several layers
of the networks. Those shortcuts allow the network to make progress even if several layers
have stopped learning because there is one blocking the backpropagation (Figure 2).Entropy 2021, 23, 649 5 of 21
Residual unit
Residual unit
Residual unit
Layer blocking
backpropagation
Layer not learning
Figure 2. A regular CNN (left) versus a Resnet. Thanks to the skip connections in ResNet, the signal
can easily pass a blocking layer in the backpropagation phase.
The residual network may be understood as a stack of residual units, where each
unit is a small neural network with a skip connection. The outline of the unit is shown in
Figure 3. For given input x, the desired mapping we want to obtain by learning is H ( x ).
Since the shortcut connection carries out the input layer to the addition operator shown in
the figure, the rest of the unit needs only to learn the residual mapping F ( x ) = H ( x ) − x.
When a regular CNN network is initialized, its weights are close to zero, so the network just
outputs values close to zero. After adding the shortcuts, the network initially models the
identity function. Therefore, if the target function is close to that function (which is often
the case), the training phase will be significantly shorter than in the case of a regular CNN.
In Figure 4, the actual ResNet architecture is shown. We see that the core of the
network is divided into four stages. Each of them contains, in addition to the residual
units, a downsampling block. Its role is to reduce the information making its way across
the network.
2.3.3. XResNet
In 2018, three modifications to the original ResNet architecture have been proposed
under the common name XResNet [72]. Going into their details is beyond the scope of this
paper. However, since they are known to have a non-negligible effect on the accuracy of
the resulting model in some scenarios, we decided to include them in our search for the
optimal architecture.Entropy 2021, 23, 649 6 of 21
Figure 3. Residual unit in ResNet.
Figure 4. The architecture of ResNet. The downsampling block at the beginning of each stage help to
reduce the amount of information in the case of deeper networks (path B is used in this case).
3. Synthetic and Experimental Data
3.1. Synthetic Training Data
The main factor limiting the deployment of machine learning to trajectory analysis
is the availability of high-quality training data. It should contain a reasonable (i.e., large)
amount of input data (trajectories) and corresponding desired output (their diffusion types).
Since real data from experiments is not really provable (otherwise we would not need any
new classification method), synthetic sets generated with computer simulations of different
diffusion models are used for training. An ML algorithm uses the input–output pairs toEntropy 2021, 23, 649 7 of 21
learn the rules for data processing. Once trained, it is able to use those rules to classify new
unseen trajectories.
As already mentioned in Section 2.2, we decided to follow Refs. [43,44] and use four
basic models of diffusion to generate the training set of trajectories. The simulation methods
will be briefly described in the remaining part of this section.
3.1.1. Normal Diffusion
Although several equivalent methods for simulation of Brownian motion exist, we will
follow the approach presented by Michalet [22]. In case of normal diffusion, the probability
distribution of the displacement’s norm of a particle is given by the Rayleigh distribution
− u2
2u
P(u) = exp , u ≥ 0, (5)
4D∆t 4D∆t
where u is the absolute distance traveled by the particle in time ∆t. Thus, to simulate a
trajectory, we have to randomly choose a start position of a particle and a random direction
of the displacement ϕ and then pick a random step length u from the distribution (5). The
new position of the particle is calculated,
xnew = xold + u cos ϕ, (6)
ynew = yold + u sin ϕ,
and taken as the starting point for the next move. The whole procedure is repeated till a
trajectory of a desired length is generated.
3.1.2. Directed Motion
The simulation algorithm for the Brownian motion may be easily extended to generate
a trajectory for diffusion with drift. All we have to do is simply to add a correction to the
particle’s position due to its active motion:
dxi = v∆t cos β, (7)
dyi = v∆t sin β, (8)
where v is the norm of the drift velocity and β its direction. Once we have the corrections,
we add them to the new coordinates:
xnew = xold + u cos ϕ + dxi , (9)
ynew = yold + u sin ϕ + dyi .
The drift velocity is one of the parameters of the simulation. However, instead of
setting its value directly, we will rather use an active-motion-to-diffusion ratio [43]:
v2 T
R= , (10)
4D
where T is the time duration (i.e., the length of the trajectory). In our simulations, we will
draw a random value of R from a given range and then calculate v for given D and T. In
this way, it will be easier to generate similar trajectories with different values of v and D.
3.1.3. Confined Diffusion
Again, a small modification of the model for normal diffusion is needed to simulate a
particle confined inside a reflective circular boundary. We simply divide every step of the
simulation into 100 substeps with ∆t0 = ∆t/100. Then, a normal diffusion move is carried
out in every substep. The new position of the particle after all substeps will be updated
only if the distance from the center of the boundary to new coordinates is smaller than the
radius rc of the boundary.Entropy 2021, 23, 649 8 of 21
Following Wagner et al. [43], we will introduce a boundedness parameter B, defined as
the area of the smallest ellipse enclosing a normal diffusion trajectory (with no confinement)
divided by the area of the confinement,
Aellipse DN∆t
B= ' . (11)
πrc2 rc2
It will help us to control the level of trapedness of particles in the simulations. B will be set
randomly for each synthetic trajectory. Based on its value, the radius rc will be calculated
for given D, N, and ∆t.
3.1.4. Fractional Brownian Motion
In addition to the confined diffusion, we will also use fractional Brownian motion to
simulate the subdiffusive motion. FBM is the solution of the stochastic differential equation
dXti = σdBtH,i , i = 1, 2, (12)
√
where σ = 2D is the scale parameter related to the diffusion coefficient D, H ∈ (0, 1) is
the Hurst parameter and BtH is a continuous-time, zero-mean Gaussian process starting at
zero, with the following covariance function
1 2H
E BtH BsH = |t| + |s|2H − |t − s|2H . (13)
2
The Hurst parameter H is connected with the anomalous exponent α via the relation
α
H= . (14)
2
Since we want to use FBM for subdiffusion (i.e., α < 1) only, the values of H will be
restricted to the interval (0, 1/2) in the simulations.
3.1.5. Creating Noisy Data
Real measurements of particles’ positions are usually altered by noise from different
sources including localization errors, vibrations of the sample, electronic noise or errors in
the postprocessing phase [73]. Different methods of adding noise to synthetic trajectories
are possible. One can, for instance, vary the diffusion coefficient of particles or simply add
some disturbance to every point of a trajectory. We will go for the latter method and add
normal Gaussian noise with zero mean and standard deviation σ to each simulated position.
To easily generate trajectories characterized by different levels of noise, we will proceed
in the following way. We first introduce the signal-to-noise ratio:
( √
D∆t
√ σ for ND, CD, and FBM,
Q= D∆t+(v∆t)2
(15)
σ for DM.
Then, we will randomly set Q and use the above formula to determine the standard
deviation σ appropriate for given D, ∆t, and v.
3.1.6. Simulation Details
For the sake of comparison, our synthetic data set should resemble all characteristics of
the one used in Ref. [44]. To recap, we generated 20,000 trajectories, 5000 for each diffusion
type. The time lag between consecutive points within a trajectory was set to ∆t = 1/30 s,
which is a typical value in experimental setups. All other parameters of the diffusion
models were chosen randomly from the predefined ranges. Details can be found in Table 1.Entropy 2021, 23, 649 9 of 21
Table 1. Parameters of the simulation and their values. All values except ∆t were randomly chosen
from given ranges.
Parameter Meaning Range of Values
∆t timelag between steps 1/30 [s]
D diffusion coefficient 0.1–20 [µm2 /s]
N length of a trajectory 30–600
B boundedness 1–6
R active motion to diffusion ratio 1–17
α anomalous exponent 0.3–0.7
SNR signal to noise ratio 1–9
The data set was then divided into three subsets: the training set for fitting the machine
learning models, the validation set used to estimate prediction errors for model selection
and the test set for assessment of the final model. The stratified sampling method [74] was
used for that purpose to guarantee a balanced representation of the diffusion modes in the
subsets. Their sizes are presented in Table 2.
Table 2. Partition of the synthetic data set.
Subset Type FBM CD DM ND Size Share
Training 3500 3500 3500 3500 14,000 70%
Validation 750 750 750 750 3000 15%
Test 750 750 750 750 3000 15%
3.2. Real Data
We will apply our classifier to data from a single particle tracking experiment on
G protein-coupled receptors and G proteins, already analyzed in Refs. [38,46,47]. The
receptors mediate biological effects of many hormones and neourotransmitters and are
also important as pharmacological targets [75]. Their signals are transmitted to the cell
interior via interactions with G proteins. The analysis of the dynamics of these two types
of molecules is extremely interesting because it may shed more light on how the receptors
and G proteins meet, interact, and couple.
4. Results
The main goal of this work was to find a deep residual network with the simplest
possible architecture, which is able to detect types of anomalous diffusion with satisfactory
accuracy. In this section, we will first present a series of experiments that allowed us
to significantly reduce the number of parameters of the original ResNet architecture.
Then, we will apply the resulting model to classify both synthetic and real trajectories.
All results were obtained with custom Python codes, available at https://github.com/
milySW/NNResearchAPI, accessed on 20 May 2021. PyTorch library [76] was used to build
the neural networks.
4.1. Finding the Optimal Network Architecture
We performed a series of computer experiments to find a reasonable ResNet architec-
ture. Our goal was to keep the network as small as possible to reduce both the training times
and the danger of overfitting. At the same time, we targeted the classification performance
on synthetic data beyond the accuracy of 90%.
Before we dive into the results of the most important experiments, we would like
to provide one important note. It is usually not worth investing effort and time in more
complicated networks for tiny improvements of accuracy because, due to the stochastic
nature of the networks, even different instances of the same model may yield slightly
different results. Having that in mind, we introduced a (rather arbitrary) threshold equalEntropy 2021, 23, 649 10 of 21
to 0.2 percentage point as an indicator of improvements worth considering. All changes in
accuracy smaller than the threshold were seen as irrelevant.
4.1.1. Impact of XResNet Modifications
Our first attempt was to check if the XResNet modifications [72] to the original
architecture are worth considering. We took ResNet18, i.e., the smallest residual network
with 18 layers, as the starting point. Results are shown in Table 3. Although the original
architecture performs better on the training set, the modified one generalizes better to
unseen data (i.e., has higher accuracy on the validation set). This may indicate the tendency
of ResNet18 to overfit. The cost we have to pay for the improvement in validation accuracy
by 0.34 percentage point is the increase in the number of parameters of the model (by
43,328) and a longer average time needed to complete one epoch (i.e., one cycle through
the training data set). Despite the cost, we will keep the modifications in the model and try
to reduce the number of parameters by other means.
Table 3. Impact of the XResNet modifications [72] on the accuracy of the model. Bold indicates the
architecture we chose for further investigations.
Number of Accuracy Accuracy Epoch Time
Architecture Best Epoch
Parameters (Training) (Validation) [s]
ResNet 11,177,092 93.16% 90.33% 12 40
XResNet 11,220,420 92.19% 90.67% 21 48
4.1.2. Depth of Neural Network
The baseline ResNet architecture consists of four stages, each of which is characterized
by a different number of kernels that are convolved with the input [53]. However, ResNet
was designed for classification of images, which are usually more complex than our
trajectories. Thus, it will be interesting to check how a partial removal of those stages
impacts the accuracy of the classifier. Results of our experiments are shown in Table 4. We
see that reducing the depth of the network leads to a significant decrease in the number of
the parameters in the model and improves its accuracy on the validation data.
Table 4. Relationship between the accuracy of the model and its depth. Depth equal to 3 was chosen
for further investigations.
Number of Accuracy Accuracy Epoch Time
Depth Best Epoch
Parameters (Training) (Validation) [s]
4 11,220,420 92.19% 90.67% 21 48
3 2,823,108 91.32% 91.10% 25 33
2 721,604 90.26% 90.80% 38 28
As expected, one does not need the full depth of the original ResNet architecture
to classify the trajectories. Although the number of the parameters for two stages is
very tempting, we decided to go further with depth 3 because it gives a slightly better
performance.
4.1.3. Dimension and Size of Convolutions
The original Resnet architecture works with 2D objects and uses convolution kernels
of size 3 × 3. It will be interesting to see how the model performs with smaller kernels.
Although a 2 × 2 kernel is theoretically possible, one usually tries to avoid kernels of even
sizes due to the lack of a well defined central pixel. Consequently, we will compare only
1 × 1 kernels with the baseline. As it follows from Table 5, the accuracy of the model
declines significantly with the introduction of the smaller kernels.Entropy 2021, 23, 649 11 of 21
Table 5. Relationship between the size of the 2D convolution kernels and the performance of
the model.
Conv. Number of Accuracy Accuracy Epoch Time
Best Epoch
Kernel Parameters (Training) (Validation) [s]
1×1 357,188 75.95% 76.93% 24 9
3×3 2,823,108 91.32% 91.10% 25 33
There is also a possibility of flattening the trajectories to 1D vectors and convolve them
with 1 × X kernels. We have checked the model for kernels with an odd X ranging from 3
to 11. Results are shown in Table 6. As we can see, those changes could slightly improve
the performance of the model. Moreover, the size of the model was reduced by 44%. Thus,
we will keep 1 × 5 kernels and work with 1D input for further investigations.
Table 6. Relationship between the size of the 1D convolution kernels and the performance of
the model.
Conv. Number of Accuracy Accuracy Epoch Time
Best Epoch
Kernel Parameters (Training) (Validation) [s]
1×3 973,668 92.69% 91.23% 25 39
1×5 1,590,148 92.77% 92.17% 30 24
1×7 2,206,628 90.91% 91.60% 14 28
1×9 2,823,108 93.59% 91.17% 20 30
1 × 11 3,439,588 92.71% 91.70% 15 32
4.1.4. Feature Maps
The number of parameters of the model may also be reduced by limiting its “breadth”,
understood here as the number of feature maps (convolution kernels) at each layer. The
latter for the i-th block is given by the formula:
(
x0 = 64,
(16)
x i = x 0 · 2i − 1 , for i = 1, 2, . . . , n.
From Table 7, it follows that decreasing x0 from 64 to 32 will not significantly decrease
the accuracy of the model, but will reduce the number of parameters by a factor of 4.
Moreover, the learning process of the network takes noticeably less time.
Table 7. Relationship between the number of feature maps and the accuracy of the model.
Number of Accuracy Accuracy
x0 Best Epoch Epoch Time [s]
Parameters (Training) (Validation)
64 1,590,148 92.77% 92.17% 30 24
32 399,556 90.00% 92.00% 9 16
16 100,900 92.29% 91.10% 25 15
4.1.5. Additional Features
One of the advantages of deep networks, at least from the perspective of an end user,
is the ability to work with raw experimental data. There is no need for human-engineered
features as input because the network extracts its own features automatically from the data.
While this is true for ResNet architecture as well, in principle, we could augment the input
to the model by some additional attributes, including the ones tailor-made to the problem
of diffusion.
A set of features with the potential of distinguishing different diffusion modes from
each other was presented in Ref. [44]. Here, we would like to check if adding some of
those attributes to the model will have a positive impact on accuracy. We decided to useEntropy 2021, 23, 649 12 of 21
asymmetry, efficiency, fractal dimension, and TAMSD at lag 20 as additional input (see
Refs. [43,44] for definitions). For each trajectory, the values of the attributes were added to
the network after the raw data went through all convolutional layers and was flattened.
Results of this series of experiments are shown in Table 8. Although the network was
fed with additional information, its accuracy has not improved. To explain that, let us have
a look at the distribution of asymmetry among trajectories in our data set. As it follows
from Figure 5, its values for different types of diffusion overlap to some extent. Thus,
classifying them based on the information encoded in asymmetry may be challenging.
The same holds for the other attributes. Thus, we are not going to include them in our
final model.
Table 8. Impact of additional attributes on the performance of the model.
Number of Accuracy Accuracy Best
Additional Features
Parameters (Training) (Validation) Epoch
None 399,556 90.00% 92.00% 9
Asymmetry 399,560 89.96% 91.03% 15
Efficiency 399,560 91.34% 91.90% 61
Fractal dimension 399,560 91.20% 91.17% 23
TAMSD 399,560 90.54% 91.03% 34
All 399,572 83.82% 83.97% 12
Figure 5. Distribution of asymmetry among trajectories in the synthetic data for different types of diffusion.
4.1.6. Impact of Autocorrelation
Following Ref. [77], we decided to check if the autocorrelation function taken as
additional input improves the accuracy of the model. We combined the raw trajectories
with their autocorrelations calculated at lags 8, 16, and 24 into a single tensor structure and
used it as input to the model. Again, this measure did not improve the accuracy (Table 9).
Table 9. Using autocorrelation function as additional input to the model.
Number of Accuracy Accuracy Best
Autocorrelation
Parameters (Training) (Validation) Epoch
No 399,556 90.00% 92.00% 9
Yes 401,872 91.55% 91.93% 19
4.1.7. Selective Backprop
One of the interesting techniques to accelerate the training of deep neural networks is
the selective backprop [78]. The idea behind this procedure is to prioritize samples with
high loss at each iteration. It uses the output of sample’s forward pass in the training phaseEntropy 2021, 23, 649 13 of 21
to decide whether to use that sample to compute gradients and update parameters of the
model or to skip immediately to other sample.
We carried out an experiment with two selective backprop scenarios. In the first one,
a subset of training data covering 98% of the total loss was chosen for back-propagation. In
this way, only 50–60% of trajectories were used in every epoch to update the network. In
the second scenario, 50% of the training data were always taken, covering between 94%
and 99% of the total loss in each epoch. It turned out that this method indeed shortens the
training phase of the network (in particular average epoch time). However, it yields worse
performance compared to the model utilizing the whole data set for back-propagation
(Table 10).
Table 10. Different scenarios of selective backprop and their impact on the accuracy of the model.
Number of Accuracy Accuracy Epoch Time
Scenario Best Epoch
Parameters (Training) (Validation) [s]
None 399,556 90.00% 92.00% 9 16
98% of cost 399,556 81.81% 90.67% 14 11
50% of cost 399,556 80.57% 90.97% 19 10
4.1.8. Choice of Hyperparameters
In the last series of experiments, we tried to find optimal values of some hyperparam-
eters of the model. First, we looked at the cost function. Its choice allows us to control the
focus in the training phase. Cross entropy for instance strongly penalizes misclassification,
as it grows exponentially while approaching a wrong prediction [79]. Mean squared error
(MSE) is usually used for regression problems. It does not punish wrong classifications
enough, but rather promotes being close to a desired value. Although the cross entropy is
the natural choice in classification tasks, the choice of the cost function seems to have no
significant impact on the model’s validation accuracy (Table 11). We kept MSE for shorter
training times.
Table 11. Impact of cost function on the accuracy of the model.
Cost Function Accuracy (Training) Accuracy (Validation) Best Epoch
Cross-entropy 91.91% 91.97% 26
MSE 90.00% 92.00% 9
An activation function defines the output of a node for the given input. It usually in-
troduces some nonlinearity to the model. We checked four different functions. Sigmoid [80]
is one of the most widely used activation functions today. It nicely mimics the behavior of
real neurons; however, it may suffer from vanishing/exploding gradients. ReLU [81] is
computationally very cheap, but it is also known to “die” in some situations (weights may
update in such a way that the neuron never activates). Leaky ReLU [82] and ELU [83] are
modifications of ReLU that mitigate that problem.
According to Table 12, ReLU activation function offers the highest accuracy on the
validation set.
Table 12. Accuracy of the model for different choices of the activation function.
Activation Function Accuracy (Training) Accuracy (Validation) Best Epoch
Sigmoid 87.65% 85.13% 10
ReLU 90.00% 92.00% 9
LeakReLU 91.50% 91.53% 24
ELU 85.15% 87.20% 3Entropy 2021, 23, 649 14 of 21
The batch size is another important hyperparameter in the model. It defines the
number of samples to work through before the model’s internal parameters are updated.
Larger batches should allow for more efficient computation, but may not generalize well to
unseen data [84]. Small batches, on the other hand, are known to sometimes have problems
with arriving at local minima [79].
Results for three different batch sizes are shown in Table 13—512 turned out to be the
best one in our model.
Table 13. Accuracy of the model for different batch sizes.
Batch Size Accuracy (Training) Accuracy (Validation) Best Epoch
256 89.15% 91.63% 7
512 90.00% 92.00% 9
1024 94.75% 91.37% 23
4.1.9. Resulting Model
Based on the results of the above experiments, we were able to reduce the number
of parameters in the model from 11,220,420 in Resnet18 with XResNet modifications to
399,556. In the same time, the accuracy of the model on validation data increased by 1.33
percentage points.
The architecture of the final model is summarized in Table 14. Besides the already
mentioned parameters and hyperparameters, there are two others that have not been
discussed yet. The activation threshold is a boolean flag telling the model whether it should
automatically estimate the threshold value, above which the neurons become active. In
addition, the learning rate is a tuning parameter that determines the step size at each
iteration while moving toward a minimum of the loss function. To find its value, we
used a finder algorithm proposed in Ref. [85] and implemented in a PyTorch Lightning
module [86].
Table 14. Details of the optimal architecture.
Category Feature Value
XResNet Yes
Dimension 1D
Architecture
Depth 3
Feature map number 32
Additional attributes No
Modifications Autocorrelation No
Filtering No
Conv. kernel 1×5
Cost function MSE
Activation function ReLU
hyperparameters
Batch size 512
Activation threshold Yes
Learning rate 0.0003
4.2. Performance of the Model
A test set consisting of 3000 samples (750 for each diffusion type) was used to assess
the performance of the final model (see Section 3.1.6 for details). In Figure 6, the confusion
matrix of the classifier is shown. By definition, an element Cij of the matrix is equal to the
number of observations known to be in class i (true labels) and predicted to be in class j [87].Entropy 2021, 23, 649 15 of 21
Figure 6. Confusion matrix of the model. Rows correspond to the true labels and columns to the
predicted ones.
The model achieves the best performance for subdiffusion. Only 12 out of 750 trajec-
tories have been wrongly classified in case of FBM and 25 out of 750 in case of CD. The
other two modes are more challenging for the classifier. As for DM, 136 trajectories are
misclassified, most of them as normal diffusion. The performance for the latter is slightly
better—109 trajectories got wrong labels.
In Section 4.1.5, we tried to improve the performance of the model with some addi-
tional human-engineered features, which were motivated by the characteristics of diffusion
itself. We were not really successful because it turned out that the distributions of those
features overlap with each other, particularly for DM and ND, contributing to the confusion
of the classifier. We guess that the same holds for features extracted automatically by the
ResNet model—they are not specific enough to better distinguish DM from ND.
The confusion matrix may be used to calculate the basic performance metrics of the
classifier. They are summarized in Table 15. Accuracy is defined as the number of correct
predictions divided by the total number of predictions. Precision is the fraction of correct
predictions of a class among all predictions of that class. It indicates how often a classifier is
correct if it predicts a given class. Recall is the fraction of correct predictions of a given class
over the total number of samples in that class. It measures the number of relevant results
within a predicted class. Finally, F1 score is the harmonic mean of precision and recall.
Table 15. Basic performance metrics of the model on test data.
Accuracy Precision Recall F1 Score
FBM - 96.98% 98.40% 97.68%
CD - 91.77% 96.67% 94.16%
DM - 92.33% 81.87% 86.78%
ND - 81.76% 85.47% 83.57%
Total/Average 90.6% 90.71% 90.6% 90.55%
Even though the model has apparently some problems with DM and ND classes,
its overall accuracy on test data are high. It returns much more relevant results than the
irrelevant ones (high average precision), and it is able to yield most of the relevant results
(high average recall). The F1 score simply confirms that.
It could be also interesting to check how the performance metrics of the classifier
evolve with the training time (i.e., with the number of epochs). The results are presented in
Figure 7. To generate the plots, we trained 50 instances of the model and then averaged
the metrics. In this way, we could also estimate the 95% confidence levels. We see that all
metrics reach a satisfactory level already in the third epoch. Further training improves the
performance of the model only slightly.Entropy 2021, 23, 649 16 of 21
Figure 7. Performance metrics (on validation data) of the model as functions of the training time.
The same results, but this time broken down into separate diffusion modes, are
shown in Figure 8. The measures for DM and ND are not only smaller than the ones
for subdiffusion, but they also fluctuate to a higher extent when we look at values after
the early epochs. This is due to the fact that these two classes are often confused with
each other.
Figure 8. Performance metrics (on validation data) for each diffusion mode as functions of the training time.
The metrics for individual classes in the best epoch are shown in Figure 9. Again, we
see a small gap between the subdiffusive classes on one hand and the problematic ones
(i.e., DM and ND) on the other. However, even in the worst case, the metrics are above 80%
indicating a good performance of the classifier.Entropy 2021, 23, 649 17 of 21
Figure 9. Performance metrics in the best epoch for each diffusion mode.
4.3. Classification of Real Data
From the available data on G protein-coupled receptors and G proteins, we took into
account only trajectories with at least 50 steps. In this way, the data set was reduced to
1029 G proteins and 1218 receptors. Classification results are shown in Table 16. For the
sake of comparison, two other predictions are reported in the table: a gradient boosting
method utilizing noisy training data and a set of human-engineered features (reduced Set
A trained with noise, see Table 15 in Ref. [47] for details) and a statistical testing procedure
based on the maximum distance traveled by the particle (MAX method, see Refs. [38,46]
for details).
Table 16. Classification of real data: comparison of our model with the feature based ML method
from Ref. [47] (Set A with noise) and the statistical hypothesis testing from Ref. [38,46] (MAX method).
“Rec.” and “G Prot.” stand for G protein-coupled receptors and G proteins, respectively. Due to
rounding, the numbers may not add up precisely to 100%.
Our Model Set A with Noise MAX Method
Rec. G Prot. Rec. G Prot. Rec. G Prot.
Subdiffusion 0% 0.6% 25% 34% 21% 24%
Normal diffusion 70% 65% 72% 58% 79% 76%
Superdiffusion 30% 34.4% 1% 6% 0% 1%
Despite some differences in the absolute numbers, all three methods classify most of
the trajectories as normal diffusion. However, there are significant discrepancies between
them in the classification of the remaining time series. While our method labels almost all
of them as superdiffusion, the other two ones predict subdiffusion in most of the cases.
Unfortunately, the ground-truth for real data are missing and the results cannot be proven.
However, it was already pointed out in Ref. [38] that different classification algorithms may
provide substantially different results for the same data sets. Averaging of the results from
all available methods has been proposed to mitigate the risk of large classification errors.
5. Discussion and Conclusions
Identifying the type of motion of particles in living cells is crucial to deduct their
driving forces and hence to get insight into the mechano-structural characteristics of the
cells. With the development of advanced AI methods in the last decades, there is an
increasing interest to use them for that purpose. These methods are expected to outperform
the well established statistical approach, in particular for noisy and small data sets.Entropy 2021, 23, 649 18 of 21
In this paper, deep residual networks have been used to classify the SPT trajectories.
We started from the well-known ResNet architecture [72], which excels in image classifica-
tion, and carried out a series of numerical experiments to adapt it to detection of diffusion
modes. We managed to find a model that has a better accuracy than the initial network,
but contains only a small fraction of its parameters (399,556 vs. 11,177,092 in ResNet18,
i.e., the smallest among ResNet networks). The reduced number of parameters had a huge
positive impact on the training time of the model. Moreover, the resulting network has less
tendency to overfitting and generalizes better to unseen data.
The overall accuracy of our model on the synthetic test data with noise is pretty good
(90.6%). Breaking down the predictions into individual classes reveals that the model
is able to recognize FBM and confined diffusion with a remarkable accuracy (99.6% and
98.53%, respectively). The detection of normal diffusion and directed motion seems to be
more challenging and the model mixes up those two categories with each other from time
to time.
Regarding the classification of real data, the predictions of our model are a little bit
confusing. Compared to two other methods, i.e., a statistical testing procedure based on
the maximum distance traveled by the particle [38,46] and gradient boosting methods
with a set of tailor-made features characterizing the trajectories [47], it gives a similar
fraction of normal diffusion (the majority class) among the trajectories. However, while
our model classifies the remaining data as superdiffusion, the other ones assign most of
those trajectories to the subdiffusive class. Moreover, it should be mentioned that some
other classifiers provide results different from the ones in Table 16 [38,46]. In light of
the above, the authors in Ref. [38] suggested taking a mean of the results of all available
methods to minimize the risk of large errors. Therefore, there is still need to search for new
classification methods for SPT data.
Author Contributions: Conceptualization, J.S.; methodology, J.S.; software, M.G.; validation, M.G.;
investigation, M.G. and J.S.; writing—original draft preparation, J.S.; writing—review and editing,
M.G. and J.S.; supervision, J.S. Both authors have read and agreed to the published version of the
manuscript.
Funding: This work was partially supported by core funding for statutory R&D activities. J.S. was
also funded by NCN Beethoven Grant No. 2016/23/G/ST1/04083.
Data Availability Statement: Codes required to generate training datasets may be found at https:
//github.com/milySW/NNResearchAPI (accessed on 20 May 2021).
Conflicts of Interest: The authors declare no conflict of interest.
References
1. Geerts, H.; Brabander, M.D.; Nuydens, R.; Geuens, S.; Moeremans, M.; Mey, J.D.D.; Hollenbeck, P. Nanovid tracking: A new
automatic method for the study of mobility in living cells based on colloidal gold and video microscopy. Biophys. J. 1987,
52, 775–782. [CrossRef]
2. Barak, L.; Webb, W. Diffusion of low density lipoprotein-receptor complex on human fibroblasts . J. Cell Biol. 1982, 95, 846–852.
[CrossRef] [PubMed]
3. Kusumi, A.; Sako, Y.; Yamamoto, M. Confined Lateral Diffusion of Membrane Receptors as Studied by Single Particle Tracking
(Nanovid Microscopy). Effects of Calcium-induced Differentiation in Cultured Epithelial Cells. Biophys. J. 1993, 65, 2021–2040.
[CrossRef]
4. Xie, X.S.; Choi, P.J.; Li, G.W.; Lee, N.K.; Lia, G. Single-Molecule Approach to Molecular Biology in Living Bacterial Cells. Annu.
Rev. Biophys. 2008, 37, 417–444. [CrossRef]
5. Alves, S.B.; Oliveira, G.F., Jr.; Oliveira, L.C.; de Silansa, T.P.; Chevrollier, M.; Oriá, M.; Cavalcante, H.L.S. Characterization of
diffusion processes: Normal and anomalous regimes. Physica A 2016, 447, 392–401. [CrossRef]
6. Fick, A. Ueber Diffusion (On Diffusion). Ann. Phys. Chem. 1855, 170, 59–86. [CrossRef]
7. Saxton, M.J.; Jacobson, K. Single-Particle Tracking: Applications to Membrane Dynamics. Annu. Rev. Biophys. Biomol. Struct.
1997, 26, 373–399. [CrossRef] [PubMed]
8. Barkai, E.; Garini, Y.; Metzler, R. Strange kinetics of single molecules in living cells. Phys. Today 2012, 65, 29. [CrossRef]
9. Metzler, R.; Jeon, J.H.; Cherstvy, A.G.; Barkai, E. Anomalous diffusion models and their properties: Non-stationarity, non-
ergodicity, and ageing at the centenary of single particle tracking. Phys. Chem. Chem. Phys. 2014, 16, 24128–24164. [CrossRef]Entropy 2021, 23, 649 19 of 21
10. Metzler, R.; Jeon, J.H.; Cherstvy, A. Non-Brownian diffusion in lipid membranes: Experiments and simulations. Biochim. Biophys.
Acta BBA Biomembr. 2016, 1858, 2451–2467. [CrossRef]
11. Richardson, L.F. Atmospheric Diffusion Shown on a Distance-Neighbour Graph. Proc. R. Soc. Lond. Ser. A 1926, 110, 709–737.
[CrossRef]
12. Goldberg, Y. Primer on Neural Network Models for Natural Language Processing. J. Artif. Intell. Res. 2016, 57, 345–420.
[CrossRef]
13. Bronstein, I.; Israel, Y.; Kepten, E.; Mai, S.; Shav-Tal, Y.; Barkai, E.; Garini, Y. Transient Anomalous Diffusion of Telomeres in the
Nucleus of Mammalian Cells. Phys. Rev. Lett. 2009, 103, 018102. [CrossRef] [PubMed]
14. Jeon, J.H.; Tejedor, V.; Burov, S.; Barkai, E.; Selhuber-Unkel, C.; Berg-Sørensen, K.; Oddershede, L.; Metzler, R. In Vivo Anomalous
Diffusion and Weak Ergodicity Breaking of Lipid Granules. Phys. Rev. Lett. 2011, 106, 048103. [CrossRef]
15. Porto, M.; Bunde, A.; Havlin, S.; Roman, H.E. Structural and dynamical properties of the percolation backbone in two and three
dimensions. Phys. Rev. E 1997, 56, 1667–1675. [CrossRef]
16. Zumofen, G.; Blumen, A.; Klafter, J. Current flow under anomalous-diffusion conditions: Lévy walks. Phys. Rev. A 1990,
41, 4558–4561. [CrossRef]
17. Schaufler, S.; Schleich, W.P.; Yakovlev, V.P. Keyhole Look at Lévy Flights in Subrecoil Laser Cooling. Phys. Rev. Lett. 1999,
83, 3162–3165. [CrossRef]
18. Klafter, J.; White, B.S.; Levandowsky, M. Microzooplankton Feeding Behavior and the Levy Walk. In Biological Motion. Lecture
Notes in Biomathematics; Alt, W., Hoffmann, G., Eds.; Springer: Berlin/Heidelberg, Germnay, 1990; Volume 89.
19. Viswanathan, G.M.; da Luz, M.G.E.; Raposo, E.P.; Stanley, H.E. The Physics of Foraging: An Introduction to Random Searches and
Biological Encounters; Cambridge University Press: Cambridge, UK, 2011. [CrossRef]
20. González, M.C.; Hidalgo, C.A.; Barabási, A.L. Understanding individual human mobility patterns. Nature 2008, 453, 779–782.
[CrossRef]
21. Michael, F.; Johnson, M. Financial market dynamics. Phys. A Stat. Mech. Its Appl. 2003, 320, 525–534. [CrossRef]
22. Michalet, X. Mean square displacement analysis of single-particle trajectories with localization error: Brownian motion in an
isotropic medium. Phys. Rev. E 2010, 82, 041914. [CrossRef]
23. Kneller, G.R. Communication: A scaling approach to anomalous diffusion. J. Chem. Phys. 2014, 141, 041105. [CrossRef] [PubMed]
24. Qian, H.; Sheetz, M.P.; Elson, E.L. Single particle tracking. Analysis of diffusion and flow in two-dimensional systems. Biophys. J.
1991, 60, 910–921. [CrossRef]
25. Gal, N.; Lechtman-Goldstein, D.; Weihs, D. Particle tracking in living cells: A review of the mean square displacement method
and beyond. Rheol. Acta 2013, 52, 425–443. [CrossRef]
26. Kepten, E.; Weron, A.; Sikora, G.; Burnecki, K.; Garini, Y. Guidelines for the Fitting of Anomalous Diffusion Mean Square
Displacement Graphs from Single Particle Tracking Experiments. PLoS ONE 2015, 10, e0117722. [CrossRef] [PubMed]
27. Briane, V.; Kervrann, C.; Vimond, M. Statistical analysis of particle trajectories in living cells. Phys. Rev. E 2018, 97, 062121.
[CrossRef] [PubMed]
28. Saxton, M.J. Lateral diffusion in an archipelago. Single-particle diffusion. Biophys. J. 1993, 64, 1766–1780. [CrossRef]
29. Valentine, M.T.; Kaplan, P.D.; Thota, D.; Crocker, J.C.; Gisler, T.; Prud’homme, R.K.; Beck, M.; Weitz, D.A. Investigating the
microenvironments of inhomogeneous soft materials with multiple particle tracking. Phys. Rev. E 2001, 64, 061506. [CrossRef]
30. Gal, N.; Weihs, D. Experimental evidence of strong anomalous diffusion in living cells. Phys. Rev. E 2010, 81, 020903. [CrossRef]
31. Raupach, C.; Zitterbart, D.P.; Mierke, C.T.; Metzner, C.; Müller, F.A.; Fabry, B. Stress fluctuations and motion of cytoskeletal-bound
markers. Phys. Rev. E 2007, 76, 011918. [CrossRef]
32. Burov, S.; Tabei, S.M.A.; Huynh, T.; Murrell, M.P.; Philipson, L.H.; Rice, S.A.; Gardel, M.L.; Scherer, N.F.; Dinner, A.R. Distribution
of directional change as a signature of complex dynamics. Proc. Natl. Acad. Sci. USA 2013, 110, 19689–19694. [CrossRef]
[PubMed]
33. Tejedor, V.; Bénichou, O.; Voituriez, R.; Jungmann, R.; Simmel, F.; Selhuber-Unkel, C.; Oddershede, L.B.; Metzler, R. Quantitative
Analysis of Single Particle Trajectories: Mean Maximal Excursion Method. Biophys. J. 2010, 98, 1364–1372. [CrossRef] [PubMed]
34. Burnecki, K.; Kepten, E.; Garini, Y.; Sikora, G.; Weron, A. Estimating the anomalous diffusion exponent for single particle tracking
data with measurement errors—An alternative approach. Sci. Rep. 2015, 5, 11306. [CrossRef] [PubMed]
35. Das, R.; Cairo, C.W.; Coombs, D. A Hidden Markov Model for Single Particle Tracks Quantifies Dynamic Interactions between
LFA-1 and the Actin Cytoskeleton. PLoS Comput. Biol. 2009, 5. [CrossRef] [PubMed]
36. Slator, P.J.; Cairo, C.W.; Burroughs, N.J. Detection of Diffusion Heterogeneity in Single Particle Tracking Trajectories Using a
Hidden Markov Model with Measurement Noise Propagation. PLoS ONE 2015, 10, e0140759. [CrossRef] [PubMed]
37. Slator, P.J.; Burroughs, N.J. A Hidden Markov Model for Detecting Confinement in Single-Particle Tracking Trajectories. Biophys.
J. 2018, 115, 1741–1754. [CrossRef] [PubMed]
38. Weron, A.; Janczura, J.; Boryczka, E.; Sungkaworn, T.; Calebiro, D. Statistical testing approach for fractional anomalous diffusion
classification. Phys. Rev. E 2019, 99, 042149. [CrossRef] [PubMed]
39. Grebenkov, D.S. Optimal and suboptimal quadratic forms for noncentered Gaussian processes. Phys. Rev. E 2013, 88, 032140.
[CrossRef] [PubMed]
40. Monnier, N.; Guo, S.M.; Mori, M.; He, J.; Lénárt, P.; Bathe, M. Bayesian Approach to MSD-Based Analysis of Particle Motion in
Live Cells. Biophys. J. 2012, 103, 616–626. [CrossRef]Entropy 2021, 23, 649 20 of 21
41. Thapa, S.; Lomholt, M.A.; Krog, J.; Cherstvy, A.G.; Metzler, R. Bayesian analysis of single-particle tracking data using the
nested-sampling algorithm: Maximum-likelihood model selection applied to stochastic-diffusivity data. Phys. Chem. Chem. Phys.
2018, 20, 29018–29037. [CrossRef]
42. Cherstvy, A.G.; Thapa, S.; Wagner, C.E.; Metzler, R. Non-Gaussian, non-ergodic, and non-Fickian diffusion of tracers in mucin
hydrogels. Soft Matter 2019, 15, 2526–2551. [CrossRef]
43. Wagner, T.; Kroll, A.; Haramagatti, C.R.; Lipinski, H.G.; Wiemann, M. Classification and Segmentation of Nanoparticle Diffusion
Trajectories in Cellular Micro Environments. PLoS ONE 2017, 12, e0170165. [CrossRef]
44. Kowalek, P.; Loch-Olszewska, H.; Szwabiński, J. Classification of diffusion modes in single-particle tracking data: Feature-based
versus deep-learning approach. Phys. Rev. E 2019, 100, 032410. [CrossRef]
45. Muñoz-Gil, G.; Garcia-March, M.A.; Manzo, C.; Martín-Guerrero, J.D.; Lewenstein, M. Single trajectory characterization via
machine learning. New J. Phys. 2020, 22, 013010. [CrossRef]
46. Janczura, J.; Kowalek, P.; Loch-Olszewska, H.; Szwabiński, J.; Weron, A. Classification of particle trajectories in living cells:
Machine learning versus statistical testing hypothesis for fractional anomalous diffusion. Phys. Rev. E 2020, 102, 032402.
[CrossRef]
47. Loch-Olszewska, H.; Szwabiński, J. Impact of feature choice on machine learning classification of fractional anomalous diffusion.
Entropy 2020, 22, 1436. [CrossRef]
48. Dosset, P.; Rassam, P.; Fernandez, L.; Espenel, C.; Rubinstein, E.; Margeat, E.; Milhiet, P.E. Automatic detection of diffusion modes
within biological membranes using backpropagation neural network. BMC Bioinform. 2016, 17, 197. [CrossRef]
49. Granik, N.; Weiss, L.E.; Nehme, E.; Levin, M.; Chein, M.; Perlson, E.; Roichman, Y.; Shechtman, Y. Single-Particle Diffusion
Characterization by Deep Learning. Biophys. J. 2019, 117, 185–192. [CrossRef]
50. Bo, S.; Schmidt, F.; Eichhorn, R.; Volpe, G. Measurement of anomalous diffusion using recurrent neural networks. Phys. Rev. E
2019, 100, 010102. [CrossRef]
51. Gentili, A.; Volpe, G. Characterization of anomalous diffusion statistics powered by deep learning. arXiv 2021, arXiv:2102.07605.
52. Muñoz-Gil, G.; Volpe, G.; García-March, M.A.; Metzler, R.; Lewenstein, M.; Manzo, C. The anomalous diffusion challenge: Single
trajectory characterisation as a competition. In Proceedings of the Emerging Topics in Artificial Intelligence 2020, Halkidiki,
Greece, 5–7 June 2020. [CrossRef]
53. He, K.; Zhang, X.; Ren, S.; Sun, J. Deep Residual Learning for Image Recognition. In Proceedings of the 2016 IEEE Conference on
Computer Vision and Pattern Recognition (CVPR), Las Vegas, NV, USA, 27–30 June 2016; pp. 770–778. [CrossRef]
54. Hatami, N.; Gavet, Y.; Debayle, J. Classification of Time-Series Images Using Deep Convolu- tional Neural Networks. In
Proceedings of SPIE, Tenth International Conference on Machine Vision (ICMV 2017); Verikas, A., Radeva, P., Nikolaev, D., Zhou, J.,
Eds.; SPIE Publications: Bellingham WA, USA, 2018; p. 10696.
55. Ye, K.; Kovashka, A.; Sandler, M.; Zhu, M.; Howard, A.; Fornoni, M. SpotPatch: Parameter-Efficient Transfer Learning for
Mobile Object Detection. In Computer Vision—ACCV 2020; Ishikawa, H., Liu, C.L., Pajdla, T., Shi, J., Eds.; Springer International
Publishing: Cham, Switzerland, 2021; pp. 239–256.
56. Guo, Y.; Li, Y.; Wang, L.; Rosing, T. Depthwise Convolution Is All You Need for Learning Multiple Visual Domains. In Proceedings
of the AAAI Conference on Artificial Intelligence, Honolulu, HI, USA, 27 January–1 February 2019; Volume 33, pp. 8368–8375.
[CrossRef]
57. Guo, Y.; Shi, H.; Kumar, A.; Grauman, K.; Rosing, T.; Feris, R. SpotTune: Transfer Learning Through Adaptive Fine-Tuning. In
Proceedings of the IEEE/CVF Conference on Computer Vision and Pattern Recognition (CVPR), Long Beach, CA, USA, 15–20
June 2019.
58. Mudrakarta, P.K.; Sandler, M.; Zhmoginov, A.; Howard, A.G. K For The Price Of 1: Parameter Efficient Multi-task In addition,
Transfer Learning. arXiv 2018, arXiv:1810.10703.
59. Bressloff, P.C. Stochastic Processes in Cell Biology; Literaturverz, S., Ed.; Interdisciplinary Applied Mathematics; Springer: Cham,
Switzerland, 2014; pp. 645–672.
60. Weiss, M.; Elsner, M.; Kartberg, F.; Nilsson, T. Anomalous Subdiffusion Is a Measure for Cytoplasmic Crowding in Living Cells.
Biophys. J. 2004, 87, 3518–3524. [CrossRef] [PubMed]
61. Saxton, M.J. Single-particle tracking: Models of directed transport. Biophys. J. 1994, 67, 2110–2119. [CrossRef]
62. Berry, H.; Chaté, H. Anomalous diffusion due to hindering by mobile obstacles undergoing Brownian motion or Orstein-
Ulhenbeck processes. Phys. Rev. E 2014, 89, 022708. [CrossRef] [PubMed]
63. Metzler, R.; Klafter, J. The random walk’s guide to anomalous diffusion: A fractional dynamics approach. Phys. Rep. 2000,
339, 1–77. [CrossRef]
64. Hoze, N.; Nair, D.; Hosy, E.; Sieben, C.; Manley, S.; Herrmann, A.; Sibarita, J.B.; Choquet, D.; Holcman, D. Heterogeneity of
AMPA receptor trafficking and molecular interactions revealed by superresolution analysis of live cell imaging. Proc. Natl. Acad.
Sci. USA 2012, 109, 17052–17057. [CrossRef]
65. Arcizet, D.; Meier, B.; Sackmann, E.; Rädler, J.O.; Heinrich, D. Temporal Analysis of Active and Passive Transport in Living Cells.
Phys. Rev. Lett. 2008, 101, 248103. [CrossRef] [PubMed]
66. Ruan, G.; Agrawal, A.; Marcus, A.I.; Nie, S. Imaging and Tracking of Tat Peptide-Conjugated Quantum Dots in Living Cells:
New Insights into Nanoparticle Uptake, Intracellular Transport, and Vesicle Shedding. J. Am. Chem. Soc. 2007, 129, 14759–14766.
[CrossRef]You can also read