CY 2020 - Delaware Department of Transportation
←
→
Page content transcription
If your browser does not render page correctly, please read the page content below

CY 2020
Table of Contents
Introduction…………………………………………………………………………                          2

Executive Summary…………………………………………………………............               3

Crash Data Analysis………………………………………………………………...                    4-5

Data Method Technology…………………………………………………………...                   6

Supporting Contractor………………………………………………………………                     6

Camera Locations…………………………………………………………………..                       7-8

Violations…………………………………………………………………………..                          9 - 10

Revenue / Expenses………………………………………………………………...                     11 - 12

Court Data………………………………………………………………………….                           13

Affidavits…………………………………………………………………………..                          13

Delinquent Fine Payments………………………………………………………….                   13

2020 Recommendations……………………………………………………. ………                     14

Appendix …………………………………………………………………………...                          15

    Figure 1:   Total Crashes Per Year …….……………………………….           16

    Figure 2:   Angle Crashes Per Year ……………………………………..           17

    Figure 3:   Red Light Running Crashes Per Year ……………………….     18

    Figure 4:   Rear End Crashes Per Year ………………………………….          19

    Figure 5:   Intersection Selection Process……………………………….       20 - 21

                                                                1|P a ge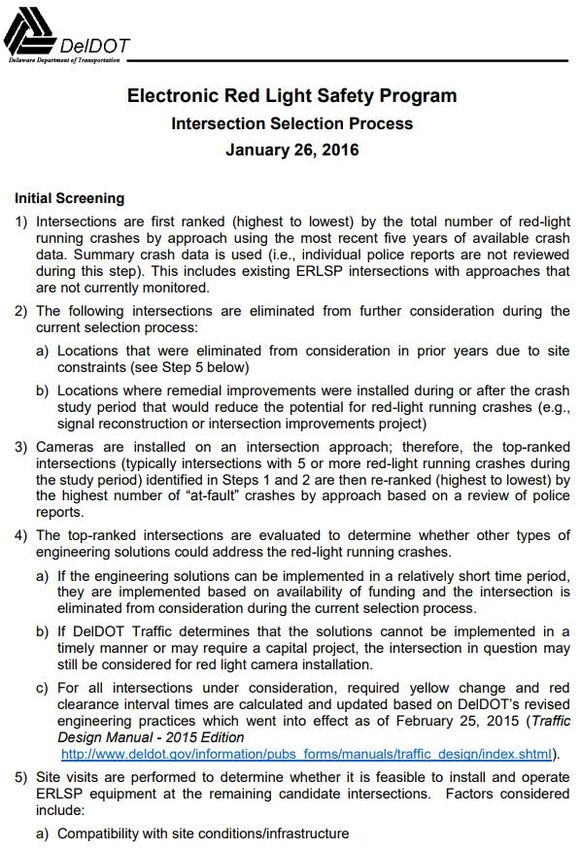
Introduction
In accordance with Section 105 of Senate Bill 180 of the 150th General Assembly of the
State of Delaware, the Department of Transportation (DelDOT) hereby acknowledges the directive
to continue operations of the Electronic Red Light Safety Program on an open-ended basis under
specified conditions. For calendar year 2020, the conditions are as follows:
a.) The program shall continue to use recognized safety and crash criteria in determining
whether and where to add any new enforcement locations to this program. Prior to any new
locations, the incumbent state senator and representative for the districts in which such
locations are proposed, shall be notified prior to installation.
b.) To assure integrity and propriety, no person involved in the administration or enforcement
of this program shall own any interest or equity in the vendor used by the Department to
support the administrative elements of the program. Any such person with an ownership
or equity interest in such vendor must divest from the ownership or investment no later
than ninety days after the effective date of this act. This restriction applies to anyone with
either direct involvement in administering or enforcing this program and those in any
supervisory capacity above such persons.
DelDOT’s number one priority is the safety of all users, motorists, bicyclists and
pedestrians on our roads. Our research shows the Electronic Red Light Safety Program (ERLSP)
has greatly reduced the combined total number of red light running and angle crashes at red light
monitored intersections since its inception. Red light running continues to be a serious traffic
safety issue nationwide. According to the Insurance Institute for Highway Safety (IIHS):
Red light runners cause hundreds of deaths and tens of thousands of injuries each year. In
2018, 846 people were killed and an estimated 139,000 people were injured in crashes that
involved red light running nationally.
A 2016 IIHS study comparing large cities with red light cameras to those without red light
cameras found the devices reduced the fatal red light running crash rate by 21 percent and
the rate of all types of fatal crashes at signalized intersections by 14 percent.
An IIHS study of urban crashes found that those involving drivers who ran red lights, stop
signs and other traffic controls were the most common type of crash (22 percent). Injuries
occurred in 39 percent of the crashes in which motorists ran traffic controls.
2|P a ge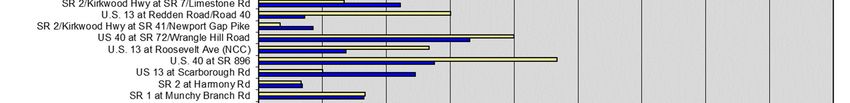
Executive Summary

        The Electronic Red Light Safety Program (ERLSP) is an electronic monitoring system
located at 46 qualifying intersections across the State of Delaware. The current camera locations
met eligibility having historically high incidences of red light running related crashes.

        The technology for electronic enforcement utilizes a specialized camera, coupled with a
traffic signal. The device detects the movement of vehicles into intersections after the
corresponding signal display turns red. The camera photographs the violator’s license plate to
identify the vehicle. Using this information, a violation notice is generated and sent to the
registered owner of the vehicle.

        Title 21 §4101(d) allows the Department of Transportation and/or the governing body of
any city or county to install and operate traffic light signal violation monitoring systems and assess
fines accordingly. In 2016, this section was amended to state that in the event cameras were
installed by jurisdictions other than the Department of Transportation, that DelDOT must first
approve such installation using the same recognized safety and crash criteria used to determine
DelDOT’s new locations.

       Any existing location erected without prior DelDOT approval that fails to meet the safety
and crash criteria shall be removed upon end of the contract with the camera operator vendor. In
2019, the City of Wilmington’s proposed installations and decommissions list was reviewed by
the Department and approved.

        In addition, jurisdictions operating an Electronic Red Light Safety Program can only issue
right turn on red violations if there is safety and crash data to support it as determined by the
Department of Transportation.

        All intersections using a traffic control photographic system or other traffic light signal
violation monitoring system must adhere to the exact duration of the yellow light change interval.
This time-period must be no less than the yellow light change interval duration specified in the
design manual developed by the Department of Transportation.

        Title 21 exclusively directs DelDOT to identify intersections with high crash incidents as
potential candidates for the placement of electronic red light camera systems. In addition, DelDOT
must qualify the engineering of any new cameras installed. The Department also manages the
contractual obligations of the private company(s) through which the camera systems are installed
and maintained, and through which violations are captured, processed, and collected.

        Title 2 Transportation, Delaware Administrative Code; Section 1200 Office of Highway
Safety, Section 1205, Electronic Red Light Safety Program regulations became effective in 2005,
in accordance with Title 21.

                                                                                           3|P a ge
Crash Data Analysis
DelDOT’s statewide Electronic Red Light Safety Program (ERLSP) has resulted in
significant reductions in crashes, specifically angle crashes, which are typically the most severe
types of crashes. Analysis was performed to compare crash data before and after the installation
of cameras at all 46 intersections equipped with enforcement technology. Crash data was reviewed
for a three-year “before” period and an “after” period beginning following the installation of the
cameras. The average “after” period was approximately 14 years for Phase 1 intersections and 4
years for Phase 2 intersections. The following types of crashes were reviewed for the “before” and
“after” periods:
Total crashes include all crashes occurring within the vicinity of the intersection.
Angle crashes include right angle crashes, as well as left-turn crashes caused by motorists
proceeding through a red light. Crashes caused by motorists turning left on a “permissive”
signal indication (i.e., a circular green or flashing red arrow) are not included in this
analysis.
Red light running crashes include crashes where a law enforcement officer cited at least
one driver for disregarding a traffic signal.
Rear end crashes include crashes when the rear vehicle fails to stop and strikes the front
vehicle. This includes rear end crashes that occur at the onset of the yellow and red intervals
as well as rear end crashes that occur at the back of a queue of standing vehicles that
frequently occur several seconds following the change to a red signal indication.
Crash data was reviewed at the 46 ERLSP intersections to determine the overall change in
crashes for the four crash types. The following is a summary of the results:
Total crashes increased by 6% in the “after” period
Angle crashes reduced by 44% in the “after” period
Red light running crashes reduced by 31% in the “after” period
Rear end crashes increased by 12% in the “after” period
As demonstrated by the significant reduction in angle and red light running crashes, the safety
benefits of the ERLSP continue to be realized by the traveling public. As the duration of the “after”
evaluation period continues to expand, the results of the “before” and “after” studies will become
more statistically reliable. As such, DelDOT will continue to monitor crash data at the locations
equipped with enforcement technology.
SEE APPENDIX for charts detailing the average number of crashes for the four crash types at
each of the 46 intersections with enforcement technology.
4|P a ge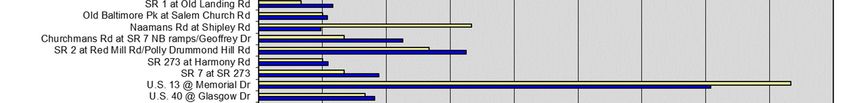
Additionally, “before” and “after” crash severity rates were compared at the Phase 2
intersections. Crash data by crash type, as reported above and in each previous Program Report,
has suggested that more severe crash types (angle/red light running) are significantly reduced,
while typically-less-severe crash types (rear end) may see moderate increases as a result of
monitoring. Improved crash reporting technology and data availability allow crash severity to be
explicitly reviewed for the Phase 2 intersections based on the FHWA’s KABCO Injury
Classification Scale. Table I depicts this comparison for crashes involving each severity category
(crashes were classified by the worst-case severity occurring as a result of the crash).
Table I: Before/After Crash Severity Rate Comparison for Phase 2 Intersections
Crash Severity1 Rates per Year
Inter- Data Total 1
Period Legend:
sections Years Years K A B C O U K: Fatal Injury
A: Suspected Serious Injury
Before 16 3.00 48.00 0.04 0.33 2.69 1.08 16.27 1.58 B: Suspected Minor Injury
After 16 3.54 -4.10 61.38 0.00 0.11 2.12 1.47 15.87 2.25 C: Possible Injury
O: Property Damage Only
Average Annual Reduction 0.04 0.22 0.57 -0.38 0.40 -0.66
U: Unknow n
Percent Reduction 100% 66% 21% -35% 2% -42%
The crash severity comparison for the Phase 2 intersections illustrates that the three most-
severe crash categories experienced rate reductions from the “before” period to the “after” period.
The three least-severe crash categories did show a moderate increase in crash rate. The following
is a summary of the results:
Fatal crashes reduced by 100% in the “after” period
Suspected serious injury crashes reduced by 66% in the “after” period
Suspected minor injury crashes reduced by 21% in the “after” period
Possible injury crashes increased by 35% in the “after” period
Property damage only and unknown severity crashes increased by 2% (weighted) in the
“after” period
5|P a ge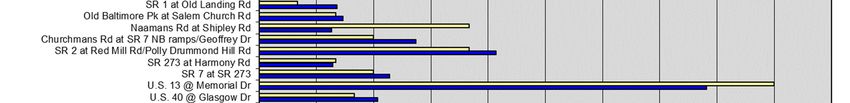
Data Method Technology

        In 2010, the Delaware Criminal Justice Information System (DelJIS) implemented a new
crash reporting system called E-Crash. In response to E-Crash, DelDOT implemented Crash
Analysis Reporting System (CARS). E-Crash generates latitude and longitude coordinates when
law enforcement officers identify the location of crashes in the field. These coordinates in addition
to other elements and attributes of the crash report are then communicated to DelDOT for inclusion
in CARS. This process results in a more accurate method of establishing the location of crashes
and provides more complete crash data. Data for the CY 2010 through CY 2020 Program Reports
was acquired using CARS to document the crash benefits of the ERLSP. As such, data included
during that time period is determined through a more accurate and complete reporting
methodology.
        As noted above, the new CARS system has resulted in a more complete and accurate crash
reporting system. This new system has been in use since 2010 (approximately ten years) and
contains crash data from 2005 through present. Crash data from 2005 through 2009 was migrated
from the former crash system into the new CARS system. However, the “before” periods for the
first camera installations begin as early as 2001. Therefore, it is not feasible to obtain complete
“before” and “after” crash data entirely from the new CARS system. Combining data between the
former crash reporting system and the new CARS system may show an increasing trend in overall
crashes as a result of the more complete data system. This may instead be the result of a more
accurate and complete reporting system. This trend is likely to be more significantly observed in
the review of “total” and “rear end” crashes, which are typically less severe compared to “angle”
crashes. DelDOT will continue to monitor the impact that the new crash reporting system has on
the “before” and “after” crash results.

                                     Supporting Contractor

       DelDOT operates the Electronic Red Light Safety Program with the vendor, Conduent
(formerly Xerox). Conduent has managed the State’s program since 2014.

                                                                                          6|P a ge
Camera Locations
Throughout the State, 102 DelDOT ERLSP cameras are positioned at 46 signalized
intersections. The ERLSP has operating agreements with four local jurisdictions – the City of
Dover, City of Newark, City of Seaford, and the Town of Elsmere. These agreements allow the
Department to place cameras at locations within municipal areas. Base fine revenue collected
from municipal violations is passed to the appropriate jurisdiction. Local police personnel review
recorded red light running events, which occur within municipal areas.
The Department in conjunction with the Delaware State Police (DSP) administers areas
not included within the four incorporated locations. DSP is responsible for reviewing all non-
municipal violations. The entire list of the Department’s red light enforcement camera locations
follows:
New Castle County:
Old Baltimore Pike at Salem Church Road/Salem Woods Drive
Route 2 at Harmony Road
Route 2 at Red Mill Road/Polly Drummond Hill Road
Route 2 at Route 41
Route 2 at Route 7
Route 4 at Marrows Road
Route 4 at Route 72
Route 4 at Salem Church Road
Route 58/Churchmans Road at Route 1 NB Ramps
Route 58/Churchmans Road at I-95 Ramps
Route 58/Churchmans Road at I-95 SB Off-ramp
Route 72 at Kenmar Drive
Route 92/Naamans Road at Shipley Road/Brandywine Parkway
Route 141 at Route 34
Route 141 at West Park Drive
Route 273 at Harmony Road/Gerald Drive
Route 273 at Route 1
Route 273 at Route 7
U.S. 13 at Roosevelt Avenue
U.S. 13 at Boulden Boulevard
U.S. 13 at Memorial Drive
U.S. 40 at Eden Square
U.S. 40 at Glasgow Drive
U.S. 40 at Governors Square
U.S. 40 at Route 72
U.S. 40 at Route 896
U.S. 40 at Scotland Drive
U.S. 202 at Route 92
U.S. 202 at Silverside Road
7|P a ge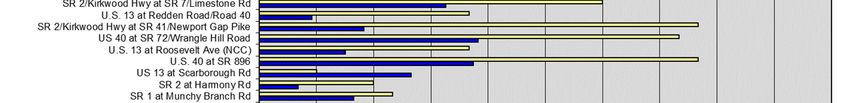
U.S. 301 at Summit Village
Sussex County:
Route 1 at Munchy Branch Road/Miller Road
Route 1 at Old Landing Road
Route 1 at U.S. 9
U.S. 13 at Road 40/Redden Road
U.S. 113 at Route 20
City of Newark (Enforced by Newark Police):
Elkton Road at Route 4
Route 896 at Route 4
Town of Elsmere (Enforced by Elsmere Police):
Route 2 at Dupont Road
City of Dover (Enforced by Dover Police):
Governor's Avenue at North Street
U.S. 13 at Division Street/Route 8
U.S. 13 at Kings Highway/White Oak Road
U.S. 13 at Loockerman Street
U.S. 13 at Roosevelt Avenue
U.S. 13 at Scarborough Road
U.S. 13 at Webbs Lane
City of Seaford (Enforced by Seaford Police):
U.S. 13 at Tharp Road
8|P a ge
Violations

      The violation fine for the ERLSP is $137.50. This amount is calculated using three
components: a base fine of $75.00, a surcharge of $37.50, a $10.00 assessment for the Volunteer
Ambulance Company Fund, and a $15.00 assessment for the Fund to Combat Violent Crimes.

       The $75.00 fee is authorized under Title 21 §4101 (d) (2).

        The $37.50 surcharge originates from Title 11. Title 11 Delaware Code §4101 requires
any fines or fees levied for violations of Title 21 (such as red light camera enforcement violations)
include an additional 50% surcharge. In the case of the ERLSP, the additional 50% charge equals
$37.50.

       In accordance with 11 Del.C. Section 4101(j), a $10.00 assessment is placed on all Title
21 violations for the Volunteer Ambulance Company Fund. This assessment became effective in
December 2014. All funds collected from this assessment are transferred to this fund.

       In accordance with 11 Del.C. Section 4101(h), a $15.00 assessment is placed on all Title
21 violations for the Fund to Combat Violent Crimes. This assessment became effective in July
2015. All funds collected from this assessment are transferred to this fund.

        The 2011 General Assembly passed legislation allowing both the state and municipalities
to increase their red light violation base fines to $110.00. The Department of Transportation has
elected not to increase the fine from its $75.00 base.

        Under the State of Delaware’s ERLSP, violation notices are sent directly to the registered
owner of the vehicle. Unlike traditional violations cited by a police officer, the camera violations
are considered a civil offense and not a criminal offense. Because of this, the violation and fine
do not affect the motorist’s insurance rate or accumulate points on their driving record. Unpaid
violations are subject to restrictions on renewal at time of vehicle registration. If delinquent, the
Department increases the fine by $10.00 for each 30-day period past the event, up to $30.00 for 90
days.

        In calendar year 2020, 58,604 Notices of Civil Violations were issued for red light running.
This is a decrease of 20.37% from calendar year 2019, when 73,595 violations were distributed.

                                                                                          9|P a ge
Table II: Comparison of Violations from 2016 to 2020
Table III: Comparison of Violations from 2016 to 2020 by Jurisdiction
10 | P a g eRevenue / Expenses
Although the ERLSP’s priority is safety and not revenue generation, the program does
produce more money than it costs to operate. The total receipts collected through the program in
calendar year 2020 were $7,104,990.18.
Table IV: Comparison of Revenue/Expenses from 2016 to 2020
11 | P a g eTable V: Comparison of Revenue/Expenses from 2016 to 2020 Combined and by
Jurisdiction
CY 2020 Electronic Red Light Safety Program Report
Comparison of Revenue/Expenses from 2016 to 2020 Combined and by Jurisdiction
Total Income Conduent Additional Total Program Total Expected
Year Collected Expenses Expenses Net Income Year Citations Income
2016 $ 5,171,634.75 $ 2,944,628.45 $ 1,132,759.51 $ 1,094,246.79 2016 50,218 $ 6,151,705.00
2017 $ 9,147,814.70 $ 4,708,205.09 $ 1,816,210.24 $ 2,623,399.37 2017 83,592 $ 9,404,100.00
2018 $ 9,398,189.43 $ 4,915,623.67 $ 282,123.92 $ 4,200,441.84 2018 76,079 $ 8,558,887.50
2019 $ 8,915,108.85 $ 4,873,120.94 $ 288,810.06 $ 3,753,177.85 2019 73,595 $ 8,279,437.50
2020 $ 7,104,990.18 $ 4,623,022.60 $ 349,836.52 $ 2,132,131.06 2020 58,604 $ 6,592,950.00
State Elsmere
Year Income Expense Net Year Income Expense Net
2016 $ 3,078,694.24 $ 3,061,620.96 $ 537,725.78 2016 $ 16,821.50 $ 47,916.00 $ (31,094.50)
2017 $ 6,935,305.05 $ 4,881,137.83 $ 2,054,167.22 2017 $ 10,324.00 $ 47,157.00 $ (36,833.00)
2018 $ 7,238,157.70 $ 3,746,316.00 $ 3,491,841.70 2018 $ 9,987.00 $ 46,987.50 $ (37,000.50)
2019 $ 6,986,120.45 $ 3,650,170.50 $ 3,335,949.95 2019 $ 7,802.50 $ 46,100.50 $ (38,298.00)
2020 $ 5,476,409.90 $ 3,623,161.27 $ 1,853,248.63 2020 $ 10,071.00 $ 47,036.00 $ (36,965.00)
Dover Newark
Year Income Expense Net Year Income Expense Net
2016 $ 1,513,994.76 $ 1,066,681.50 $ 447,313.26 2016 $483,533.00 $300,397.00 $ 183,136.00
2017 $ 1,677,401.63 $ 1,169,760.00 $ 507,641.63 2017 $435,189.43 $289,300.50 $ 145,888.93
2018 $ 1,635,236.57 $ 1,140,312.00 $ 494,924.57 2018 $434,155.16 $288,291.00 $ 145,864.16
2019 $ 1,532,868.65 $ 1,100,077.50 $ 432,791.15 2019 $321,206.50 $238,611.00 $ 82,595.50
2020 $ 1,283,924.53 $ 968,251.10 $ 315,673.43 2020 $278,460.50 $213,512.50 $ 64,948.00
Seaford
Year Income Expense Net
2016 $ 78,591.25 $ 121,425.00 $ (42,833.75)
2017 $ 89,594.59 $ 137,060.00 $ (47,465.41)
2018 $ 80,653.00 $ 132,320.50 $ (51,667.50)
2019 $ 67,110.75 $ 126,971.50 $ (59,860.75)
2020 $ 56,124.25 $ 120,898.25 $ (64,774.00)
The expenses of the program for Conduent (formerly Xerox) are deducted from the gross
receipts prior to the distribution of revenue to our jurisdictions. Additional expenses include, DSP,
Whitman, Requardt & Associates, LLP (WRA) for engineering support, and refunds – not passed
on to the jurisdictions.
For intersections in which revenue does not cover the cost of the cameras and other
operational costs, expenses are paid from the State’s revenue.
12 | P a g eCourt Data
In calendar year 2020, of the 58,604 violations, 515 cases were scheduled for trial. Of
these, 455 were upheld by the court and 60 were dismissed. When appeals do occur, most are
settled prior to a court hearing. This is largely due to the quality of evidence collected.
Affidavits
Under 21 Del. Code §4101 (d) (9), Delaware law permits a registered vehicle owner to
divert responsibility for a video offense if another driver was operating their vehicle at the time
the violation occurred. If a registered owner identifies another driver as the violator on the
affidavit, the identified driver has the same legal options the registered owner had originally – to
accept responsibility and pay the fine or to challenge the allegation in Court.
Should the identified driver opt to challenge the allegation, the prosecution must subpoena
the registered owner to Court. This allows a judge to hear from both the registered owner and the
identified driver as to who may be responsible for the violation.
Delinquent Fine Payments
For every 30 days that an ERLSP violation remains unpaid after the due date, the fine
increases by $10. After 90 days of non-payment, the fine is capped at $167.50. The fine becomes
delinquent after it is 120 days overdue.
The number of delinquencies in calendar year 2020 was 16,039 out of 58,604 violations
processed, totaling $2,597,109. Currently, there are 89,273 outstanding violations from a 10-year
period, totaling $13,852,336 in outstanding fines due to the Department. Approximately 64% of
the violations are from in-state registered vehicles. Maryland tags accounted for 8,211 (9%) of
outstanding violations, New Jersey tags equaled 4,191 (5%) of outstanding violations and
Pennsylvania tags accounted for 10,727 (12%) of outstanding violations.
If the in-state owner of a vehicle ignores the court-ordered fine, the Division of Motor
Vehicle (DMV) puts a hold on vehicle registration renewals.
The Department contracts with Conduent State & Local Solutions for delinquent fee
collections. As of December 2020, Conduent State & Local Solutions collected funds for 42,151
violations, totaling $6,227,257 since assuming responsibility for collections in 2016. A total of
$1,449,183 was retained by the organization for collection activities.
13 | P a g eDelDOT CY 2021 Program Recommendations based on CY 2020 Data
For the past 15 years, the Electronic Red Light Safety Program has demonstrated successful
reductions in overall red light running and angle crashes at intersections with red light camera
installations. Our primary focus remains on safety, and not the monetary aspects of the program.
The Department recommends the following operating strategy for CY 2021:
Continue a statewide intersection selection evaluation for consideration of expanding the
ERLSP to further support the Delaware 2021-2025 Strategic Highway Safety Plan’s number
one emphasis area – reducing intersection-related fatalities and serious injuries.
Continue to work with our partnering municipalities and law enforcement agencies to make
sure their needs are met.
Continue to analyze crash data to better understand why crashes are occurring and identify
ways to improve safety.
Work with the recently-selected collections firm, Linebarger Goggan Blair & Sampson, LLP
to obtain greater efficiency and recoupment of delinquent fines. Continue to pursue reciprocity
with other states as part of an effort through the Division of Motor Vehicles for general
reciprocity among neighboring states.
Continue to work with jurisdictions outside of the State’s program to ensure compliance with
Title 21.
14 | P a g eAPPENDIX
15 | P a g e16 | P a g e
17 | P a g e
18 | P a g e
19 | P a g e
20 | P a g e
21 | P a g e
You can also read


