Current Methods and Pipelines for Image-Based Quantitation of Nuclear Shape and Nuclear Envelope Abnormalities
←
→
Page content transcription
If your browser does not render page correctly, please read the page content below
Review

Current Methods and Pipelines for Image-Based Quantitation
of Nuclear Shape and Nuclear Envelope Abnormalities
Anne F. J. Janssen †, Sophia Y. Breusegem † and Delphine Larrieu *

                                          Department of Clinical Biochemistry, Addenbrookes Biomedical Campus, Cambridge Institute for Medical
                                          Research, University of Cambridge, Cambridge CB2 0XY, UK; afj28@cam.ac.uk (A.F.J.J.);
                                          syab2@cam.ac.uk (S.Y.B.)
                                          * Correspondence: dl437@cam.ac.uk
                                          † Authors contributed equally.

                                          Abstract: Any given cell type has an associated “normal” nuclear morphology, which is important
                                          to maintain proper cellular functioning and safeguard genomic integrity. Deviations from this can
                                          be indicative of diseases such as cancer or premature aging syndrome. To accurately assess nuclear
                                          abnormalities, it is important to use quantitative measures of nuclear morphology. Here, we give
                                          an overview of several nuclear abnormalities, including micronuclei, nuclear envelope invagina-
                                          tions, blebs and ruptures, and review the current methods used for image-based quantification of
                                          these abnormalities. We discuss several parameters that can be used to quantify nuclear shape and
                                          compare their outputs using example images. In addition, we present new pipelines for quantitative
                                          analysis of nuclear blebs and invaginations. Quantitative analyses of nuclear aberrations and shape
                                          will be important in a wide range of applications, from assessments of cancer cell anomalies to stud-
                                          ies of nucleus deformability under mechanical or other types of stress.
Citation: Janssen, A.F.J.;
Breusegem, S.Y.; Larrieu, D. Current
                                          Keywords: nuclear envelope; nuclear envelope abnormality; lamina; nuclear morphology
Methods and Pipelines for
Image-Based Quantitation of
Nuclear Shape and Nuclear
Envelope Abnormalities.                   1. Introduction
Cells 2022, 11, 347.
                                                 While multiple cellular factors are required to maintain nuclear genome integrity and
https://doi.org/10.3390/cells11030347
                                          organisation, a primordial role is played by the nuclear envelope (NE). The NE (reviewed
Academic Editors:                         in[1–3]) consists of a double lipid bilayer that envelops the nucleoplasmic material (Figure
Symeon Siniossoglou                       1a). It is perforated with “pores”, formed by the nuclear pore complexes (NPC), which
and Wolfram Antonin                       ensure the transport of proteins and RNA between the nucleoplasm and cytoplasm.
Received: 28 December 2021
                                          Linker of Nucleoskeleton and Cytoskeleton (LINC) complexes that span the inner (INM)
Accepted: 18 January 2022                 and outer nuclear membrane (ONM) link the NE to the cytoplasmic cytoskeleton, ena-
Published: 20 January 2022                bling the nucleus to function in mechano-transduction. In metazoans, a network of lamin
                                          intermediate filaments lies on the inside of the NE envelope which not only provides me-
Publisher’s Note: MDPI stays neu-
                                          chanical support to the NE, but also organises chromatin and links with multiple nucleo-
tral with regard to jurisdictional
                                          plasmic regulators, thereby playing important roles in the regulation of diverse cellular
claims in published maps and institu-
                                          processes, including DNA replication and repair and gene expression control. Chromatin
tional affiliations.
                                          itself (the DNA and its associated proteins) also contributes to the mechanical stability of
                                          the nucleus [4]. Embedded in the INM are proteins from the LEM (LAP2-emerin-MAN1)
                                          domain family that all bind to Barrier-to-Autointegration Factor (BAF), a DNA and lamin
Copyright: © 2022 by the authors. Li-
                                          binding protein which plays import roles in nuclear envelope integrity.
censee MDPI, Basel, Switzerland.                 The different components of the NE act together to guard the integrity of the nucleus,
This article is an open access article    i.e., to protect the genome and respond to changing forces acting upon it. Indeed, the nu-
distributed under the terms and con-      cleus is not a rigid compartment, and the nuclear shape can vary drastically depending
ditions of the Creative Commons At-       on forces acting on the NE, either from the outside (e.g., cytoskeleton) or from within, as
tribution (CC BY) license (https://cre-   well as on tension that can occur within the NE [5]. For example, cells moving through
ativecommons.org/licenses/by/4.0/).       constricted spaces (such as metastatic cancer cells travelling through tiny blood vessels)

Cells 2022, 11, 347. https://doi.org/10.3390/cells11030347                                                            www.mdpi.com/journal/cells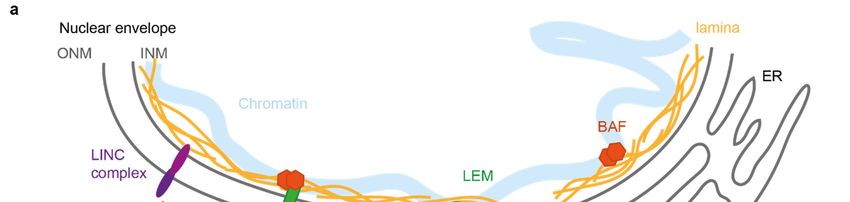
Cells 2022, 11, 347                                                                                             2 of 17

                      undergo dramatic nuclear shape changes [6–9]. These changes also accompany gene reg-
                      ulatory events such as chromatin decondensation during transcription regulation. The
                      most dramatic nuclear shape changes occur when cells undergo open or closed mitosis.

                      Figure 1. Simplified representation of the nuclear envelope and associated abnormalities. (a) The
                      nuclear envelope consists of two membranes: the inner and outer nuclear membrane (INM and
                      ONM respectively). Underlying the INM is the lamina composed of lamin A, B and C protein fila-
                      ments that provide structural support to the nucleus. At the INM are members of the LEM domain
                      protein family that can bind to the lamina directly or via BAF, a protein that binds DNA and the
                      lamina. Spanning the NE are LINC complexes that connect the nuclear interior to various cytoskel-
                      etal components. (b) Schematic overview of nuclear aberrations discussed in this review.

                            Beyond global shape changes, the nucleus can also present other types of NE anom-
                      alies such as NE invaginations, blebs and ruptures (Figure 1b). Importantly, while all of
                      these changes to the nuclear integrity occur at a low frequency in normal, healthy cells,
                      they can dramatically increase in conditions where the NE integrity becomes challenged.
                      This can occur upon mechanical stress or when the NE structure is weakened by depletion
                      or mutations of NE proteins. The latter occurs in several laminopathies such as Emery
                      Dreifuss Muscular Dystrophy (EDMD) [10–14] and in progerias (premature aging disor-
                      ders) including Hutchinson-Gilford Progeria Syndrome (HGPS) [15–17]. Nuclear irregu-
                      larities also occur in many cancer types, and visual inspection of the nuclear shape in can-
                      cer biopsies is widely used to assess both cancer stage and prognosis [18–20].
                            For these reasons, the detection and quantification of nuclear shape and NE altera-
                      tions can have broad applications, from cell biologists investigating mechano-transduc-
                      tion or cell migration through constricted spaces, to pathologists determining disease di-
                      agnosis or severity. This review focusses on current methods and pipelines to quantify
                      NE defects in interphase cells—although some of the described anomalies might originate
                      from imperfect NE assembly after mitosis. The methods described here mostly rely on the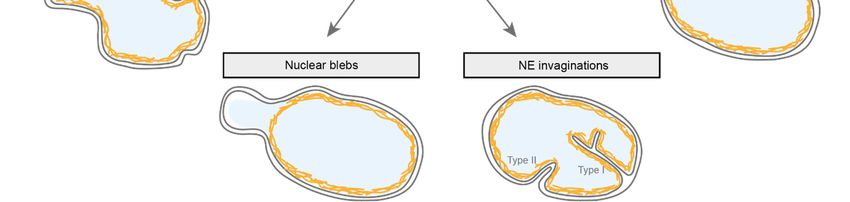
Cells 2022, 11, 347                                                                                           3 of 17

                      analysis of fluorescence microscopy images, but several of these can be adapted for use
                      with histology stains. We present methods and pipelines to quantify nuclear shape devi-
                      ations from the canonical round nuclear shape (circular shape in 2D and spherical shape
                      in 3D) and NE anomalies such as micronuclei, NE blebs and invaginations. The focus will
                      mainly be on 2D analyses, as these are most commonly used and are most accessible. We
                      illustrate these methods with examples and present new analysis pipelines for use both
                      with “regular” fluorescence microscopy images and in high-content screening applica-
                      tions.

                      2. Quantitative Analysis of Nuclear Shape
                      2.1. Nuclear Labelling
                            In order to analyse nuclear shape quantitatively, it is paramount to achieve good nu-
                      clear labelling. This should allow not only for a good definition of the nuclear contour,
                      but also for the accurate identification of the individual nuclei as objects to analyse (seg-
                      mentation). Focussing on fluorescent labelling, many researchers are familiar with organic
                      DNA-binding fluorophores (e.g., DAPI, Hoechst 33342, Hoechst 33258), which become
                      highly fluorescent upon binding to the DNA minor groove in a sequence-independent
                      manner [21,22]. However, in many instances, it is recommended to include a staining of
                      the NE (using antibodies against proteins such as nuclear pore complexes, LINC complex
                      etc.) or nuclear lamina (Lamin A/C or Lamin B). This not only much better defines the
                      nuclear/cytoplasm boundary, but also allows the analysis of other nuclear abnormalities
                      beyond shape such as invaginations, blebs etc. [23] (see below). In most cases, a UV-ab-
                      sorbing DNA stain can be combined with antibody-labelling of the nuclear lamina or a
                      NE-resident protein to allow for both nuclei identification, segmentation and selection (all
                      based on the DNA stain) as well as nuclear shape analysis (using either the NE/lamina
                      stain or both stains). Inclusion of a DNA stain has the specific advantage of allowing for
                      the exclusion of the nuclei in mitosis, based on their increased DNA staining intensity. Of
                      note, many segmentation algorithms give an option to smooth (i.e., locally average) meas-
                      ured fluorescence intensities. For each analysis this should be carefully considered, as
                      smoothing generally removes irregularities in the nuclear contour and could therefore re-
                      move them from the nuclei as they are selected for analysis.

                      2.2. Quantitative Parameters to Analyse Nuclear Shape
                            Early reports of irregular nuclear shape generally relied on manual visual classifica-
                      tion, a method inherently subject to observer bias and therefore liable to poor reproduci-
                      bility. This was sometimes mitigated by including several observers blinded to the exper-
                      imental details. Nevertheless, a quantitative and automated analysis of nuclear shape was
                      clearly needed to avoid this bias and increase the throughput.
                            While not strictly describing nuclear shape, it is worth noting that a number of quan-
                      titative parameters of nuclear size can also indirectly reflect the presence of NE defects
                      and are often easier to compute in commonly used image analysis software packages.
                      These include nuclear area, nuclear diameter and nuclear perimeter. For example, mouse
                      embryonic fibroblasts derived from mice with a H222P mutation in lamin A, which in
                      humans causes dilated cardiomyopathy, were shown to have larger nuclei compared to
                      their wild-type counterparts [24]. Alternatively, knockdown of ELYS, a protein of the nu-
                      clear pore complex, causes smaller nuclei which was proposed to be correlated to de-
                      creased nuclear transport capacity [25]. However, nuclear size changes can also be influ-
                      enced by many other factors such as chromatin compaction state, cytoskeletal organisa-
                      tion, cell cycle phase etc. It is also worth noting that nuclear size in 2D might not be a good
                      indicator of total nuclear volume. For example, a flattened nucleus would display an in-
                      creased nuclear area in 2D compared to the same nucleus in a rounded state. This can be
                      influenced by extracellular factors such as substrate rigidity, cell confluency, time since
                      plating etc.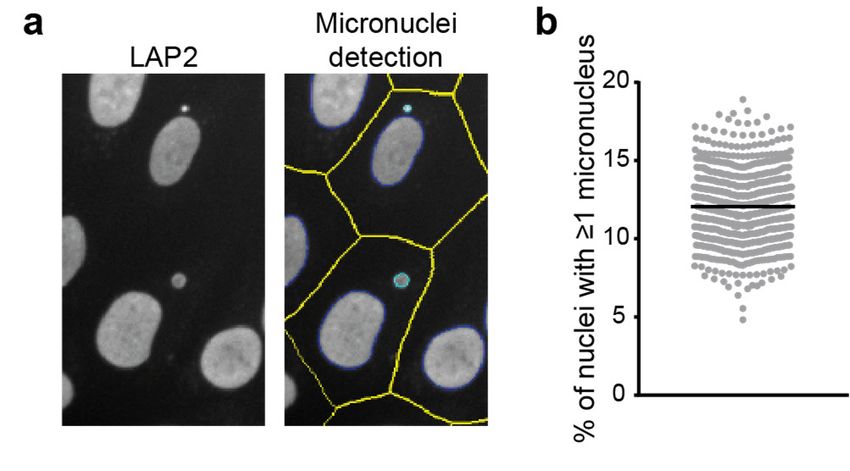
Cells 2022, 11, 347 4 of 17
2.2.1. Nuclear Roundness
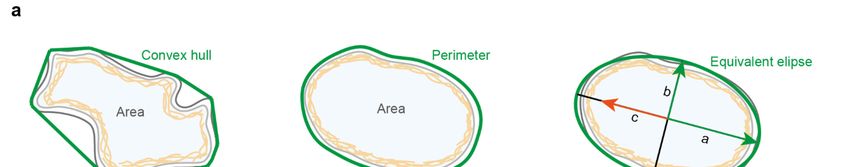
The most commonly used quantitative measure of nuclear shape is the ratio of 4π
times the nuclear area (A) to the nuclear perimeter (P) squared (4πA/P2) (Figure 2a). This
is a measure of the roundness of the nucleus; for a perfectly circular nucleus, the ratio is
1, while for a more deconvoluted shape (e.g., with blebs or lobulations), the ratio is smaller
than 1. This ratio has been named the nuclear contour ratio [11], nuclear circularity [26] or
form factor, e.g., in the open source image analysis package CellProfiler [27]. In some im-
age analysis software packages, the inverse of this ratio is used for analysis of an object’s
roundness; in this case the analysed shape’s ratio is 1 for a perfect circle and increases
when the nucleus deviates from a circular shape. Nuclear circularity analysis has been
used to analyse the effects of NE dysfunction in various cellular contexts such as cancer
[26,28], laminopathies such as EDMD [11] and HGPS [17,29] or cardiomyopathies [30].
Another easy to compute ratio indicative of nuclear roundness is the nuclear length-to-
width ratio or axis ratio. More frequently a related nuclear eccentricity parameter is cal-
culated instead [31,32]. Eccentricity is a measure of the shape of the bounding ellipse; a
circle has an eccentricity of 0, and a more elongated shape is associated with a higher
eccentricity (Figure 2a).
2.2.2. Boundary Curvature and Solidity
After defining the nuclear contour, one can also characterise boundary curvature.
This is a very good method to quantify nuclear shape as curvature provides a complete
description of nuclear shape. Indeed, defining the mean negative curvature as the average
of all the concave curvatures on the boundary of a nucleus, could accurately distinguish
the highly-blebbed nuclei in fibroblasts from HGPS patients from the similarly-sized nu-
clei in healthy donor fibroblasts [31]. In addition, the same paper showed that the mean
negative curvature was not dependent on imaging intensity or cell density. Moreover, the
highly lobulated or deconvoluted nuclear shape of HGPS cells could also be accurately
characterised through its solidity, the ratio of the nucleus’ measured area to the area of its
convex hull shape (Figure 2a).
2.2.3. Elliptic Fourier Transform
An alternative measure of nuclear shape uses an elliptic Fourier transform, approxi-
mating the nuclear shape as a sum of harmonic ellipses. This analysis has been used in 2
ways, either determining the number of ellipses required to accurately describe the nu-
clear shape [11], or using a fixed number of ellipses and making a ratio of their coefficients.
The latter was used in a recent RNAi screen for epigenetic modulators of nuclear shape in
breast cancer epithelial cells [33]. The authors also computed the solidity of their meas-
ured nuclei and demonstrated that the elliptic Fourier coefficient ratio measurements
showed a larger dynamic range and are consequently more sensitive to nuclear shape de-
formations.
2.2.4. Nuclear Symmetry
Looking at nuclear symmetry can also be informative. Nikonenko and Bozhok (2015)
compared two measures of nuclear symmetry: radial asymmetry and point asymmetry.
Radial asymmetry determines the number of pixels outside the largest inscribed circle of
a nucleus. Point asymmetry quantifies the number of pixels that do not have a symmetric
pixel partner with respect to the nucleus’ centroid. They found that compared to the cir-
cularity measurement, the symmetry-based analyses were better at distinguishing oval
shapes versus other irregular shapes [34]. The authors have made their analysis available
via an ImageJ plugin.
Cells 2022, 11, 347                                                                                                     5 of 17

                      Figure 2. Commonly used parameters to describe nuclear shape. (a) Visual representation and math-
                      ematical definition of 3 routinely used nuclear shape descriptors: solidity, form factor (or circularity)
                      and eccentricity. Values for each of these range from 0 to 1. (b,c) Example of nuclear shape analysis
                      on DAPI-stained nuclei in fibroblasts derived from a patient with Nestor-Guillermo progeria syn-
                      drome (NGPS). Nuclear shapes in (b) were detected in CellProfiler; (c) Comparison of the values of
                      three nuclear shape descriptors for the four detected nuclei shown in (b), with the colours of the
                      bars corresponding to the colours of the nuclear masks in (b). Elongated shapes are better distin-
                      guished from rounder shapes by eccentricity than by solidity, while the highly lobulated nuclear
                      shape is well distinguished using solidity and form factor. (d) Lamin A/C staining of a representa-
                      tive nucleus in a healthy donor fibroblast and a nucleus in a fibroblast from a patient with HGPS.
                      The HGPS nucleus shows lamin invaginations, absent in the control nucleus, and a bulged nuclear
                      contour. (e) Analysis of >50 nuclei in control and HGPS fibroblasts of similar cell passage yields
                      significant differences for the nuclear solidity (p < 0.001) and eccentricity (p = 0.0003) but not for the
                      form factor (p = 0.24). More elaborate nuclear shape analyses such as mean negative curvature cal-
                      culation or elliptic Fourier transform (see text for details) are also able to distinguish control from
                      HGPS nuclei.

                      2.2.5. Comparison of Shape Descriptors
                           In summary, there are many quantitative nuclear shape parameters that have differ-
                      ent sensitivities towards specific types of shape aberrations; as such, a single quantitative
                      shape analysis might not necessarily reflect an observed nuclear shape change (Figure 2).
                      Sometimes, more than one analysis is required to convey the observed nuclear shape ab-
                      normalities. In addition, results can depend on how well the nuclear contour is defined;
                      for example, a set of densely packed NE bulges or blebs might not change the overall
Cells 2022, 11, 347                                                                                         6 of 17

                      nuclear roundness significantly, and might thus not be reflected in quantitative parame-
                      ters of nuclear roundness. Figure 2 illustrates this with analysis of DAPI-stained nuclei in
                      fibroblasts derived from a patient with Nestor-Guillermo progeria syndrome (NGPS)
                      (Figure 2b,c) and lamin-stained nuclei of control and HGPS fibroblast cells (Figure 2d,e).
                      The control and HGPS nuclei examples in Figure 2d have very similar values for the three
                      most commonly used nuclear shape measures (solidity: 0.99 vs. 0.97, form factor: 0.86 vs.
                      0.81 and eccentricity: 0.73 vs. 0.67). However, analysis of a larger number of cells does
                      detect a significant difference for the nuclear solidity and eccentricity (Figure 2e).
                            While we have so far focused on nuclear shape analysis in fixed cells, quantitative
                      analysis of nuclear shape dynamics is possible in time-lapse imaging experiments in live
                      cells. Usually, a genetically-encoded fluorescent nuclear reporter (e.g., a GFP-labelled his-
                      tone protein) is used to follow the nuclear contour over time. Some DNA stains are also
                      compatible with live-cell imaging [35] and fluorescent protein labelling of lamins or NE
                      transmembrane proteins can also be used. Looking at the flickering of the nucleus, i.e., the
                      changes in the nucleus’ contour on the time scale of seconds, Chu et al. [36], were able to
                      quantify the mean square amplitude of the fluctuations and showed that this measure
                      correlates with cell cycle stage. Quantitative analysis of nuclear flickering can also yield
                      NE properties such as the NE bending modulus [37].

                      2.3. Note on 3D Analysis
                           As access to confocal fluorescent microscopes has become more widespread, includ-
                      ing in high-throughput settings, there has been a growing interest in defining nuclear
                      morphology in 3D. The open-source image analysis software ImageJ contains a basic 3D
                      volume analysis module (“3D object counter”), while a recently updated ImageJ plugin,
                      NucleusJ, can calculate 15 nuclear parameters from a z-stack of nuclei images, including
                      3D shape descriptors such as flatness, elongation and sphericity [38,39]. While we believe
                      that these tools are sufficient for most applications, current research aims at refining the
                      3D shape representation derived from 3D voxels by incorporating 3D surface modelling
                      in the analysis[40].

                      3. Micronuclei
                           Micronuclei (recently reviewed in [41–43]) are small, extranuclear chromatin bodies
                      surrounded by a NE. They arise from defects in chromosome segregation at the end of
                      mitosis, with a lagging chromosome or chromosome fragment being encapsulated in its
                      own NE membrane. Micronuclei are prone to rupture which can lead to genome instabil-
                      ity through dramatic DNA rearrangement events (e.g., chromothripsis or chromosome
                      shattering) [44,45]. In addition, exposure of micronuclear DNA to the cytoplasm can acti-
                      vate the cyclic GMP-AMP Synthase (cGAS), which in turn activates the cGAS-stimulator
                      of interferon genes (STING) pathway and leads to expression of proinflammatory genes
                      [46,47]. The presence of micronuclei has been associated with various pathologies such as
                      cancer [42], and the quantitation of the fraction of nuclei with a micronucleus can give an
                      estimate of genome stability.
                           Micronuclei appear as circular spots in fluorescent microscopy micrographs stained
                      either for DNA, lamin proteins or NE transmembrane proteins such as the lamin B recep-
                      tor or emerin. We have also found that the nucleoplasmic LEM-domain protein LAP2α is
                      present in micronuclei (Figure 3). However, several nuclear pore complex components
                      were reported to be largely absent from micronuclei [48] and as such the micronuclear NE
                      is not identical to the envelope of the primary nucleus.
                           Quantification of the fraction of cells containing micronuclei requires analysis of a
                      large number of cells as the occurrence of micronuclei is low in healthy cells (0.5–2.5 mi-
                      cronuclei per 1000 cells) [49]. However, determining micronuclei presence in fluorescent
                      micrographs is relatively straightforward, and they are clearly visible when stained for
                      the DNA within them (e.g., using DAPI or Hoechst 33258) or a NE, nuclear lamina or
                      nucleoplasm component such as emerin, LMNA or LAP2α. Using LAP2-stained images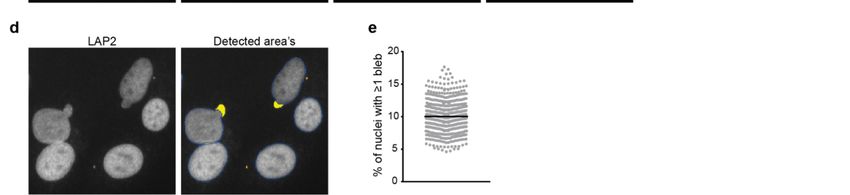
Cells 2022, 11, 347                                                                                                 7 of 17

                      acquired on a high-content high-throughput microscope (Thermo Scientific CellInsight)
                      and its associated software (HCS Studio), we can indeed detect micronuclei (Figure 3).
                      The analysis algorithm first identifies nuclei and potential micronuclei using intensity and
                      morphological features. While some of these are standard (e.g., smoothing, thresholding
                      and segmentation), others are specifically included to aid in the identification of micronu-
                      clei. For example, there is a nucleus “cleanup” function that sequentially erodes and di-
                      lates the nuclear mask to clear the nucleus of small objects. Cytoplasmic boundaries of the
                      cells are either defined using a whole cell stain (imaged in an additional channel) or ap-
                      proximated through dilation of the nuclear masks. Finally, nuclear objects are classified
                      as a nucleus or micronucleus based on their comparative size within an intact cell, with
                      the maximum micronuclear diameter typically set at a third of the nucleus’ diameter.
                      Measurement of micronuclear frequency, i.e., the percentage of nuclei that have one or
                      more micronuclei associated with them, in an hTERT immortalised fibroblast cell line in-
                      dicates that 12% of cells have a micronucleus (Figure 3b). Other outputs of the analysis
                      not shown include average micronuclear size as well as micronuclear intensity and mor-
                      phology measurements.

                      Figure 3. Detection of micronuclei in LAP2-stained images acquired on a high-content microscope.
                      (a) Example of micronuclei detection in automated microscopy. Defined nuclear contours are indi-
                      cated in dark blue, micronuclei in cyan and cell boundaries in yellow. See details of the analysis in
                      the main text. (b) Quantitation of micronuclei frequency on images acquired on a high-content mi-
                      croscope in hTERT immortalised control fibroblasts in multiple biological replicates.

                      4. Nuclear Envelope Invaginations
                            NE invaginations, also referred to as the nucleoplasmic reticulum (NR), can be found
                      in many different cell types. Invaginations of the NE are present in healthy cells and tis-
                      sues [50] and they are thought to play a role in genome organisation, lipid metabolism,
                      DNA repair [51] and regulation of nuclear Ca2+ signalling [52–54]. Invaginations can range
                      from a few hundred nm’s long to transecting the entire nucleus and are classified into two
                      types. Type I invaginations only involve the invagination of the inner nuclear membrane
                      (INM) while type II invaginations consist of both inner and outer nuclear membrane [55].
                      Type II invaginations thus have a cytoplasmic core that can contain mitochondria, vesi-
                      cles, endoplasmic reticulum (ER) like membranes or cytoskeletal components [56,57].
                      These two types of invaginations can coexist within the same nucleus and type I invagi-
                      nations can branch off type II invaginations forming complex branched networks. A lam-
                      ina coat has been detected on both types of invaginations and therefore the presence of
                      intranuclear lamina is often used to detect the presence of invaginations using light mi-
                      croscopy techniques.
                            While the exact mechanisms underlying invagination formation and stabilisation still
                      need further exploration, formation can occur in interphase and does not merely represent
                      a remnant of faulty post-mitotic NE reassembly. Furthermore, formation of NE invagina-
                      tions is dependent on synthesis of new proteins and membrane phospholipids and thus
                      doesn’t reflect a reorganisation of the existing nuclear envelope [55,58,59].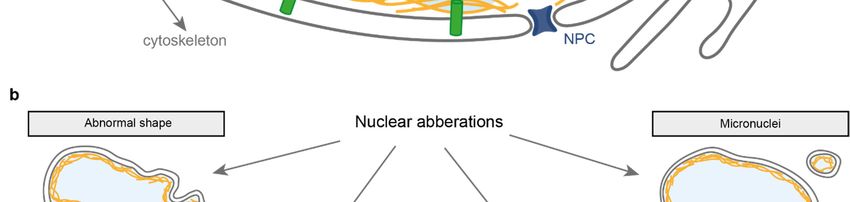
Cells 2022, 11, 347                                                                                         8 of 17

                          Although NE invaginations are observed in healthy cells, their frequency has been
                      observed to increase in various pathologies such as cancer [60,61], tauopathies [57,62],
                      Hutchinson-Gilford Progeria Syndrome (HGPS) [63] and Emery Dreifuss Muscular
                      Dystrophy (EDMD) [64]. Therefore, the development of sensitive and automated tools to
                      quantify these invaginations can have broad applications for both fundamental research
                      and clinical diagnosis purposes.

                      4.1. Quantification of NE Invaginations
                           The presence of NE invaginations can be visualised using Electron Microscopy (EM)
                      [55,65–67] or light microscopy techniques [58,62,67]. Using light microscopy, invagina-
                      tions can be detected by the presence of lamina, which underlies the inner nuclear mem-
                      brane, or the presence of a nuclear envelope marker within the nuclear interior. Visual
                      estimation and manual quantification of the number of invaginations is often employed
                      [55,58,66,67], but this is time consuming and can be biased.
                           Automated quantification of the presence of NE markers in the nuclear interior can
                      therefore be a powerful tool, to give qualitative information on the presence of invagina-
                      tions, but also quantitative data on the number of these invaginations. A custom FIJI
                      plugin was previously developed [57] which relies on the quantification of lamin B in the
                      nuclear interior using confocal microscopy images. The authors used this quantification
                      to show an increased number of nuclear invaginations in human Fronto-Temporal De-
                      mentia (FTD) neurons caused by abnormal microtubule organisation due to mislocalised
                      Tau [57].
                           Using an analysis pipeline which can detect areas with high levels of lamin B in prox-
                      imity to the NE or in the nuclear interior, one can estimate the number of invaginations.
                      This can give information on the severity of the invagination phenotype or help to set a
                      threshold to define an invagination positive population. Using an image analysis pipeline
                      we have developed in Cell Profiler [27,68] (Figure 4a), we were able to detect and quantify
                      the amount of intranuclear lamin B in confocal images. In short, the pipeline detects the
                      nucleus based on DAPI staining after which it detects areas with high levels of lamin B.
                      The nucleus object is shrunken by a defined number of pixels allowing the separation of
                      lamin B present at the NE and lamin B localised in the nuclear interior (invaginations)
                      (Figure 4a). Using this pipeline, we could show an increased number of invaginations in
                      a Nestor Guillermo Progeria Syndrome (NGPS) patient cell line, in which NE integrity is
                      compromised (Figure 4b,c). Although this does not seem to be a consistent phenotype of
                      NGPS (Figure 4b,c), we believe that this Cell Profiler pipeline (or similar analysis pipe-
                      lines) could be of great use for the automated detection of NE invaginations in other cel-
                      lular and/or disease contexts.

                      4.2. D Imaging of NE Invaginations
                           Most analyses of NE invaginations are based on 2D information, and therefore, might
                      not only quantify invaginations, but also large folds in the nuclear envelope. In the context
                      of a diseased state, the distinction might not appear that important, although NE folds
                      could represent different implications and molecular causes. To better map the exact or-
                      ganisation of NE invaginations, 3D imaging can be used [54,56,69]. However, analysis of
                      3D data mostly relies on manual quantification. 3D based analysis of nuclear area occu-
                      pied by NE invaginations has been done previously, although the exact analysis pipeline
                      remains unclear [54]. Also, a direct comparison of a manual estimation of the number of
                      invaginations using a single confocal slice or a z-stack showed that although absolute
                      numbers might differ, the fold change was similar [66]. Therefore, 2D imaging will pro-
                      vide enough information and will be more efficient when analysing large data sets. It is
                      also more amenable to the analysis of clinical samples as 3D imaging on patient biopsies
                      is challenging [70] and not routinely performed.
Cells 2022, 11, 347                                                                                             9 of 17

                      Figure 4. Quantification of nuclear envelope invaginations. (a) Simplified pipeline and example
                      showing detection of nuclear invaginations in CellProfiler. (b) Representative immunofluorescence
                      images of control and two NGPS patient-derived fibroblast cell lines (NGPS1 = NGPS5796 and
                      NGPS2 = NGPS5787, gift from C. Lopez-Otin) stained for lamin B1. Scale bar 10µm. (c) Examples of
                      intranuclear lamin B1 area quantification and of the number of detected lamin B1 objects in the
                      nuclear interior of cells represented in (b) using the described analysis pipeline.

                      5. Nuclear Envelope Blebs and Ruptures
                            Until recently, it was assumed that loss of NE integrity occurred only during mitosis.
                      However, recent work has shown that loss of nuclear compartmentalisation can also hap-
                      pen in interphase nuclei. The loss of NE integrity has indeed been observed in vitro in
                      cells from laminopathy patients [71], in cancer cells [72] and in cells in which the NE had
                      been weakened by viral infection or viral proteins expression [73,74]. In vivo, NE ruptures
                      have been observed as cells experience confined migration through dense tissues [6,7,75],
                      at the invasive edge of human tumours [76] and in aortic smooth muscle cells of a mouse
                      progeria model [77]. In this context, NE ruptures can occur when pressure on the nuclear
                      envelope becomes so high that this leads to a transient loss of NE integrity.
                            Typically, nuclear envelope rupture is preceded by the formation of a weak point in
                      the nuclear lamina as the nuclear lamina plays an important role in handling nuclear me-
                      chanical stress. The lamina gaps are devoid of lamin B1 [6] and often lack other NE pro-
                      teins such as nuclear pore complexes and LINC proteins [78,79]. Both the presence and
                      absence of Lamin A have been reported at these gaps which might reflect different stages
                      of the rupture and repair process [80,81].
                            A gap in the lamina allows the formation of a protrusion of the nuclear membrane
                      that temporarily releases the intranuclear pressure. However, under continued stress, the
Cells 2022, 11, 347                                                                                         10 of 17

                      membrane bleb will eventually rupture as the absence of the lamina makes it vulnera-
                      ble[82]. Nuclear membrane rupture leads to the exposure of chromosomal DNA to the
                      cytoplasm and exchange of material between the cytoplasmic and nucleoplasmic com-
                      partments. This can lead to genome instability but also to the activation of innate immune
                      signalling pathways. Maybe not surprisingly, cells can efficiently repair the NE after rup-
                      ture. Resealing of the NE typically occurs within minutes but can occasionally last for
                      hours. The repair process is mediated by multiple proteins including barrier-to-autointe-
                      gration factor (BAF), LEM domain proteins and ESCRT-III components [6,7,83–85] and is
                      thought to involve the recruitment of ER sheets to the sites of rupture to reseal the mem-
                      brane.

                      5.1. Analysis of Nuclear Envelope Blebs
                            The presence of nuclear blebs is thus indicative of a defect in the structural integrity
                      of the NE that can make them prone to ruptures. Therefore, the analysis of nuclear bleb
                      frequency can serve as a means to detect a lack of NE integrity. Typically, blebs are iden-
                      tified based on visual inspection of nuclear morphology by DAPI staining. So far, analysis
                      of bleb frequency mostly relied on manual assignment of nuclei showing blebs.
                            An alternative method to distinguish nuclear blebs relies on the fact that blebs typi-
                      cally lack lamin B. This lack of lamin B can be used for automated detection of nuclear
                      blebs using an image analysis pipeline. This involves the detection of a chromatin object
                      based on DAPI staining and a lamin B object. Substraction of both areas leads to the defi-
                      nition of a chromatin area lacking lamin B staining (Figure 5a). Care must be taken in
                      setting the intensity threshold of the DAPI image as the blebs often contain less DNA than
                      the rest of the nucleus. Moreover, this analysis can only detect chromatin-containing blebs
                      while blebs lacking chromatin have also been reported [7,80].
                            Based on this principle, we designed a CellProfiler pipeline (Figure 5a) that can au-
                      tomatically detect and quantify blebs and is therefore useful for the analysis of large image
                      data sets. This pipeline can be used to detect the percentage of cells with blebs, the average
                      size of blebs or could be used to analyse and quantify the recruitment of specific proteins
                      of interest to the bleb sites (Figure 5b,c). Analysis of protein recruitment to blebs can be
                      combined with rupture reporters (see details below) to ensure the blebs analysed have
                      already undergone rupture.
                            Alternatively, we have also been able to define nuclear blebs in images acquired on
                      a high-content high-throughput microscope using the same algorithm that we used to de-
                      tect micronuclei but with different constraints (Figure 5d). This analysis is thus not based
                      on the absence of lamin B staining but on morphological features. In particular, the nu-
                      cleus cleanup function is set to its maximum number of iterations such that blebs are “cut
                      off” from the main nuclear shape and can be analysed; at the same time the “objects”
                      (blebs) need to be touching the main nucleus. Additional restraints can be set, such as
                      object size or circularity to filter out micronuclei that are touching the nucleus as micro-
                      nuclei are typically smaller and more circular than nuclear blebs. Figure 5d illustrates the
                      detection output of the algorithm, with nuclear blebs indicated by the yellow overlay
                      while micronuclei, indicated in orange, are excluded from the analysis. Quantification of
                      nuclear bleb frequency in hTERT immortalised fibroblasts shows that 10% of nuclei have
                      a nuclear bleb (Figure 5e).
Cells 2022, 11, 347 11 of 17
Figure 5. Detection and analysis of nuclear blebs. (a) Simplified pipeline and example showing the
detection of nuclear blebs in CellProfiler. (b) Example image showing the endogenous staining of
lamin B1 and lamin A/C in human fibroblast cells and the detected area’s using the pipeline de-
scribed in (a). Numbers indicate the lamin A/C enrichment calculated for the detected blebs (lam-
inA/Cbleb/laminA/ClaminBobject) (c) Example showing the quantification of lamin A/C enrichment at
blebs in human fibroblast and the relative bleb area (areableb/areanucleus) using the described pipeline.
(d) Nuclear bleb detection in LAP2-stained nuclei in hTERT immortalised control fibroblasts in im-
ages acquired on a high-content microscope. The detection algorithm is based on the micronuclei
detection algorithm (see text and Figure 3); however, the algorithm now selects nuclear blebs (yel-
low overlay) for analysis and rejects micronuclei (orange overlay) based on their size and distance
to the primary nucleus (dark blue contour). (e) Quantification of nuclear bleb occurrence frequency
in hTERT immortalised control fibroblasts in multiple biological replicates using automated nuclear
bleb detection shown in (d).
5.2. Nuclear Envelope Rupture Analysis
To analyse the loss of nuclear compartmentalisation occurring upon NE rupture, flu-
orescent proteins fused to a nuclear localisation signal (NLS) or nuclear export signal
(NES) are frequently used. Alternatively, tracking the nuclear influx of proteins or mole-
cules that are normally excluded from the nucleus has been used as a marker of rupture
e.g., Hsp90 [10], alpha-Tubulin [86] or 70 kDa dextran [71].
The most common reporter of NE rupture is based on (multiple) fluorescent proteins
with an NLS signal (e.g., NLS-GFP) [71,72,87]. This reporter accumulates in the nucleus
and upon NE rupture can transiently leak into the cytoplasm. Upon repair of the NE, re-
accumulation of the fluorescent signal in the nucleus is observed. Thus, this reporter also
provides information about repair kinetics in addition to rupture frequency. NE ruptures
can also be identified based on accumulation of proteins such as BAF or cGAS at sitesCells 2022, 11, 347 12 of 17
where chromatin has been exposed to the cytoplasmic environment [6,7,83]. Overexpres-
sion of fluorescently tagged catalytically inactive cGAS, which accumulates on chromatin
at the rupture location, can also be used to detect ruptures [7,10] and is usually analysed
manually.
Analyses of NLS-GFP localisation in live cell imaging can be done manually, but au-
tomated tracking has increased the throughput of this approach [84]. In this manuscript,
Robijns et al. used an analysis pipeline written for FIJI image analysis software. The script
is based on nuclei detection after image pre-processing followed by object tracking based
on a nearest neighbour algorithm and finally track analysis. Usually, co-expression of a
nuclear marker that does not leak upon NE rupture, such as mCherry-H2B or a chromatin
dye, can be used for object tracking while simultaneously analysing fluctuations in GFP-
NLS intensity to detect the presence of ruptures. The authors used this automated analysis
to show that rupture frequency is inversely correlated with lamin A/C levels.
A similar automated analysis pipeline was developed in MATLAB to analyse cells
migrating through restrictions using microfluidic devices [88]. This algorithm uses several
processing steps to identify single nuclei based on fluorescently tagged H2B. Restrictions
are localised based on transmitted light images of the device and detection of the circular
pillars. Nuclei are subsequently tracked over time including when they pass through a
restriction. NE rupture is monitored by analysing the nuclear NLS-GFP intensity com-
pared to the H2B signal.
5.3. Inducing Nuclear Envelope Ruptures
Non-transformed wild-type cell lines rarely show spontaneous NE ruptures [71,89].
However, NE ruptures can be induced by depleting lamins, expressing mutant lamin pro-
teins, compromising the organisation of the peripheral heterochromatin or by viral infec-
tion. NE ruptures can also be triggered by mechanical stress. Techniques include con-
stricted migration [6,7], laser ablation [83,86], cell compression between coverslips [76]
and micro-indentation using Atomic Force Microscopy [75]. For more information on
these and other methods to study mechanical properties of the nucleus see Hobson et al.,
2021 [90]. It is also interesting to note that lipid-based transfection can increase membrane
rupture frequency [80].
Inducing ruptures is particularly important when analysing specific events in the NE
repair process, due to the fast nature of the repair process (a few minutes). High temporal
resolution is therefore essential to catch specific events. It is important to note that it re-
mains unclear how some of these methods accurately mimic and therefore reflect NE rup-
ture repair in a physiological cellular context. Laser ablation for example could lead to
additional effects such as DNA damage due to the high laser powers used. However, some
papers do use multiple complementary methods showing that the rupture repair mecha-
nisms are independent of the method used to induce rupture [7,83].
6. Concluding Remarks
The past decades have seen an increase in the quantity of research on the mechano-
biology of the nucleus, due to its emerging links with diseases such as cancer and prema-
ture aging syndromes. Until recently, most analyses of nuclear abnormalities relied on
manual scoring, which is low throughput and subjected to observer bias. With the recent
advances in automated microscopy and high-throughput screening approaches, there has
been a clear need for automated quantification of nuclear shape and NE defects. Here, we
have discussed different nuclear abnormalities and published analysis pipelines used to
quantify these. We have also summarised several metrics used for the quantification of
nuclear shape. Furthermore, we have presented some new automated image analysis
pipelines that we used for the analysis of large datasets. Undoubtedly, the development
of open-source image analysis software such as CellProfiler will lead to the discovery of
other diseases and processes involving nuclear biology, and will therefore contribute to
further understanding of complex nuclear processes.Cells 2022, 11, 347 13 of 17
Author Contributions: Conceptualisation, A.F.J.J. and S.Y.B.; formal analysis, A.F.J.J. and S.Y.B.;
writing—original draft preparation, A.F.J.J. and S.Y.B.; writing—review and editing, A.F.J.J., S.Y.B.
and D.L.; visualisation, A.F.J.J.; supervision, D.L.; funding acquisition, A.F.J.J. and D.L. All authors
have read and agreed to the published version of the manuscript.
Funding: This research was funded by a Sir Henry Dale Fellowship jointly funded by the Wellcome
Trust and the Royal Society (Grant Number 206242/Z/17/Z) and A.F.J.J. is supported by a FEBS
Long-Term Fellowship.
Institutional Review Board Statement: Not applicable
Informed Consent Statement: Not applicable
Data Availability Statement: The presented Cell Profiler pipelines will be uploaded on the Cell
Profiler website and be made freely available to the readers upon publication.
Acknowledgments: We would like to thank Carlos Lopez-Otin for providing us with the Nestor-
Guillermo progeria cell lines. We are grateful to the CIMR microscopy facility—in particular to Mat-
thew Gratian—for their help and support and to Henri Huppert (Thermo Fisher Scientific) for initial
help with the automated micronuclei and NE bleb analysis.
Conflicts of Interest: The authors declare no conflict of interest.
References
1. Hetzer, M.W. The nuclear envelope. Cold Spring Harb. Perspect. Biol. 2010, 2, a000539.
https://doi.org/10.1101/cshperspect.a000539.
2. Wilson, K.L.; Berk, J.M. The nuclear envelope at a glance. J. Cell Sci. 2010, 123, 1973–1978. https://doi.org/10.1242/jcs.019042.
3. Gauthier, B.R.; Comaills, V. Nuclear envelope integrity in health and disease: Consequences on genome instability and
inflammation. Int. J. Mol. Sci. 2021, 22, 7281. https://doi.org/10.3390/ijms22147281.
4. Stephens, A.D.; Banigan, E.J.; Marko, J.F. Chromatin’s physical properties shape the nucleus and its functions. Curr. Opin. Cell
Biol. 2019, 58, 76–84. https://doi.org/10.1016/j.ceb.2019.02.006.
5. Ungricht, R.; Kutay, U. Mechanisms and functions of nuclear envelope remodelling. Nat. Rev. Mol. Cell Biol. 2017, 18, 229–245.
https://doi.org/10.1038/nrm.2016.153.
6. Denais, C.M.; Gilbert, R.M.; Isermann, P.; McGregor, A.L.; te Lindert, M.; Weigelin, B.; Davidson, P.M.; Friedl, P.; Wolf, K.;
Lammerding, J. Nuclear envelope rupture and repair during cancer cell migration. Science 2016, 352, 353–358.
https://doi.org/10.1126/science.aad7297.
7. Raab, M.; Gentili, M.; De Belly, H.; Thiam, H.R.; Vargas, P.; Jimenez, A.J.; Lautenschlaeger, F.; Voituriez, R.; Lennon-Duménil,
A.M.; Manel, N.; et al. ESCRT III repairs nuclear envelope ruptures during cell migration to limit DNA damage and cell death.
Science 2016, 352, 359–362. https://doi.org/10.1126/science.aad7611.
8. Bell, E.S.; Lammerding, J. Causes and consequences of nuclear envelope alterations in tumour progression. Eur. J. Cell Biol. 2016,
95, 449–464. https://doi.org/10.1016/j.ejcb.2016.06.007.
9. Fu, Y.; Chin, L.K.; Bourouina, T.; Liu, A.Q.; Van Dongen, A.M.J. Nuclear deformation during breast cancer cell transmigration.
Lab A Chip 2012, 12, 3774–3778. https://doi.org/10.1039/c2lc40477j.
10. Earle, A.J.; Kirby, T.J.; Fedorchak, G.R.; Isermann, P.; Patel, J.; Iruvanti, S.; Moore, S.A.; Bonne, G.; Wallrath, L.L.; Lammerding,
J. Mutant lamins cause nuclear envelope rupture and DNA damage in skeletal muscle cells. Nat. Mater. 2020, 19, 464–473.
https://doi.org/10.1038/s41563-019-0563-5.
11. Lammerding, J.; Hsiao, J.; Schulze, P.C.; Kozlov, S.; Stewart, C.L.; Lee, R.T. Abnormal nuclear shape and impaired
mechanotransduction in emerin-deficient cells . J. Cell Biol. 2005, 170, 781–791. https://doi.org/10.1083/jcb.200502148.
12. Ognibene, A.; Sabatelli, P.; Petrini, S.; Squarzoni, S.; Riccio, M.; Santi, S.; Villanova, M.; Palmeri, S.; Merlini, L.; Maraldi, N.M.
Nuclear changes in a case of X-linked Emery-Dreifuss muscular dystrophy. Muscle Nerve 1999, 22, 864–869.
https://doi.org/10.1002/(sici)1097-4598(199907)22:73.0.co;2-g.
13. Sabatelli, P.; Lattanzi, G.; Ognibene, A.; Columbaro, M.; Capanni, C.; Merlini, L.; Maraldi, N.M.; Squarzoni, S. Nuclear
alterations in autosomal-dominant Emery-Dreifuss muscular dystrophy. Muscle Nerve 2001, 24, 826–829.
https://doi.org/10.1002/mus.1076.
14. Fidziańska, A.; Hausmanowa-Petrusewicz, I. Architectural abnormalities in muscle nuclei. Ultrastructural differences between
X-linked and autosomal dominant forms of EDMD. J. Neurol. Sci. 2003, 210, 47–51. https://doi.org/10.1016/s0022-510x(03)00012-
1.
15. De Sandre-Giovannoli, A.; Bernard, R.; Cau, P.; Navarro, C.; Amiel, J.; Boccaccio, I.; Lyonnet, S.; Stewart, C.L.; Munnich, A.; Le
Merrer, M.; et al. Lamin a truncation in Hutchinson-Gilford progeria. Science 2003, 300, 2055.
https://doi.org/10.1126/science.1084125.Cells 2022, 11, 347 14 of 17
16. Eriksson, M.; Brown, W.T.; Gordon, L.B.; Glynn, M.W.; Singer, J.; Scott, L.; Erdos, M.R.; Robbins, C.M.; Moses, T.Y.; Berglund,
P.; et al. Recurrent de novo point mutations in lamin A cause Hutchinson-Gilford progeria syndrome. Nature 2003, 423, 293–
298. https://doi.org/10.1038/nature01629.
17. Goldman, R.D.; Shumaker, D.K.; Erdos, M.R.; Eriksson, M.; Goldman, A.E.; Gordon, L.B.; Gruenbaum, Y.; Khuon, S.; Mendez,
M.; Varga, R.; et al. Accumulation of mutant lamin A causes progressive changes in nuclear architecture in Hutchinson-Gilford
progeria syndrome. Proc. Natl. Acad. Sci. USA 2004, 101, 8963–8968. https://doi.org/10.1073/pnas.0402943101.
18. Carleton, N.M.; Lee, G.; Madabhushi, A.; Veltri, R.W. Advances in the computational and molecular understanding of the
prostate cancer cell nucleus. J. Cell. Biochem. 2018, 119, 7127–7142. https://doi.org/10.1002/jcb.27156.
19. Pienta, K.J.; Coffey, D.S. Cell motility as a chemotherapeutic target. Cancer Surv. 1991, 11, 255–263.
20. Liddane, A.G.; Holaska, J.M. The Role of Emerin in Cancer Progression and Metastasis. Int. J. Mol. Sci. 2021, 22, 1289.
https://doi.org/10.3390/ijms222011289.
21. Crissman, H.A.; Hirons, G.T. Staining of DNA in live and fixed cells. Methods Cell Biol. 1994, 41, 195–209.
https://doi.org/10.1016/s0091-679x(08)61718-5.
22. Boutorine, A.S.; Novopashina, D.S.; Krasheninina, O.A.; Nozeret, K.; Venyaminova, A.G. Fluorescent probes for nucleic Acid
visualization in fixed and live cells. Molecules 2013, 18, 15357–15397. https://doi.org/10.3390/molecules181215357.
23. van Tienen, F.H.J.; Lindsey, P.J.; Kamps, M.A.F.; Krapels, I.P.; Ramaekers, F.C.S.; Brunner, H.G.; van den Wijngaard, A.; Broers,
J.L. V Assessment of fibroblast nuclear morphology aids interpretation of LMNA variants. Eur. J. Hum. Genet. 2019, 27, 389–399.
https://doi.org/10.1038/s41431-018-0294-0.
24. Kronenberg-Tenga, R.; Tatli, M.; Eibauer, M.; Wu, W.; Shin, J.-Y.; Bonne, G.; Worman, H.J.; Medalia, O. A lamin A/C variant
causing striated muscle disease provides insights into filament organization. J. Cell Sci. 2021, 134, jcs256156.
https://doi.org/10.1242/jcs.256156.
25. Jevtić, P.; Schibler, A.C.; Wesley, C.C.; Pegoraro, G.; Misteli, T.; Levy, D.L. The nucleoporin ELYS regulates nuclear size by
controlling NPC number and nuclear import capacity. EMBO Rep. 2019, 20, e47283. https://doi.org/10.15252/embr.201847283.
26. Takaki, T.; Montagner, M.; Serres, M.P.; Le Berre, M.; Russell, M.; Collinson, L.; Szuhai, K.; Howell, M.; Boulton, S.J.; Sahai, E.;
et al. Actomyosin drives cancer cell nuclear dysmorphia and threatens genome stability. Nat. Commun. 2017, 8, 1–13.
https://doi.org/10.1038/ncomms16013.
27. Carpenter, A.E.; Jones, T.R.; Lamprecht, M.R.; Clarke, C.; Kang, I.H.; Friman, O.; Guertin, D.A.; Chang, J.H.; Lindquist, R.A.;
Moffat, J.; et al. CellProfiler: Image analysis software for identifying and quantifying cell phenotypes. Genome Biol. 2006, 7, R100.
https://doi.org/10.1186/gb-2006-7-10-r100.
28. Antmen, E.; Demirci, U.; Hasirci, V. Amplification of nuclear deformation of breast cancer cells by seeding on micropatterned
surfaces to better distinguish their malignancies. Colloids Surf. B. Biointerfaces 2019, 183, 110402.
https://doi.org/10.1016/j.colsurfb.2019.110402.
29. Larrieu, D.; Britton, S.; Demir, M.; Rodriguez, R.; Jackson, S.P. Chemical inhibition of NAT10 corrects defects of laminopathic
cells. Science 2014, 344, 527–532.
30. Mitruț, R.; Pirici, D.; Stepan, A.E.; Mărgăritescu, C.; Simionescu, C.E.; Kesse, A.M.; Militaru, C. Histopathological and
Morphometric Study of Fibrosis and Nuclear Pleomorphism in Dilated Cardiomyopathy. Curr. Heal. Sci. J. 2019, 45, 73–78.
31. Driscoll, M.K.; Albanese, J.L.; Xiong, Z.-M.; Mailman, M.; Losert, W.; Cao, K. Automated image analysis of nuclear shape: What
can we learn from a prematurely aged cell? Aging 2012, 4, 119–132.
32. Choi, S.; Wang, W.; Ribeiro, A.J.S.; Kalinowski, A.; Gregg, S.Q.; Opresko, P.L.; Niedernhofer, L.J.; Rohde, G.K.; Dahl, K.N.
Computational image analysis of nuclear morphology associated with various nuclear-specific aging disorders. Nucleus 2011,
2, 570–579. https://doi.org/10.4161/nucl.2.6.17798.
33. Tamashunas, A.C.; Tocco, V.J.; Matthews, J.; Zhang, Q.; Atanasova, K.R.; Paschall, L.; Pathak, S.; Ratnayake, R.; Stephens, A.D.;
Luesch, H.; et al. High-throughput gene screen reveals modulators of nuclear shape. Mol. Biol. Cell 2020, 31, 1392–1402.
https://doi.org/10.1091/MBC.E19-09-0520.
34. Nikonenko, A.G.; Bozhok, Y.M. Simple computational technique to quantify nuclear shape asymmetry. Cytometry. A 2015, 87,
309–314. https://doi.org/10.1002/cyto.a.22612.
35. Lukinavičius, G.; Blaukopf, C.; Pershagen, E.; Schena, A.; Reymond, L.; Derivery, E.; Gonzalez-Gaitan, M.; D’Este, E.; Hell, S.W.;
Wolfram Gerlich, D.; et al. SiR-Hoechst is a far-red DNA stain for live-cell nanoscopy. Nat. Commun. 2015, 6, 8497.
https://doi.org/10.1038/ncomms9497.
36. Chu, F.-Y.; Haley, S.C.; Zidovska, A. On the origin of shape fluctuations of the cell nucleus. Proc. Natl. Acad. Sci. USA 2017, 114,
10338–10343. https://doi.org/10.1073/pnas.1702226114.
37. Introini, V.; Kidiyoor, G.R.; Porcella, G.; Foiani, M.; Cicuta, P.; Lagomarsino, M.C. Centripetal nuclear shape fluctuations
associate with chromatin condensation towards mitosis. bioRxiv 2021, 2021.11.25.469847.
https://doi.org/10.1101/2021.11.25.469847.
38. Poulet, A.; Arganda-Carreras, I.; Legland, D.; Probst, A. V; Andrey, P.; Tatout, C. NucleusJ: An ImageJ plugin for quantifying
3D images of interphase nuclei. Bioinformatics 2015, 31, 1144–1146. https://doi.org/10.1093/bioinformatics/btu774.
39. Dubos, T.; Poulet, A.; Gonthier-Gueret, C.; Mougeot, G.; Vanrobays, E.; Li, Y.; Tutois, S.; Pery, E.; Chausse, F.; Probst, A.V.; et
al. Automated 3D bio-imaging analysis of nuclear organization by NucleusJ 2.0. Nucleus 2020, 11, 315–329.
https://doi.org/10.1080/19491034.2020.1845012.Cells 2022, 11, 347 15 of 17
40. Kalinin, A.A.; Allyn-Feuer, A.; Ade, A.; Fon, G.V.; Meixner, W.; Dilworth, D.; Husain, S.S.; de Wett, J.R.; Higgins, G.A.; Zheng,
G.; et al. 3D Shape Modeling for Cell Nuclear Morphological Analysis and Classification. Sci. Rep. 2018, 8, 1–14.
https://doi.org/10.1038/s41598-018-31924-2.
41. Krupina, K.; Goginashvili, A.; Cleveland, D.W. Causes and consequences of micronuclei. Curr. Opin. Cell Biol. 2021, 70, 91–99.
https://doi.org/10.1016/j.ceb.2021.01.004.
42. Guo, X.; Dai, X.; Wu, X.; Zhou, T.; Ni, J.; Xue, J.; Wang, X. Understanding the birth of rupture-prone and irreparable micronuclei.
Chromosoma 2020, 129, 181–200. https://doi.org/10.1007/s00412-020-00741-w.
43. Guo, X.; Ni, J.; Liang, Z.; Xue, J.; Fenech, M.F.; Wang, X. The molecular origins and pathophysiological consequences of
micronuclei: New insights into an age-old problem. Mutat. Res. Rev. Mutat. Res. 2019, 779, 1–35.
https://doi.org/10.1016/j.mrrev.2018.11.001.
44. Zhang, C.-Z.; Spektor, A.; Cornils, H.; Francis, J.M.; Jackson, E.K.; Liu, S.; Meyerson, M.; Pellman, D. Chromothripsis from DNA
damage in micronuclei. Nature 2015, 522, 179–184. https://doi.org/10.1038/nature14493.
45. Terradas, M.; Martín, M.; Genescà, A. Impaired nuclear functions in micronuclei results in genome instability and
chromothripsis. Arch. Toxicol. 2016, 90, 2657–2667. https://doi.org/10.1007/s00204-016-1818-4.
46. De Oliveira Mann, C.C.; Kranzusch, P.J. cGAS Conducts Micronuclei DNA Surveillance. Trends Cell Biol. 2017, 27, 697–698.
https://doi.org/10.1016/j.tcb.2017.08.007.
47. Mackenzie, K.J.; Carroll, P.; Martin, C.-A.; Murina, O.; Fluteau, A.; Simpson, D.J.; Olova, N.; Sutcliffe, H.; Rainger, J.K.; Leitch,
A.; et al. cGAS surveillance of micronuclei links genome instability to innate immunity. Nature 2017, 548, 461–465.
https://doi.org/10.1038/nature23449.
48. Maass, K.K.; Rosing, F.; Ronchi, P.; Willmund, K. V; Devens, F.; Hergt, M.; Herrmann, H.; Lichter, P.; Ernst, A. Altered nuclear
envelope structure and proteasome function of micronuclei. Exp. Cell Res. 2018, 371, 353–363.
https://doi.org/10.1016/j.yexcr.2018.08.029.
49. Holland, N.; Bolognesi, C.; Kirsch-Volders, M.; Bonassi, S.; Zeiger, E.; Knasmueller, S.; Fenech, M. The micronucleus assay in
human buccal cells as a tool for biomonitoring DNA damage: The HUMN project perspective on current status and knowledge
gaps. Mutat. Res. 2008, 659, 93–108. https://doi.org/10.1016/j.mrrev.2008.03.007.
50. Malhas, A.; Goulbourne, C.; Vaux, D.J. The nucleoplasmic reticulum: Form and function. Trends Cell Biol. 2011, 21, 362–373.
https://doi.org/10.1016/j.tcb.2011.03.008.
51. Drozdz, M.M.; Vaux, D.J. Shared mechanisms in physiological and pathological nucleoplasmic reticulum formation. Nucleus
2017, 8, 34–45. https://doi.org/10.1080/19491034.2016.1252893.
52. Echevarria, W.; Leite, M.F.; Guerra, M.T.; Zipfel, W.R.; Nathanson, M.H. Regulation of calcium signals in the nucleus by a
nucleoplasmic reticulum. Nat. Cell Biol. 2003, 5, 440–446. https://doi.org/10.1038/ncb980.
53. Nalaskowski, M.M.; Fliegert, R.; Ernst, O.; Brehm, M.A.; Fanick, W.; Windhorst, S.; Lin, H.; Giehler, S.; Hein, J.; Lin, Y.N.; et al.
Human inositol 1,4,5-trisphosphate 3-kinase isoform B (IP3KB) is a nucleocytoplasmic shuttling protein specifically enriched at
cortical actin filaments and at invaginations of the nuclear envelope. J. Biol. Chem. 2011, 286, 4500–4510.
https://doi.org/10.1074/jbc.M110.173062.
54. Lee, S.H.; Hadipour-Lakmehsari, S.; Miyake, T.; Gramolini, A.O. Three-dimensional imaging reveals endo(Sarco)plasmic
reticulum-containing invaginations within the nucleoplasm of muscle. Am. J. Physiol.-Cell Physiol. 2018, 314, C257–C267.
https://doi.org/10.1152/ajpcell.00141.2017.
55. Goulbourne, C.N.; Malhas, A.N.; Vaux, D.J. The induction of a nucleoplasmic reticulum by prelamin A accumulation requires
CTP: Phosphocholine cytidylyltransferase-α. J. Cell Sci. 2011, 124, 4253–4266. https://doi.org/10.1242/jcs.091009.
56. Jorgens, D.M.; Inman, J.L.; Wojcik, M.; Robertson, C.; Palsdottir, H.; Tsai, W.T.; Huang, H.; Bruni-Cardoso, A.; López, C.S.;
Bissell, M.J.; et al. Deep nuclear invaginations are linked to cytoskeletal filaments—Integrated bioimaging of epithelial cells in
3D culture. J. Cell Sci. 2017, 130, 177–189. https://doi.org/10.1242/jcs.190967.
57. Paonessa, F.; Evans, L.D.; Solanki, R.; Larrieu, D.; Wray, S.; Hardy, J.; Jackson, S.P.; Livesey, F.J. Microtubules Deform the
Nuclear Membrane and Disrupt Nucleocytoplasmic Transport in Tau-Mediated Frontotemporal Dementia. Cell Rep. 2019, 26,
582–593. https://doi.org/10.1016/j.celrep.2018.12.085.
58. Drozdz, M.M.; Jiang, H.; Pytowski, L.; Grovenor, C.; Vaux, D.J. Formation of a nucleoplasmic reticulum requires de novo
assembly of nascent phospholipids and shows preferential incorporation of nascent lamins. Sci. Rep. 2017, 7, 1–14.
https://doi.org/10.1038/s41598-017-07614-w.
59. Pytowski, L.; Drozdz, M.M.; Jiang, H.; Hernandez, Z.; Kumar, K.; Knott, E.; Vaux, D.J. Nucleoplasmic reticulum formation in
human endometrial cells is steroid hormone responsive and recruits nascent components. Int. J. Mol. Sci. 2019, 20, 5839.
https://doi.org/10.3390/ijms20235839.
60. Johnson, N.; Krebs, M.; Boudreau, R.; Giorgi, G.; LeGros, M.; Larabell, C. Actin-filled nuclear invaginations indicate degree of
cell de-differentiation. Differentiation 2003, 71, 414–424. https://doi.org/10.1046/j.1432-0436.2003.7107003.x.
61. Bussolati, G.; Marchiò, C.; Gaetano, L.; Lupo, R.; Sapino, A. Pleomorphism of the nuclear envelope in breast cancer: A new
approach to an old problem. J. Cell. Mol. Med. 2008, 12, 209–218. https://doi.org/10.1111/j.1582-4934.2007.00176.x.
62. Frost, B.; Bardai, F.H.; Feany, M.B. Lamin Dysfunction Mediates Neurodegeneration in Tauopathies. Curr. Biol. 2016, 26, 129–
136. https://doi.org/10.1016/j.cub.2015.11.039.You can also read