COVID-19 Pneumonia Diagnosis Using a Simple 2D Deep Learning Framework With a Single Chest CT Image: Model Development and Validation
←
→
Page content transcription
If your browser does not render page correctly, please read the page content below
JOURNAL OF MEDICAL INTERNET RESEARCH                                                                                                               Ko et al

     Original Paper

     COVID-19 Pneumonia Diagnosis Using a Simple 2D Deep
     Learning Framework With a Single Chest CT Image: Model
     Development and Validation

     Hoon Ko1*, MSc; Heewon Chung1*, MSc; Wu Seong Kang2*, MD, PhD; Kyung Won Kim3, MD; Youngbin Shin3,
     MSc; Seung Ji Kang4, MD; Jae Hoon Lee5, MD; Young Jun Kim5, MD; Nan Yeol Kim2, MD, PhD; Hyunseok Jung6,
     MD; Jinseok Lee1, PhD
     1
      Department of Biomedical Engineering, Wonkwang University College of Medicine, Iksan-si, Republic of Korea
     2
      Department of Trauma Surgery, Wonkwang University Hospital, Iksan-si, Republic of Korea
     3
      Department of Radiology and Research Institute of Radiology, Asan Image Metrics, Clinical Trial Center, Asan Medical Center, University of Ulsan
     College of Medicine, Seoul, Republic of Korea
     4
      Department of Internal Medicine, Chonnam National University Medical School, Gwangju-si, Republic of Korea
     5
      Department of Internal Medicine, Wonkwang University Hospital, Iksan-si, Republic of Korea
     6
      Department of Radiology, Wonkwang University Hospital, Iksan-si, Republic of Korea
     *
      these authors contributed equally

     Corresponding Author:
     Jinseok Lee, PhD
     Department of Biomedical Engineering
     Wonkwang University College of Medicine
     460 Iksan-daero
     Iksan-si, 54538
     Republic of Korea
     Phone: 82 63 850 5114
     Email: gonasago@wku.ac.kr

     Abstract
     Background: Coronavirus disease (COVID-19) has spread explosively worldwide since the beginning of 2020. According to
     a multinational consensus statement from the Fleischner Society, computed tomography (CT) is a relevant screening tool due to
     its higher sensitivity for detecting early pneumonic changes. However, physicians are extremely occupied fighting COVID-19
     in this era of worldwide crisis. Thus, it is crucial to accelerate the development of an artificial intelligence (AI) diagnostic tool
     to support physicians.
     Objective: We aimed to rapidly develop an AI technique to diagnose COVID-19 pneumonia in CT images and differentiate it
     from non–COVID-19 pneumonia and nonpneumonia diseases.
     Methods: A simple 2D deep learning framework, named the fast-track COVID-19 classification network (FCONet), was
     developed to diagnose COVID-19 pneumonia based on a single chest CT image. FCONet was developed by transfer learning
     using one of four state-of-the-art pretrained deep learning models (VGG16, ResNet-50, Inception-v3, or Xception) as a backbone.
     For training and testing of FCONet, we collected 3993 chest CT images of patients with COVID-19 pneumonia, other pneumonia,
     and nonpneumonia diseases from Wonkwang University Hospital, Chonnam National University Hospital, and the Italian Society
     of Medical and Interventional Radiology public database. These CT images were split into a training set and a testing set at a
     ratio of 8:2. For the testing data set, the diagnostic performance of the four pretrained FCONet models to diagnose COVID-19
     pneumonia was compared. In addition, we tested the FCONet models on an external testing data set extracted from embedded
     low-quality chest CT images of COVID-19 pneumonia in recently published papers.
     Results: Among the four pretrained models of FCONet, ResNet-50 showed excellent diagnostic performance (sensitivity 99.58%,
     specificity 100.00%, and accuracy 99.87%) and outperformed the other three pretrained models in the testing data set. In the
     additional external testing data set using low-quality CT images, the detection accuracy of the ResNet-50 model was the highest
     (96.97%), followed by Xception, Inception-v3, and VGG16 (90.71%, 89.38%, and 87.12%, respectively).

     http://www.jmir.org/2020/6/e19569/                                                                   J Med Internet Res 2020 | vol. 22 | iss. 6 | e19569 | p. 1
                                                                                                                        (page number not for citation purposes)
XSL• FO
RenderX
JOURNAL OF MEDICAL INTERNET RESEARCH                                                                                                       Ko et al

     Conclusions: FCONet, a simple 2D deep learning framework based on a single chest CT image, provides excellent diagnostic
     performance in detecting COVID-19 pneumonia. Based on our testing data set, the FCONet model based on ResNet-50 appears
     to be the best model, as it outperformed other FCONet models based on VGG16, Xception, and Inception-v3.

     (J Med Internet Res 2020;22(6):e19569) doi: 10.2196/19569

     KEYWORDS
     COVID-19; deep learning; convolutional neural networks, transfer learning; chest CT; CT; neural network; pneumonia; artificial
     intelligence; diagnosis; pneumonia; scan

                                                                          specificity were 83% (67%-97%) and 96.5% (7%-100%),
     Introduction                                                         respectively [11].
     The coronavirus disease (COVID-19) pandemic is currently a           The use of artificial intelligence (AI) may help overcome these
     global health crisis; more than 1,700,000 cases had been             issues, as AI can help maintain diagnostic radiology support in
     confirmed worldwide and more than 100,000 deaths had                 real time and with increased sensitivity [8,12]. In this era of
     occurred at the time of writing this paper [1]. COVID-19, an         worldwide crisis, it is crucial to accelerate the development of
     infection caused by severe acute respiratory syndrome                AI techniques to detect COVID-19 and to differentiate it from
     coronavirus 2 (SARS-CoV-2), is highly contagious and has             non–COVID-19 pneumonia and nonpneumonia diseases in CT
     spread rapidly worldwide. In severe cases, COVID-19 can lead         images. Therefore, we aimed to rapidly develop an AI technique
     to acute respiratory distress, multiple organ failure, and           using all available CT images from our institution as well as
     eventually death. Countries are racing to slow the spread of the     publicly available data.
     virus by testing and treating patients in the early stage as well
     as quarantining people who are at high risk of exposure due to       Methods
     close contact with patients with confirmed infection. In addition,
     early diagnosis and aggressive treatment are crucial to saving       Data Sets and Imaging Protocol
     the lives of patients with confirmed infection [2].                  This study was approved by the institutional review boards of
     COVID-19 is typically confirmed by viral nucleic acid detection      Wonkwang University Hospital (WKUH) and Chonnam
     using reverse transcription–polymerase chain reaction (RT-PCR)       National University Hospital (CNUH). Informed consent was
     [3]. However, the sensitivity of RT-PCR may not be sufficiently      waived. Table 1 summarizes the training, testing, and additional
     high; it ranges from 37% to 71% according to early reports           validation data sets. In this study, we initially collected data
     [4-6]. Thus, RT-PCR can afford a substantial number of false         from 3993 chest CT images, which were categorized into
     negative results due to inadequate specimen collection, improper     COVID-19, other pneumonia, and nonpneumonia disease
     extraction of nucleic acid from the specimen, or collection at a     groups.
     too-early stage of infection. A chest computed tomography (CT)       For the COVID-19 data group, we used a total of 1194 chest
     scan can be used as an important tool to diagnose COVID-19           CT images: 673 chest CT images (56.3%, from 13 patients)
     in cases with false negative results by RT-PCR [6-9].                from CNUH, 421 images (35.3%, from 7 patients) from WKUH,
     Recently, a multinational consensus statement from the               and 100 images (83.8%, 60 patients) from the Italian Society
     Fleischner Society was issued to guide chest imaging during          of Medical and Interventional Radiology (SIRM) public database
     the COVID-19 pandemic in different clinical settings [6].            [13]. The 20 patients from CNUH and WKUH included 9 male
     According to this consensus statement, in a setting such as South    patients and 11 female patients, with an average age of 59.6
     Korea, where detecting patients at an early stage and isolating      years (SD 17.2). Regarding the COVID-19 data from WKUH
     all patients and people with high risk of exposure is essential,     and CNUH, all the patients with COVID-19 tested positive for
     CT is a relevant screening tool due to its greater sensitivity for   the virus by RT-PCR viral detection, and the CT images were
     detecting early pneumonic changes. CT can also contribute to         acquired between December 31, 2019 and March 25, 2020. The
     the management and triage of the disease by detecting severe         median period from symptom onset to the first chest CT
     cases. In addition, chest CT is noninvasive and is easy to           examination was 8 days (range 2-20 days). The most common
     perform in an equipped facility.                                     symptoms were fever (75%) and myalgia (30%). In addition,
                                                                          according to previous studies related to COVID-19 by Zhao’s
     However, radiologic diagnostic support is not maintained 24          group [14] from January 19 and March 25, 2020, 264
     hours per day in many institutions [10]. In addition, CT may         low-quality chest CT images were used as additional testing
     show similar imaging features between COVID-19 and other             data. In summary, 1194 COVID-19 images (80 patients) from
     types of pneumonia, thus hampering correct diagnosis by              WKUH, CNUH, and SRIM were split into the training data set
     radiologists. Indeed, in a study that evaluated radiologists’        (955 images, 80.0%) and testing data set (239 images, 20.0%).
     performance in differentiating COVID-19 from other viral             For the additional testing, 264 COVID-19 images (264 patients)
     pneumonia, the median values and ranges of sensitivity and           from the low-quality image data set were used.

     http://www.jmir.org/2020/6/e19569/                                                           J Med Internet Res 2020 | vol. 22 | iss. 6 | e19569 | p. 2
                                                                                                                (page number not for citation purposes)
XSL• FO
RenderX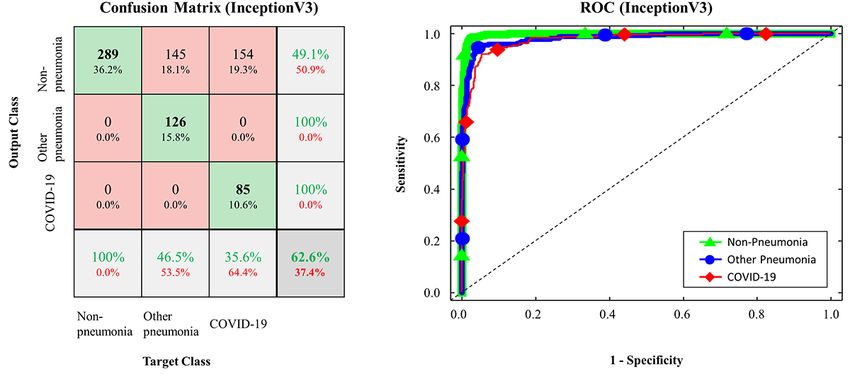
JOURNAL OF MEDICAL INTERNET RESEARCH                                                                                                                Ko et al

     Table 1. Summary of the training, testing, and additional testing data sets (N=4257).
         Data type, data source, and data group                                  Training images, n (%)               Testing images, n (%)
         Training and testing data

             WKUHa
                 COVID-19 pneumonia (n=421)                                      337 (80.0)                           84 (20.0)
                 Other pneumonia (n=1357)                                        1086 (80.0)                          271 (20.0)
                 Nonpneumonia and normal lung (n=998)                            798 (80.0)                           200 (20.0)
                 Lung cancer (n=444)                                             355 (80.0)                           89 (20.0)

             CNUHb
                 COVID-19 pneumonia (n=673)                                      538 (80.0)                           135 (20.0)

             SIRMc
                 COVID-19 pneumonia (n=100)                                      80 (80.0)                            20 (20.0)
         Additional external testing data
             Low-quality CT images from papers

                 COVID-19d pneumonia (n=264)                                     0 (0.0)                              264 (100.0)

     a
         WKUH: Wonkwang University Hospital.
     b
         CNUH: Chonnam National University Hospital.
     C
         SIRM: Italian Society of Medical and Interventional Radiology.
     d
         COVID-19: coronavirus disease.

     For the other pneumonia data group, we selected 1357 chest                  (3.0%) were viral influenza positive by RT-PCR, and 76 (76.0%)
     CT images from 100 patients diagnosed with non–COVID-19                     were negative. Regarding the imaging protocols, each volumetric
     pneumonia at WKUH between September 1, 2019, and March                      examination contained approximately 51 to 1094 CT images,
     30, 2020. The average age of this group was 62.5 years (SD                  with varying slice thicknesses from 0.5 millimeters to 3 mm.
     17.2), with 68 male and 32 female patients. For the                         The reconstruction matrix was 512×512 pixels, with in-plane
     nonpneumonia data group, we also selected 1442 chest CT                     pixel spatial resolution from 0.29×0.29 to 0.98×0.98 square
     images from 126 patients who had no lung parenchymal disease                millimeters.
     or lung cancers at WKUH between January 2009 and December
                                                                                 The data from WKUH, CNUH, and SIRM were randomly split
     2014. The average age of these patients was 47 years (SD 17),
                                                                                 with a ratio of 8:2 into a training set and a testing set,
     with 63 male patients (721/1442 images, 50.0%) and 63 female
                                                                                 respectively, in a stratified fashion. In addition, the data for each
     patients (721/1442 images, 50.0%). The patient demographic
                                                                                 group (WKUH, CNUH, and SIRM) were spread over different
     statistics of the COVID-19 and other pneumonia groups are
                                                                                 splits with a ratio of 8:2. The training data set was then further
     summarized in Table 2. In this table, other pneumonia (not
                                                                                 separated into sets used for training the model (80% of the
     COVID-19) was categorized into two different types based on
                                                                                 training set) and for internal validation (20% of the training set).
     clinical characteristics: 68 cases of community-acquired
                                                                                 The testing set was used only for independent testing of the
     pneumonia (onset 48 hours before hospital admission) and 32
                                                                                 developed models and was never used for training the model
     cases of hospital-acquired pneumonia (onset 48-72 hours after
                                                                                 or for internal validation. Furthermore, we tested the trained
     hospital admission). Of these other pneumonia patients, 24/100
                                                                                 model with the additional external validation data set of
     (24.0%) received laboratory confirmation of the etiology, 21
                                                                                 low-quality images to evaluate the external generalizability of
     (21.0%) were confirmed to be bacterial culture positive, 3
                                                                                 the model.

     http://www.jmir.org/2020/6/e19569/                                                                    J Med Internet Res 2020 | vol. 22 | iss. 6 | e19569 | p. 3
                                                                                                                         (page number not for citation purposes)
XSL• FO
RenderX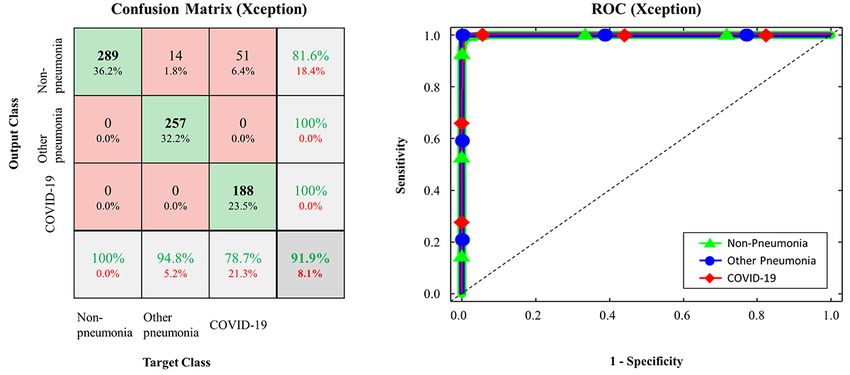
JOURNAL OF MEDICAL INTERNET RESEARCH                                                                                                        Ko et al

     Table 2. Demographic data of patients with COVID-19 and other pneumonia.

         Characteristic                                               COVID-19a pneumonia (n=20)    Other pneumonia (n=100)                  P value
         Age (years), mean (SD)                                       59.6 (17.2)                   60.1 (17.1)                              .91
         Male sex, n (%)                                              9 (45.0)                      68 (68.0)                                .12
         Community-acquired pneumonia, n (%)                          20 (100.0)                    68 (68.0)                                .007
         Hospital-acquired pneumonia, n (%)                           0 (0.0)                       32 (32.0)
         Microbiological study, n (%)

             COVID-19 positive (RT-PCRb)                              20 (100.0)                    0 (0.0)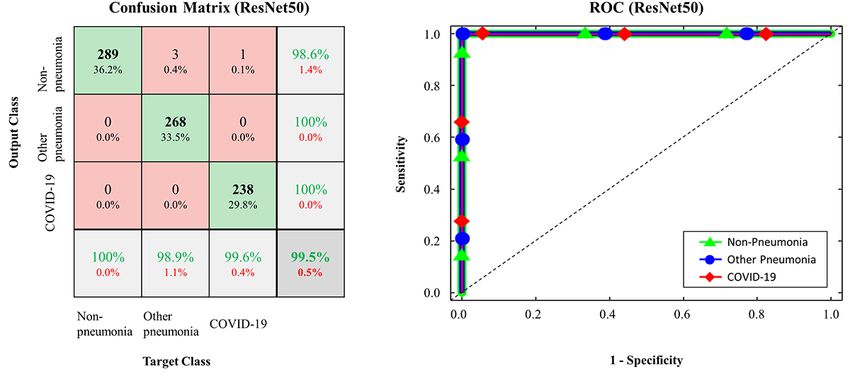
JOURNAL OF MEDICAL INTERNET RESEARCH                                                                                                            Ko et al

     Table 3. Augmented images for training in each group (N=31,940).
         Data source and group                                              Augmented images for training, n (%)

         WKUHxa

             COVID-19b pneumonia                                            3370 (10.6)

             Other pneumonia                                                10,860 (34.0)
             Nonpneumonia and normal lung                                   7890 (24.7)
             Lung cancer                                                    3550 (11.1)

         CNUHc
             COVID-19 pneumonia                                             5380 (16.8)
                d
         SIRM
             COVID-19 pneumonia                                             800 (2.5)

     a
         WKUH: Wonkwang University Hospital.
     b
         COVID-19: coronavirus disease
     c
         CNUH: Chonnam National University Hospital.
     d
         SIRM: Italian Society of Medical and Interventional Radiology.

                                                                             Inception-v3 [19], and Xception [20]. Transfer learning is a
     The Fast-Track COVID-19 Classification Network for                      popular method in computer vision because it enables an
     COVID-19 Classification                                                 accurate model to be built in a short time [21]. With transfer
     We developed a simple 2D deep learning framework based on               learning, instead of starting the learning process from an optimal
     a single chest CT image for the classification of COVID-19              model search, one can start it from patterns that were learned
     pneumonia, other pneumonia, and nonpneumonia, named the                 when solving a different problem. To minimize the training
     fast-track COVID-19 classification network (FCONet; Figure              time, we initially used the predefined weights for each CNN
     1). FCONet was developed by transfer learning based on one              architecture, which were further updated through the learning
     of the following four pretrained convolutional neural network           process of classification of COVID-19 pneumonia, other
     (CNN) models as a backbone: VGG16 [17], ResNet-50 [18],                 pneumonia, and nonpneumonia.
     Figure 1. Scheme of FCONet, a 2D deep learning framework based on a single chest CT image for the classification of COVID-19 pneumonia, other
     pneumonia, and non-pneumonia. COVID-19: coronavirus disease.

                                                                             image based on the extracted features. In our pretrained model
     Input Layer                                                             layers, we retained the convolutional base and removed the
     After the simple preprocessing stage, in the input layer, we            classifier, which was replaced by another classifier for
     arranged three channels (256×256×3 pixels) by copying the               COVID-19, other pneumonia, or nonpneumonia.
     one-channel normalized image. The three-channel images were
     fed into the pretrained model layers.                                   Additional Layers
                                                                             The activations from the pretrained model layers were fed into
     Pretrained Model Layers                                                 the additional layers. The layers acted as classifiers for
     A pretrained model is a model that was trained on a large               COVID-19 pneumonia, other pneumonia, and nonpneumonia.
     benchmark data set to solve a similar problem to the one we             In the additional layers, we first flattened the activations and
     want to solve. In the pretrained model layers, we included one          connected two fully connected layers; one of the layers consisted
     of the four pretrained models (VGG16, ResNet-50, Inception-v3,          of 32 nodes, and the other consisted of three nodes.
     and Xception). Each model comprises two parts: a convolutional          Subsequently, the three activations from the second fully
     base and a classifier. The convolutional base is composed of a          connected layer were fed into a SoftMax layer, which provided
     stack of convolutional and pooling layers to generate features
     from the images. The role of the classifier is to categorize the
     http://www.jmir.org/2020/6/e19569/                                                                J Med Internet Res 2020 | vol. 22 | iss. 6 | e19569 | p. 5
                                                                                                                     (page number not for citation purposes)
XSL• FO
RenderX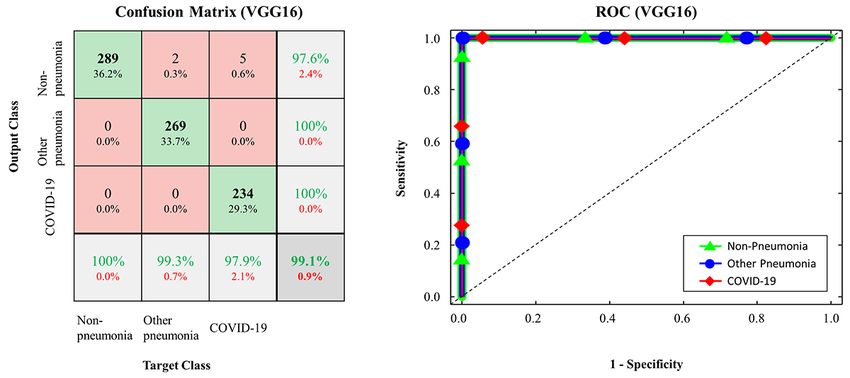
JOURNAL OF MEDICAL INTERNET RESEARCH                                                                                                      Ko et al

     the probability for each of COVID-19, other pneumonia, and          Here, non–COVID-19 testing data include other pneumonia
     nonpneumonia.                                                       and nonpneumonia. Note that the same calculations were applied
                                                                         to the other pneumonia and nonpneumonia testing data as
     Implementation
     We implemented FCONet using the TensorFlow package, which
     provides a Python application programming interface (API) for
     tensor manipulation. We also used Keras as the official front
     end of TensorFlow. We trained the models with the Adam
     optimizer [22] and the categorical cross-entropy cost function
     with a learning rate of 0.0001 and a batch size of 32 on a
     GeForce GTX 1080 Ti graphics processing unit (NVIDIA). For
     the performance evaluation, 5-fold cross-validation was
     performed to confirm the generalization ability. The training
     data set (N=31,940) was randomly shuffled and divided into
     five equal groups in a stratified manner. Subsequently, four
     groups were selected to train the model, and the remaining group
     was used for validation. This process was repeated five times
     by shifting the internal validation group. Next, we averaged the
                                                                         We also plotted the receiver operating characteristic (ROC)
     mean validation costs of the five internal validation groups
                                                                         curve and calculated the area under the curve (AUC) for each
     according to each epoch and found the optimal epoch that
                                                                         of the four different models. Additionally, statistical analysis
     provides the lowest validation cost. Then, we retrained the model
                                                                         was performed using MATLAB (R2013b). Analysis of variance
     using the entire training data set with the optimal epoch. The
                                                                         (ANOVA) was used to compare differences among COVID-19
     testing data set was evaluated only after the model was
                                                                         pneumonia, non–COVID-19 pneumonia, and nonpneumonia
     completely trained using the training data set. This holdout
                                                                         groups. A P value less than .001 was considered to indicate
     method provides an unbiased evaluation of the final model by
                                                                         statistical significance.
     avoiding overfitting to the training data set.
     Performance Evaluation and Statistical Evaluation                   Results
     For each of the different four pretrained models (VGG16,            The performance of the FCONet models based on the four
     ResNet-50, Inception-v3, and Xception) in FCONet, we                pretrained models in the classification of COVID-19 pneumonia,
     evaluated the classification performance based on sensitivity,      other pneumonia, and nonpneumonia is summarized in Table
     specificity, and accuracy. More specifically, we calculated true    4. We compared the metric values of sensitivity (%), specificity
     positives (TP), false positives (FP), true negatives (TN), and      (%), and accuracy (%) as well as the AUCs of the four FCONet
     false negatives (FN) based on the groups of COVID-19                models based on VGG16, ResNet-50, Inception-v3, and
     pneumonia, other pneumonia, and nonpneumonia. For each              Xception. Based on the testing data, the FCONet models based
     group, we expressed measure metrics with the subscripts covid       on ResNet-50, VGG16, and Xception showed excellent
     for COVID-19, other for other pneumonia, and none for               classification performance; all these models provided AUC
     nonpneumonia, as                                                    values ranging from 0.99 to 1.00. More specifically, with
                                                                         ResNet-50, the sensitivity, specificity, and accuracy for
                                                                         classifying COVID-19 pneumonia were 99.58%, 100%, and
                                                                         99.87%, respectively. With VGG16, the sensitivity, specificity,
                                                                         and accuracy for classifying COVID-19 pneumonia were 100%,
                                                                         99.64%, and 99.75%, respectively. With Xception, the
                                                                         sensitivity, specificity, and accuracy for COVID-19 pneumonia
                                                                         classification were 97.91%, 99.29%, and 98.87%, respectively.
                                                                         For other pneumonia and nonpneumonia, the sensitivity,
     where TPcovid is the number of COVID-19 testing data correctly
                                                                         specificity, and accuracy ranged from 97% to 100% when
     classified as COVID-19, TNcovid is the number of                    ResNet-50, VGG16, or Xception was used as the backbone in
     non–COVID-19 testing data correctly classified as                   FCONet. On the other hand, Inception-v3–based FCONet
     non–COVID-19, FPcovid is the number of non–COVID-19                 provided relatively low sensitivity, specificity, and accuracy
     testing data misclassified as COVID-19, and FNcovid is the          values for all groups of COVID-19 pneumonia, other
     number of COVID testing data misclassified as non–COVID-19.         pneumonia, and nonpneumonia (P
JOURNAL OF MEDICAL INTERNET RESEARCH Ko et al
Table 4. Performance of the FCONet frameworks based on the four pretrained models on the testing data set.
Model and data group Sensitivity, % Specificity, % Accuracy, % AUCa P value
ResNet-50JOURNAL OF MEDICAL INTERNET RESEARCH Ko et al
Figure 3. Confusion matrix and ROC curve in FCONet using VGG16; COVID-19: coronavirus disease; ROC: receiver operating characteristic.
Figure 4. Confusion matrix and ROC curve in FCONet using Xception; COVID-19: coronavirus disease; ROC: receiver operating characteristic.
Figure 5. Confusion matrix and ROC curve in FCONet using Inception-v3; COVID-19: coronavirus disease; ROC: receiver operating characteristic.
http://www.jmir.org/2020/6/e19569/ J Med Internet Res 2020 | vol. 22 | iss. 6 | e19569 | p. 8
(page number not for citation purposes)
XSL• FO
RenderXJOURNAL OF MEDICAL INTERNET RESEARCH Ko et al
Table 5. Performance of each deep learning model on the additional external validation data set of COVID-19 pneumonia images.
Model Detection accuracy, %
ResNet-50 96.97
VGG16 87.12
Xception 90.71
Inception-v3 89.38
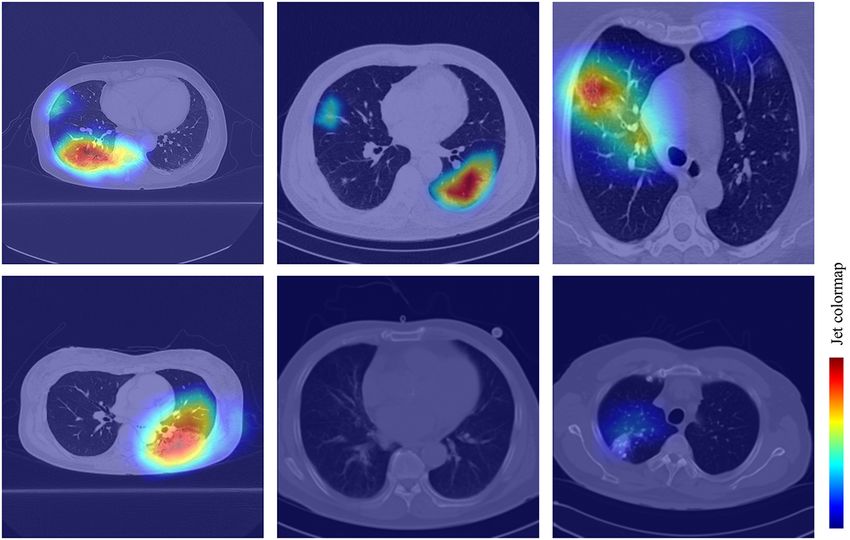
To improve the interpretability of our model, we used the shown in examples from WKUH (Figure 6, top left), CNUH
gradient-weighted class activation mapping (Grad-CAM) (Figure 6, top middle) and SIRM (Figure 6, top right). For the
method [23] to visualize the important regions leading to the other pneumonia image groups, the heatmap demonstrated some
decision of FCONet. The model fully generates this localization suspected regions inside the lung area; the intensity was lower
map without the mapping annotation. The heatmaps (Figure 6) than that of the regions in the COVID-19 image group (Figure
show the suspected regions for the examples of COVID-19, 6, bottom left). For the healthy image group, there was no
other pneumonia, and nonpneumonia. The heatmaps are standard heatmap corresponding to the suspected regions (Figure 6,
jet colormaps and are overlapped on the original image, where bottom middle). For the lung cancer images, the heatmap
red color highlights the activation region associated with the indicated some suspected regions inside the lung area; however,
predicted class. More specifically, for the COVID-19 image the intensity was also lower than that of the regions in the
group, the heatmap strongly indicated the suspected regions, as COVID-19 pneumonia group (Figure 6, bottom right).
Figure 6. Confusion matrice and ROC curve in FCONet using VGG16; COVID-19: coronavirus disease; ROC: receiver operating characteristic.
To test the generalizability of our proposed framework, we also 98.67%, respectively (PJOURNAL OF MEDICAL INTERNET RESEARCH Ko et al
Table 6. Performance of the FCONet framework based on institutional data split for COVID-19 data.
Model and data group Sensitivity, % Specificity, % Accuracy, % AUCa P value
ResNet-50JOURNAL OF MEDICAL INTERNET RESEARCH Ko et al
Despite limited resources and time, we were able to generate a Limitations and Future Work
deep learning model to detect COVID-19 from chest CT with Our study has several limitations. Firstly, our AI models were
excellent diagnostic accuracy. To date, a few papers have been validated mainly using a split testing data set. Thus, the testing
published on AI models for detecting COVID-19 in chest CT data set was obtained from the same sources as the training data
images [6]. An AI model named COVNet was trained using set. This may raise issues of generalizability and overfitting of
4356 CT images from six hospitals in China. It showed 90% our models [32,33]. Indeed, the detection accuracy of our model
sensitivity (95% CI 83%-94%) and 96% specificity (95% CI decreased slightly for the external validation data set using chest
93%-98%) in detecting COVID-19, which is comparable with CT images from published papers. However, the initial goal
our results. However, we cannot compare our FCONet to was to incorporate a deep learning model in our emergent
COVNet because the training and testing data sets are different. clinical setting as a supporting tool. In the near future, we will
Although chest radiography is the most commonly used imaging train our model using CT images from various institutions and
tool to detect COVID-19, its sensitivity is lower than that of countries. Secondly, we used a relatively small amount of data
CT [30]. However, in this pandemic period, clinicians may to train the deep learning models. Thus, we will establish a
hesitate to perform chest CT due to limited resources such as sustainable AI training system that can continue to train our
CT scanners and radiologists as well as contamination of CT model using prospectively collected CT images.
scanners [31]. In our hospitals (WKUH and CNUH), we recently
Conclusions
dedicated a mobile CT scanner exclusively to COVID-19
patients to alleviate the physical and mental stress of medical We described FCONet, a simple 2D deep learning framework
staff. We believe that incorporating an AI model to detect based on a single chest CT image, as a diagnostic aid that
suspicious lesions of COVID-19 pneumonia can improve the provides excellent diagnostic performance to diagnose
workflow by providing rapid diagnostic support. COVID-19 pneumonia. The FCONet model based on ResNet-50
appears to be the best model, outperforming other models based
on VGG16, Xception, and Inception-v3.
Acknowledgments
This work was partially supported by the National Research Foundation of Korea, Ministry of Science, ICT, and Future Planning,
through the Basic Science Research Program (grant number: NRF-2020R1A2C1014829), and from the Korea Health Industry
Development Institute (grant number: HI18C2383 and HI18C1216).
Conflicts of Interest
None declared.
References
1. Coronavirus disease 2019 (COVID-19) Situation Report – 84. World Health Organization. 2020 Apr 13. URL: https://www.
who.int/docs/default-source/coronaviruse/situation-reports/20200413-sitrep-84-covid-19.pdf?sfvrsn=44f511ab_2 [accessed
2020-06-23]
2. Bhatraju PK, Ghassemieh BJ, Nichols M, Kim R, Jerome KR, Nalla AK, et al. Covid-19 in Critically Ill Patients in the
Seattle Region - Case Series. N Engl J Med 2020 May 21;382(21):2012-2022 [FREE Full text] [doi:
10.1056/NEJMoa2004500] [Medline: 32227758]
3. Loeffelholz MJ, Tang Y. Laboratory diagnosis of emerging human coronavirus infections - the state of the art. Emerg
Microbes Infect 2020 Dec;9(1):747-756 [FREE Full text] [doi: 10.1080/22221751.2020.1745095] [Medline: 32196430]
4. Li Y, Yao L, Li J, Chen L, Song Y, Cai Z, et al. Stability issues of RT-PCR testing of SARS-CoV-2 for hospitalized patients
clinically diagnosed with COVID-19. J Med Virol 2020 Jul;92(7):903-908 [FREE Full text] [doi: 10.1002/jmv.25786]
[Medline: 32219885]
5. Ai T, Yang Z, Hou H, Zhan C, Chen C, Lv W, et al. Correlation of Chest CT and RT-PCR Testing in Coronavirus Disease
2019 (COVID-19) in China: A Report of 1014 Cases. Radiology 2020 Feb 26:200642 [FREE Full text] [doi:
10.1148/radiol.2020200642] [Medline: 32101510]
6. Rubin GD, Ryerson CJ, Haramati LB, Sverzellati N, Kanne JP, Raoof S, et al. The Role of Chest Imaging in Patient
Management during the COVID-19 Pandemic: A Multinational Consensus Statement from the Fleischner Society. Radiology
2020 Jul;296(1):172-180 [FREE Full text] [doi: 10.1148/radiol.2020201365] [Medline: 32255413]
7. Vashist SK. In Vitro Diagnostic Assays for COVID-19: Recent Advances and Emerging Trends. Diagnostics (Basel) 2020
Apr 05;10(4):202 [FREE Full text] [doi: 10.3390/diagnostics10040202] [Medline: 32260471]
8. Li D, Wang D, Dong J, Wang N, Huang H, Xu H, et al. False-Negative Results of Real-Time Reverse-Transcriptase
Polymerase Chain Reaction for Severe Acute Respiratory Syndrome Coronavirus 2: Role of Deep-Learning-Based CT
Diagnosis and Insights from Two Cases. Korean J Radiol 2020 Apr;21(4):505-508 [FREE Full text] [doi:
10.3348/kjr.2020.0146] [Medline: 32174053]
http://www.jmir.org/2020/6/e19569/ J Med Internet Res 2020 | vol. 22 | iss. 6 | e19569 | p. 11
(page number not for citation purposes)
XSL• FO
RenderXJOURNAL OF MEDICAL INTERNET RESEARCH Ko et al
9. Long C, Xu H, Shen Q, Zhang X, Fan B, Wang C, et al. Diagnosis of the Coronavirus disease (COVID-19): rRT-PCR or
CT? Eur J Radiol 2020 May;126:108961 [FREE Full text] [doi: 10.1016/j.ejrad.2020.108961] [Medline: 32229322]
10. Mossa-Basha M, Medverd J, Linnau K, Lynch JB, Wener MH, Kicska G, et al. Policies and Guidelines for COVID-19
Preparedness: Experiences from the University of Washington. Radiology 2020 Apr 08:201326 [FREE Full text] [doi:
10.1148/radiol.2020201326] [Medline: 32267209]
11. Bai HX, Hsieh B, Xiong Z, Halsey K, Choi JW, Tran TML, et al. Performance of radiologists in differentiating COVID-19
from viral pneumonia on chest CT. Radiology 2020 Mar 10:200823 [FREE Full text] [doi: 10.1148/radiol.2020200823]
[Medline: 32155105]
12. Li L, Qin L, Xu Z, Yin Y, Wang X, Kong B, et al. Artificial Intelligence Distinguishes COVID-19 from Community
Acquired Pneumonia on Chest CT. Radiology 2020 Mar 19:200905 [FREE Full text] [doi: 10.1148/radiol.2020200905]
[Medline: 32191588]
13. COVID-19 Database. Italian Society of Medical and Interventional Radiology (SIRM). URL: https://www.sirm.org/en/
category/articles/covid-19-database/ [accessed 2020-06-23]
14. Yang X, He X, Zhao J, Zhang Y, Zhang S, Xie P. COVID-CT-dataset: a CT scan dataset about COVID-19. arXiv. 2020
Mar 20. URL: https://arxiv.org/abs/2003.13865 [accessed 2020-06-23]
15. Wormanns D, Fiebich M, Saidi M, Diederich S, Heindel W. Automatic detection of pulmonary nodules at spiral CT: clinical
application of a computer-aided diagnosis system. Eur Radiol 2002 May;12(5):1052-1057. [doi: 10.1007/s003300101126]
[Medline: 11976846]
16. Ohana M, Labani A, Severac F, Jeung M, Gaertner S, Caspar T, et al. Single source dual energy CT: What is the optimal
monochromatic energy level for the analysis of the lung parenchyma? Eur J Radiol 2017 Mar;88:163-170. [doi:
10.1016/j.ejrad.2017.01.016] [Medline: 28189203]
17. Simonyan K, Zisserman A. Very deep convolutional networks for large-scale image recognition. arXiv. 2014. URL: https:/
/arxiv.org/abs/1409.1556 [accessed 2020-06-23]
18. He K, Zhang X, Ren S, Sun J. Deep Residual Learning for Image Recognition. 2016 Presented at: 2016 IEEE Conference
on Computer Vision and Pattern Recognition (CVPR); June 26-July 1, 2016; Las Vegas, NV. [doi: 10.1109/CVPR.2016.90]
19. Szegedy C, Vanhoucke V, Ioffe S, Shlens J, Wojna Z. Rethinking the Inception Architecture for Computer Vision. 2016
Presented at: 2016 IEEE Conference on Computer Vision and Pattern Recognition (CVPR); June 26-July 1, 2016; Las
Vegas, NV. [doi: 10.1109/cvpr.2016.308]
20. Chollet F. Xception: Deep Learning with Depthwise Separable Convolutions. 2017 Presented at: 017 IEEE Conference on
Computer Vision and Pattern Recognition (CVPR); July 21-26, 2017; Honolulu, HI. [doi: 10.1109/cvpr.2017.195]
21. Rawat W, Wang Z. Deep Convolutional Neural Networks for Image Classification: A Comprehensive Review. Neural
Comput 2017 Sep;29(9):2352-2449. [doi: 10.1162/neco_a_00990]
22. Kingma DP, Ba JL. Adam: A method for stochastic optimization. 2015 Presented at: 3rd International Conference for
Learning Representations; May 7-9, 2015; San Diego, CA URL: https://arxiv.org/pdf/1412.6980.pdf
23. Selvaraju R, Cogswell M, Das A, Vedantam R, Parikh D, Batra D. Grad-CAM: Visual Explanations from Deep Networks
via Gradient-Based Localization. : Visual explanations from deep networks via gradient-based localization. Proceedings
of the IEEE international conference on computer vision; 2017 Presented at: 2017 IEEE International Conference on
Computer Vision (ICCV); Oct. 22-29, 2017; Venice, Italy. [doi: 10.1109/iccv.2017.74]
24. Li L, Qin L, Xu Z, Yin Y, Wang X, Kong B, et al. Artificial Intelligence Distinguishes COVID-19 from Community
Acquired Pneumonia on Chest CT. Radiology 2020 Mar 19:200905 [FREE Full text] [doi: 10.1148/radiol.2020200905]
[Medline: 32191588]
25. Xu X, Jiang X, Ma C, Du P, Li X, Lv S, et al. Deep learning system to screen coronavirus disease 2019 pneumonia. arXiv.
URL: https://arxiv.org/abs/2002.09334 [accessed 2020-06-23]
26. Zheng C, Deng X, Fu Q, Zhou Q, Feng J, Ma H, et al. Deep Learning-based Detection for COVID-19 from Chest CT using
Weak Label. medRxiv 2020 Mar 26:preprint. [doi: 10.1101/2020.03.12.20027185]
27. Chung H, Ko H, Jeon SJ, Yoon K, Lee J. Automatic Lung Segmentation With Juxta-Pleural Nodule Identification Using
Active Contour Model and Bayesian Approach. IEEE J Transl Eng Health Med 2018;6:1-13. [doi:
10.1109/jtehm.2018.2837901]
28. Deng J, Dong W, Socher R, Li L, Li K, Fei-Fei L. ImageNet: A large-scale hierarchical image database. Imagenet: A
large-scale hierarchical image database; 2009 Presented at: 2009 IEEE Conference on Computer Vision and Pattern
Recognition; June 20-25, 2009; Miami, FL p. A. [doi: 10.1109/cvpr.2009.5206848]
29. Maturana D, Scherer S. VoxNet: A 3D Convolutional Neural Network for real-time object recognition. 2015 Presented at:
2015 IEEE/RSJ International Conference on Intelligent Robots and Systems (IROS); 28 September-3 October 2015;
Hamburg, Germany. [doi: 10.1109/iros.2015.7353481]
30. Yoon SH, Lee KH, Kim JY, Lee YK, Ko H, Kim KH, et al. Chest Radiographic and CT Findings of the 2019 Novel
Coronavirus Disease (COVID-19): Analysis of Nine Patients Treated in Korea. Korean J Radiol 2020 Apr;21(4):494-500
[FREE Full text] [doi: 10.3348/kjr.2020.0132] [Medline: 32100485]
http://www.jmir.org/2020/6/e19569/ J Med Internet Res 2020 | vol. 22 | iss. 6 | e19569 | p. 12
(page number not for citation purposes)
XSL• FO
RenderXJOURNAL OF MEDICAL INTERNET RESEARCH Ko et al
31. Mossa-Basha M, Meltzer CC, Kim DC, Tuite MJ, Kolli KP, Tan BS. Radiology Department Preparedness for COVID-19:
Scientific Expert Panel. Radiology 2020 Mar 16:200988 [FREE Full text] [doi: 10.1148/radiol.2020200988] [Medline:
32175814]
32. Kim DW, Jang HY, Kim KW, Shin Y, Park SH. Design Characteristics of Studies Reporting the Performance of Artificial
Intelligence Algorithms for Diagnostic Analysis of Medical Images: Results from Recently Published Papers. Korean J
Radiol 2019 Mar;20(3):405-410 [FREE Full text] [doi: 10.3348/kjr.2019.0025] [Medline: 30799571]
33. Santosh KC. AI-Driven Tools for Coronavirus Outbreak: Need of Active Learning and Cross-Population Train/Test Models
on Multitudinal/Multimodal Data. J Med Syst 2020 Mar 18;44(5):93 [FREE Full text] [doi: 10.1007/s10916-020-01562-1]
[Medline: 32189081]
Abbreviations
AI: artificial intelligence
ANOVA: analysis of variance
API: application programming interface
AUC: area under the curve
CNN: convolutional neural networks
CNUH: Chonnam National University Hospital
COVID-19: coronavirus disease
CT: computed tomography
DICOM: Digital Imaging and Communications in Medicine
FCONet: fast-track COVID-19 classification network
FN: false negative
FP: false positive
Grad-CAM: gradient-weighted class activation mapping
ROC: receiver operating characteristic
SARS-CoV-2: severe acute respiratory syndrome coronavirus 2
SIRM: Italian Society of Medical and Interventional Radiology
TN: true negative
TP: true positive
WKUH: Wonkwang University Hospital
Edited by G Eysenbach; submitted 23.04.20; peer-reviewed by J Lee, T Goodwin; comments to author 14.05.20; revised version
received 31.05.20; accepted 21.06.20; published 29.06.20
Please cite as:
Ko H, Chung H, Kang WS, Kim KW, Shin Y, Kang SJ, Lee JH, Kim YJ, Kim NY, Jung H, Lee J
COVID-19 Pneumonia Diagnosis Using a Simple 2D Deep Learning Framework With a Single Chest CT Image: Model Development
and Validation
J Med Internet Res 2020;22(6):e19569
URL: http://www.jmir.org/2020/6/e19569/
doi: 10.2196/19569
PMID:
©Hoon Ko, Heewon Chung, Wu Seong Kang, Kyung Won Kim, Youngbin Shin, Seung Ji Kang, Jae Hoon Lee, Young Jun Kim,
Nan Yeol Kim, Hyunseok Jung, Jinseok Lee. Originally published in the Journal of Medical Internet Research (http://www.jmir.org),
29.06.2020. This is an open-access article distributed under the terms of the Creative Commons Attribution License
(https://creativecommons.org/licenses/by/4.0/), which permits unrestricted use, distribution, and reproduction in any medium,
provided the original work, first published in the Journal of Medical Internet Research, is properly cited. The complete bibliographic
information, a link to the original publication on http://www.jmir.org/, as well as this copyright and license information must be
included.
http://www.jmir.org/2020/6/e19569/ J Med Internet Res 2020 | vol. 22 | iss. 6 | e19569 | p. 13
(page number not for citation purposes)
XSL• FO
RenderXYou can also read