COVID-19 Emergency Rental Assistance: Analysis of a National Survey of Programs - National Low ...
←
→
Page content transcription
If your browser does not render page correctly, please read the page content below
Research Brief | January 2021

COVID-19 Emergency Rental
Assistance: Analysis of a National
Survey of Programs
Housing Initiative at Penn                                  NYU Furman Center                                     National Low Income Housing Coalition
Vincent Reina                                               Ingrid Gould Ellen                                    Andrew Aurand
Claudia Aiken                                               Tyler Haupert                                         Rebecca Yae
Julia Verbrugge

Introduction

While estimates of the exact amount vary, studies                                                               This research brief presents the results of an in-depth
agree that American renters now owe tens of billions of                                                         survey of 220 COVID-19 rental assistance programs
dollars in back rent, while many others have exhausted                                                          across the country. The survey launched in August
their savings, borrowed from family or friends, or used                                                         2020 and collected responses during the months
credit cards to keep up.1 The Coronavirus Aid, Relief,                                                          August, September, and October. Thus, most of the
and Economic Security (CARES) Act, enacted in                                                                   programs surveyed (about 80%) relied, at least in
March 2020, provided two main funding streams that                                                              part, on CARES Act funding. In December 2020, we
states and local jurisdictions could use for emergency                                                          asked survey respondents to provide updated figures
rental assistance during these unprecedented times:                                                             for program enrollment and eligibility; 70 programs
Coronavirus Relief Funds (CRF) and Community                                                                    did so.
Development Block Grants (CDBG-CV). As of mid-
October, 44 states (including Washington, D.C.) and
310 local jurisdictions chose to devote roughly $3.9
billion to emergency rental assistance, which falls
significantly short of most estimates of COVID-19-
related needs.2

1
  See, for example: Andrew Aurand, Dan Emmanuel, and Daniel Threet. “Emergency Rental Assistance Needs for Workers Struggling Due to COVID-19.” National Low Income Housing Coalition. Research Note. May 5,
2020; Davin Reed and Eileen Divringi. Household Rental Debt During COVID-19. Federal Reserve Bank of Philadelphia, October 2020; Jim Parrott and Mark Zandi. “Averting an Eviction Crisis.” Moody’s Analytics and Urban
Institute, January 2021. https://www.moodysanalytics.com/-/media/article/2021/averting-an-eviction-crisis.pdf
2
  Rebecca Yae, Andrew Aurand, Daniel Threet, and Emma Foley. “Emergency Rental Assistance Programs in Response to COVID-19.” National Low Income Housing Coalition. Research Note. October 27, 2020.
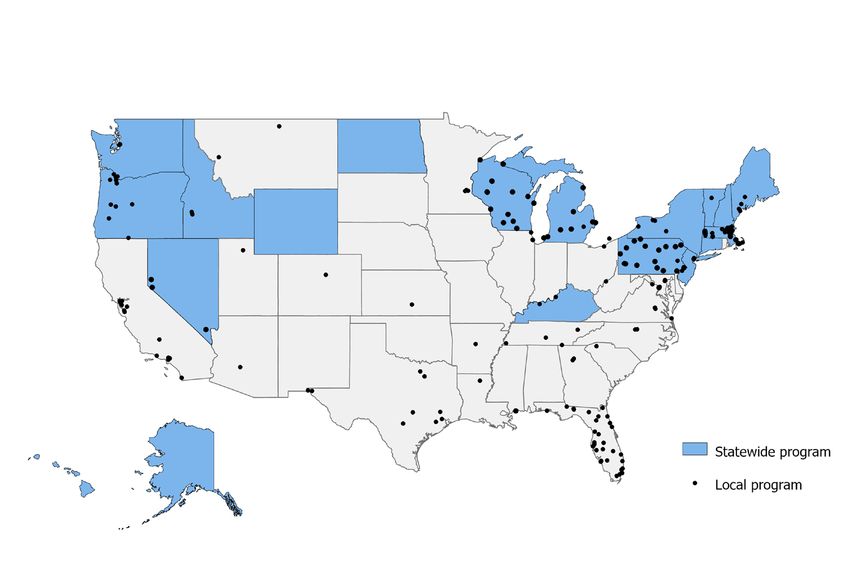
Figure 01. Rental Assistance Programs Surveyed

This is a key moment to learn from the state and                                                                 I. Overview of COVID-19 Rental Assistance Programs
local COVID-19 rental assistance programs launched
in 2020. The new coronavirus relief package signed                                                               As of mid-October 2020, the National Low Income
into law on December 27, 2020 includes $25 billion                                                               Housing Coalition (NLIHC) had identified 438
in rent and utility relief to provide some assistance to                                                         emergency rental assistance programs (68 state
struggling renters.3 Once again, the difficult task of                                                           programs and 370 local programs) created or
administering these funds will fall to state and local                                                           expanded in response to COVID-19.4 Our sample of
governments, many of which have never provided                                                                   220 programs spans 40 states (including Washington,
direct rental assistance, or will need to scale up their                                                         D.C.). We collected survey responses for 22 statewide
2020 efforts significantly. The enormity of the need                                                             rental assistance programs and 198 local and locally
for this assistance, and the wave of evictions that may                                                          administered programs (48 regions, 80 counties, and
occur if households do not receive it, makes the next                                                            70 cities).5
round of programs even more urgent.
                                                                                                                 Nearly three quarters (72%) of emergency rental
This brief begins with an overview of the                                                                        assistance programs we surveyed were created in
characteristics of the programs captured in our survey.                                                          response to the COVID-19 pandemic, while the
The second section examines key challenges that these                                                            remainder were expansions or modifications of existing
programs encountered. The third section describes a                                                              programs (N = 164).6 As such, many jurisdictions faced
set of program outcome measures based on survey                                                                  the initial challenge of developing and launching a
responses that help to assess the relative success of                                                            brand-new housing subsidy program. For jurisdictions
these programs. Finally, the fourth section explores                                                             that had existing programs, the initial challenge was
the relationship between program characteristics and                                                             to assess whether and how these programs needed to
outcomes and provides critical “lessons learned” that                                                            be modified or scaled up to meet COVID-19-related
should inform future iterations of emergency rental                                                              needs.
assistance programs.

3
  U.S. House of Representatives. Consolidated Appropriations Act 2021. December 21, 2020. https://rules.house.gov/sites/democrats.rules.house.gov/files/BILLS-116HR133SA-RCP-116-68.pdf
4
  Rebecca Yae, Andrew Aurand, Daniel Threet, and Emma Foley. “Emergency Rental Assistance Programs in Response to COVID-19.” National Low Income Housing Coalition. Research Note. October 27, 2020.
5
  “Regions” are program service areas made up of multiple cities or counties; they may be rural or metropolitan. Note that Massachusetts and Wisconsin each submitted responses for two programs and that we include
Washington, D.C. as a state.
6
  Most respondents did not respond to every question in our survey. In addition, some questions were not posed to local agencies that were simply administering state-level programs to avoid redundancy and increase
survey response rates. Reported results capture only the subset of programs (N) that answered a given question.

                                                                                                           2
Table 01. CARES Act Funding Streams
CRF CDBG-CV
Federal Department of Treasury Department of Housing and Urban Development (HUD)
Administering
Agency
Timeline for Use Incurred by December 30, 2020; deadline extended to December Six-year period of performance as established by the CDBG-CV
31, 2021 with enactment of COVID-19 relief package on grant agreement, during which 80% of funding must be spent in
December 27, 2020 the first three years
Eligibility Criteria Expenditure must be necessary and incurred due to COVID-19, 70% of CDBG-CV funds must benefit low- and moderate-income
including “provision of economic support in connection with the persons (up to 80% of area median income); must be connected
COVID-19 public health emergency” to COVID-19; must be paid to landlord on behalf of tenant
Maximum Duration Maximum duration is not specified, but can only cover costs Up to 6 months of rental assistance with submission of HUD
of Assistance incurred between March 1, 2020, and December 30, 2020; waiver and lead-based paint inspection (required for assistance
period extended to December 31, 2021 over 100 days)
As stated previously, two key sources of funding for
rental assistance programs in 2020 were CRF and
CDBG-CV. Though none of the funding sources
created by the CARES Act required jurisdictions to
spend money on rental assistance, many chose to do
so. Major differences distinguish CARES Act CRF Figure 02. Stated Program Goals (N = 164)
from CDBG-CV (as shown in Table 1).
The two most common goals for rental assistance
programs were stemming evictions and preventing
homelessness (see Figure 2). Most respondents also
listed reducing rent burdens and supporting landlords
as goals. Most jurisdictions listed three or more
goals for their program, highlighting the depth and
complexity of the need for assistance.
Despite uncertainty around funding rules and the
challenges associated with developing or modifying
programs, 59 programs out of 179 responding had
been launched or modified in response to COVID-19
by the end of May 2020.7 By the end of July, over
80% of programs in our sample had been launched or
modified (see Figure 3). About 70% of the programs
by the end of May were new. This is almost identical
to the share for the full sample, meaning that many Figure 03. Programs Launched by Month (N = 179)
jurisdictions worked very quickly to develop entirely
new programs.
7
Programs that launched between January and March likely
did not use CARES Act funding, at least initially.
3Figure 04. Entity that Reviews and Selects Applicants (N = 170)
While most programs were initiated by state or
local government agencies, the majority (55%) of Figure 05. Maximum Eligible Tenant Income (N = 114)
jurisdictions partnered with nongovernmental entities
to review applications and select recipients and some
had their partners handle additional facets of the
program, including outreach and disbursement of
funds (see Figure 4).
The vast majority of programs placed income-based
limits on who was eligible for rental assistance. This
was true even for programs that used CRF funds,
which did not stipulate income-eligibility criteria,
instead of CDBG-CV or other HUD funds. Over 70%
of respondents in our sample targeted households with
incomes at or below 80% of area median income (see
Figure 5).8 The second most common criterion required must have been current on rent before the onset of
households to have experienced some form of COVID- COVID-19. Nearly 60% of jurisdictions applied three
19-related financial hardship. Experiencing a COVID- or more tenant-related criteria to their program, while
19-related hardship was a requirement of CARES fewer than 10% had only one criterion.
Act funding, but some jurisdictions interpreted this
narrowly to mean only income losses. The additional criteria beyond income-eligibility and
COVID-19-related hardship were not required by most
Beyond these most common criteria, many jurisdictions forms of CARES Act funding. Some of these criteria
placed additional restrictions on eligibility, including may have been motivated by guidance issued by the
stipulations that 1) eligible households may not receive Department of Treasury, which advised grantees to
any other form of housing assistance, 2) applicants structure assistance in a way that “ensures as much as
must be legal U.S. residents, 3) households must have possible, within the realm of what is administratively
insufficient savings to cover rent, and 4) households feasible, that such assistance is necessary.”9
8
Programs varied in whether they defined income eligibility based on pre- or post-COVID-19 income.
9
U.S. Department of Treasury. “Coronavirus Relief Fund Frequently Asked Questions.” Last updated October 19, 2020. https://home.treasury.gov/system/files/136/Coronavirus-Relief-Fund-Frequently-Asked-Questions.pdf
4Figure 06. Tenant Eligibility Criteria (N = 188)
Other criteria (see Figure 6) may be the result of local The majority of programs (98%) required that tenants
preferences or restrictions attached to other forms apply for assistance, rather than asking landlords to
of funding used in rental assistance programs. For apply on behalf of their tenants or properties (N = 188).
example, a few programs accepted only applicants Nevertheless, over 90% of programs were structured
who were already participating in another program for such that once the benefit was approved, the subsidy
low-income households, such as an eviction diversion was paid directly to the landlord (N = 189). This can
or counseling program. In other cases, programs be explained partly by HUD rules, but even programs
excluded households already receiving federal that did not use CDBG-CV or other HUD funding
housing assistance, because the CARES Act guidance distributed assistance to the landlord rather than to the
emphasized the importance of avoiding duplication of tenant. In practice, this meant that after tenants had
benefits.10 Some jurisdictions avoided the possibility applied, met program criteria, and received approval,
of duplication by completely excluding households their landlords still had to agree to participate in the
already receiving assistance. program and arrange to receive the funding.
Some jurisdictions gave priority
during the allocation process to Figure 07. Priority Groups (N = 106)
specific groups they believed to have
the greatest needs for rental assistance
(see Figure 7). Fewer than half of
programs created priority groups, and
of those, most focused on ensuring
that very low-income households and
households with children received
priority.
10
Duplication of benefits occurs when multiple streams of funding are used to meet the same purpose and total assistance provided exceeds total need.
5Figure 08. Average Assistance Per Household Per Month (N = 81)
The amount of assistance available to applicants varied Nearly all (98%) of programs in our sample placed at
widely across programs, with a median of $1,200 per least one restriction on landlords who agreed to receive
household per month (see Figure 8). The average rental assistance funding, and over half (56%) placed
subsidy amount was higher, at $1,716, because a more than one, even though such restrictions were
handful of programs offered $3,900 of assistance or not required by federal funding (see Figure 9). The
more per month. Over 60% of programs provided most common requirement was a commitment from
assistance for 3 or fewer months, whereas nearly 30% landlords not to evict participating tenants. More than
provided support for 6 to 12 months. Interestingly, half of programs that placed an eviction restriction on
programs that offered fewer months of subsidy also landlords specified the time period of this restriction
provided, on average, a lower monthly subsidy as 1 to 2 months, with only about 10% specifying a
($1,546/month for programs offering up to 3 months restriction of 7 months or longer (N = 64). Additional
compared to $2,089/month for programs offering 6 or landlord requirements included forgiveness of the
more months of assistance). tenant’s arrears, a current rental license, participation
in the local rent registry, and a commitment not to
increase rent for a certain period.
Figure 09. Landlord Requirements (N = 152)
6One last point of variation across programs is the level The majority of programs (56%) required proof of
of documentation requested in the application itself COVID-19-related income loss, while some (37%)
(see Figure 10). The two most commonly requested allowed applicants to self-certify their income loss
items were documentation of income and a current instead (other programs asked for both proof and
lease. Programs were divided in terms of the level of self-certification). Further, some programs (34%)
information needed for personal identification, with allowed applicants’ eligibility to take into account
60% requiring a driver’s license or some form of state other COVID-19-related hardships (e.g., medical
ID, only 40% asking for a social security number, and expenses) if they could supply proof of this hardship.
less than 20% asking for a birth certificate (N = 182). Finally, a small share of programs imposed additional
application requirements, such as self-certification
that their housing unit was habitable.
Figure 10. Application Requirements (N = 182)
7Figure 11. Program Limitations (N = 139)
Nevertheless, a lack of preexisting internal capacity
II. Key Program Challenges
and infrastructure for the development and delivery of
In our survey, we asked program administrators to list rental assistance or a lack of external local organizations
the challenges they faced in designing and implementing able to provide the needed support likely contributed
their programs (see Figure 11). Almost half of program to capacity issues. Many of the other constraints that
administrators said their programs faced four or more agencies listed, such as technology limitations and
key limitations, and more than two-thirds listed at other system factors, are linked to this basic limitation
least three. The two most common limitations were of capacity.
related to the completeness of applications and staff
capacity. Considering the challenges of navigating A final constraint worth noting is that of landlord
an application process during a public health crisis, cooperation. As previously stated, the vast majority
and the documentation many programs required from of rental assistance programs required landlord
applicants, it is not surprising that over two-thirds of engagement, and thus if a landlord could not be
programs struggled with incomplete applications. contacted or refused to participate in the program,
their tenant would be unable to access assistance.
Many agencies also faced limited staff capacity and While landlord participation was not the most common
leaned on whatever local capacity was available constraint, the fact that nearly 50% of programs cited
to develop programs, conduct outreach, review it as an issue highlights an important barrier that many
and process applications, and process payments. low-income households encountered when trying to
Incomplete applications likely added to these capacity access rental assistance. Lack of landlord engagement
challenges as following up with applicants to collect could be a product of many factors. The programs
missing information adds additional time and themselves—whether because of the depth or duration
administrative strain to the review process. Funding of subsidy, or because of additional restrictions they
for rental assistance allows for some administrative placed on landlords—may not align with landlords’
overhead; there is a 20% cap on administrative costs needs. Research focusing on Philadelphia landlords
for CDBG-CV, while CRF did not place a cap on shows that rental portfolio size and other landlord
administrative costs. characteristics play an important role in the decision
to engage with rental assistance programs.11
11
Vincent Reina, Sydney Goldstein, Emily Dowdall, Ira Goldstein, and Elizabeth DeYoung. “Residential Rental Property Owner Perspectives and Practices in Philadelphia: Evaluating Challenges during the COVID-19
Pandemic.” Research Brief. Housing Initiative at Penn and Reinvestment Fund, December 2020. https://www.housinginitiative.org/uploads/1/3/2/9/132946414/hip_rf_brief_final.pdf
8III. Measures of Program Outcomes was allocated through federal formulas as well as
local decision-making, some jurisdictions may have
The wide variation in renters’ needs and local rental received funds inadequate to meet local need, while
market realities makes it difficult to evaluate rental other jurisidictions may have received closer to the
assistance programs. Nevertheless, data on program right amount.
applications and utilization can provide important
insights. In this section, we offer outcome measures Two key themes emerge from our analysis of application
across all programs to explore in aggregate how they volume. The first is that even early on, demand met or
performed with respect to the number of applicants, exceeded supply for most programs. The majority of
the number of households assisted, and funding spent program administrators responded “yes” to an open-
(see Table 2).12 These measures focus on the extent to ended question asking whether they had “received
which people applied for and were served by rental the anticipated volume of response from tenants”
assistance programs. They do not address important in August-October (70% of 122 responses). A third
questions of how assistance affects household (34%) of respondents reported that even looking only
outcomes, including housing stability, exposure to at eligible applicants, the demand for their programs
homelessness, and housing debt accrued, as well as exceeded the supply of assistance (N = 144). For some
recipients’ mental, physical, and economic wellbeing. programs, demand vastly outstripped supply; one
reported having 11 times more eligible applicants than
Volume of Applications it could serve. More than a third of programs in our
sample had already implemented multiple iterations in
While research shows there is significant need for order to serve more applicants by the time they were
housing assistance, a number of factors can affect inially surveyed in August-October (N = 103).
whether that need formalizes in the number of
households that apply for rent relief. States and local A second theme is that the volume of applications
jurisdictions had significant discretion in determining increased over time. We asked program administrators
the level of assistance and its duration, the application to report the total number of applicants they had
process, and any eligibility criteria and restrictions received both in the initial survey and in a follow-
associated with receiving the subsidy—all of which up at the close of 2020. Among the 42 programs that
could have affected program demand. The strategy reported both figures, application volume increased,
for notifying tenants and landlords about the program, on average, by a factor of three.
and the support provided to help them navigate the
application process, likely affected who successfully
applied. Finally, since funding for these programs
Table 02. Outcome Measures
August - October December - January
Measure Mean Median Min Max N Mean Median Min Max N
Volume of applicants 6,223 521 0 221,098 60 8,239 1,189 3 88,000 35
Ratio of actual to expected households served 1.46 0.75 0 13.92 61 1.72 0.89 0.07 20.7 53
Funds obligated as a share of total program funds 1.47 0.97 0.01 12.93 58 - - - - -
12
We asked respondents to provide these numbers twice: once in the original survey that was conducted in August-October, and again via email in December-January of 2020-2021. Unless otherwise specified, outcomes
reflect only the original numbers collected in August-October. Not all sites provided complete figures for all of our outcome measures; therefore, we share the number of total responses when we discuss each measure.
9Households Assisted was later extended). It also reflects the fact that many
programs faced high demand. Since programs have
A robust pool of applicants is important for program already obligated such a high share of funds, the actual
success, but also important is whether programs were number of households served will likely increase over
then able to serve these applicants. One measure we the course of January as checks are cut, which means
use to explore this question is the ratio of households that the shares of programs meeting their targets will
served to the number expected to be served. This ratio improve over those shown here.
captures the number of households served relative
to the targeted goals of the program. We both asked
for these targets and approximated them by dividing
total program funds by the maximum assistance per IV. Lessons Learned
household.
In this section, we look at the relationship between
The average program served more households program characteristics and the outcome measures
than expected (with a mean ratio of 1.46 across 61 described above.14 We focus on the ratio of households
programs), but this mean is pulled up by several a program served to the number it was expected
outlier programs that served far more households to serve. This measure is an indication of whether
than expected. The median value is only 0.75. Thus, programs were able to distribute program funds within
a slight majority of programs (56%) actually served a limited time period (or “get money out the door”).
fewer households than expected. As noted previously, We also look more generally at the relationship
because survey responses were collected over the between program characteristics and whether a
course of several months, and because the programs program experienced common limitations such as a
launched at different times, this ratio reflects the status lack of staff capacity, incomplete applications, and
of programs in mid-to-late 2020, rather than their a lack of landlord cooperation. Several key themes
performance at a particular point in the implementation emerge from this analysis.
process. Based on the updated numbers we received
for a subset of programs in December-January, the Funding
mean program finished out the year with a ratio of
1.72, but 56% had still served fewer households than Rental assistance programs relied on a wide range
expected. of funding sources, and often combined multiple
sources. These funding sources often mattered for
Funds Obligated getting dollars out the door. Just over 40% of the 124
programs for which we have funding source data used
Another outcome is the share of funds obligated HUD CARES Act funds (CDBG-CV, ESG-CV, or
(approximated as households served multiplied by the HOME) alone or in combination with other sources.
maximum assistance per household divided by total Slightly less than 40% of programs used CRF, but not
program funds).13 For the 58 programs for which we HUD funds. Interestingly, over 20% of programs used
can calculate this ratio, the median program had already none of these federal funding sources, likely opting
obligated 97% of funds in August-October 2020. This for a mixture of local and philanthropic dollars.
number is not necessarily surprising considering
that CRF rules mandated that all funds needed to be
allocated by the end of 2020 (though that deadline
13
Note that this ratio assumes that all households received the maximum possible assistance.
10There is a clear relationship between the restrictiveness New programs tended to have more numerous and more
of the source of funds and the ability to distribute rental stringent tenant and landlord requirements, compared
assistance within a limited time period. Programs that to preexisting programs, when initially surveyed. They
used HUD CARES Act funding tended to have more also reported using fewer outreach methods and had
numerous and more stringent tenant eligibility criteria smaller staffs. Some of these features likely changed
than those that used only CRF or other funds. Perhaps over time, which could have contributed to improved
as a result, programs using HUD CARES Act funding outcome measures. These relationships cumulatively
had a mean ratio of actual to expected households suggest that while leveraging existing programs was
served that was slightly less than 1, whereas those a successful approach, developing new programs
using CRF funding served a higher share of expected around the current problem and funding mechanism
households, with a mean ratio of 1.53. was also effective in the longer term.
Programs that used local or philanthropic dollars Whether or not the program administrators had
were able to serve 2.5 times as many households as previous experience with rental assistance programs
they expected to serve. Looser restrictions on the was consistently associated with stronger performance
use of these funds may explain why these programs across initial and updated outcome measures. Programs
were able to get money out the door at such scale. with experienced administrators reported an initial
These programs, however, were typically funded at a mean ratio of 1.39 actual to expected households
much smaller scale than those funded by CARES Act served; this ratio increased to 1.51 by December/
sources. January. Programs with experienced administrators
were also less likely to report limitations of
Implementer Type, Experience, and Capacity capacity. By contrast, programs without experienced
administrators reported averages of 0.61 and later
It appears that state programs were initially better 1.26. These results support the conclusion that new
able to get funds out the door than either local or programs are building the knowledge and capacity to
regional programs. However, local programs caught implement rental assistance programs.
up to and even overtook state programs in terms of
the ratio of actual to expected households served by Programs that partnered with nonprofits for
December 2020. Local programs were more likely implementation were less likely to report capacity
than state programs to identify staff capacity as an limitations than those that did not. They were also
initial limitation (74%) than were state or regional less likely to report application completeness as a
programs (65% and 46%, respectively), and it is likely limitation. Despite these two positive indicators,
that once these local programs were up and running, programs that partnered with nonprofits did not
staff capacity became less of a barrier. initially serve a higher ratio of expected households
than other programs, but by December, they did.
As we might expect, new programs (launched after
March 2020) initially had more difficulty getting funds
out the door than programs which existed in some form
prior to the pandemic. Their ratio of actual to expected
households served averaged 1.08, compared to 2.63
for preexisting programs. However, new programs
had caught up by December 2020 with a ratio of 2.14
compared to 1.59 for preexisting programs.
14
For the sake of this report, we use correlations and simple t-tests, which means these are associative
relationships that do not control for other potentially explanatory factors. Such information still provides
important insight into the basic components of rent relief programs.
11Figure 12. Stringency of Landlord Requirements (N = 41)
This outcome suggests that once any initial issues
associated with nonprofit partnerships were worked
out, they became an important part of successful
program delivery. This finding may be subject to
selection bias, however, if only jurisdictions in areas
with local high-capacity nonprofits chose to pursue
such partnerships. This does not negate the importance
of nonprofits to program delivery but does mean that
these findings should not be assumed to extend to
partnerships with any nonprofit.
Notably, the population of a jurisdiction was not
positively or negatively associated with any of our
outcome ratios. Larger localities were, however, more
likely to report landlord cooperation limitations and
that demand exceeded the supply of assistance. Further, when programs combined an eviction
restriction with other requirements (which was the
Landlord Requirements case for 53 programs), the ratio of actual to expected
households served dropped from an average of 1.98
Many programs required participating landlords to 0.52.
to make certain concessions such as freezing rent,
forgiving past due rent, or suspending evictions, or As stated previously, most rental assistance programs
to be licensed or registered in some way. A greater in our survey asked tenants to apply for assistance and
number of requirements for participating landlords engaged landlords later in the application process,
was associated with a lower mean ratio of households if at all. More research is needed to understand how
served to households expected to be served, especially landlord requirements affect outcomes for programs
as time went on. The same was true for the stringency in which landlords apply for assistance on behalf of
of requirements (see Figure 12).15 their tenants and properties.
The most common requirement for landlords was Tenant Eligibility Criteria
not to evict participating tenants. Programs with this
requirement did not struggle more to get money out We might expect that programs with more, or more
the door on average. However, the length of time (in stringent, criteria for tenant eligibility would have
months) that a program required a landlord not to greater difficulty distributing rental assistance.17 In fact,
evict participating tenants was negatively correlated we find no correlation between the number of tenant
with the ratio of households served to expected, which eligibility criteria and the ratio of actual to expected
may mean that the duration of an eviction restriction households served. Having a larger number of criteria
reduced programs’ ability to distribute funds.16 did not seem to strongly discourage applications either.
15
We used a point system to measure the stringency of landlord requirements. We gave two points each to the requirements to freeze rent, forgive back rent, and suspend evictions and one point each to all other
requirements (including those manually entered by survey respondents in the “other” column), based on previous research about which landlord requirements are most onerous (see note 11 on p.8).
16
These requirements interact with local and state eviction moratoria in potentially complex ways. Requiring landlords to cease evictions for a given period in exchange for rental assistance is a much less onerous
requirement if the locality or state is already suspending all or most eviction cases.
17
We used a point system to measure the stringency of tenant eligibility criteria. Criteria that go beyond CARES Act CDBG requirements (for example, requiring tenants to have been current on their rent before the
pandemic, requiring them to be enrolled in other means-tested programs, or requiring them to be legal U.S. residents) are weighted two points each, while all other requirements (including those manually entered by
survey respondents in the “other” column) are weighted one point each.
12Figure 13. Tenant Income-Eligibility (N = 52)
It is worth noting, however, that the most common
eligibility criterion—a cap on the incomes of eligible
households—was positively correlated with the ratio
of actual to expected households served, suggesting
that programs targeting those most in need may have
been better able to reach or assist households (see
Figure 13 on the following page).
There was no correlation between having more or more
stringent application requirements (such as providing
certain kinds of affidavits or documentation) and
the ratio of actual to expected households served.18
However, having more application requirements was
correlated with issues of incomplete applications. In
particular, programs that required tenants to provide
proof of COVID-19-related income losses (N = 79) a limited time period. Jurisdictions that leveraged
reported difficulty getting tenants to complete their local capacity, including through partnerships with
applications 77% of the time, versus 65% of the local nonprofits, were particularly effective at
programs that did not have this requirement (N = 55). designing programs and serving households. Further,
This makes sense given that applicants who were jurisdictions that developed simple programs and
already unemployed when the pandemic began, are processes and avoided onerous restrictions on rental
working jobs paid in cash, are self-employed, or have property owners were better able to provide assistance
irregular income streams might have trouble proving a within a limited time period.
COVID-19-related income loss.
In general, flexibility was an important feature of
successful programs. Greater flexibility was possible
for programs using federal funding streams that
had less stringent requirements. Flexible programs
V. Conclusion were able to respond to a wider range of tenants’
and landlords’ needs; they were also able to adapt
There are many potentially effective ways to provide their program structures, application processes, and
emergency rental assistance, particularly given the requirements to respond to local needs and challenges
enormous diversity of household needs, market over time.
dynamics, and local government and nonprofit capacity
across the country. Our analysis, however, provides While not fully captured in our survey, the authors have
some clear lessons from the first wave of programs observed programs making adjustments after their
created or expanded in response to the coronavirus programs launched in response to specific challenges.
pandemic that can be applied to both current and new For instance, a good balance between protecting tenants
programs going forward. and granting landlords flexibility was challenging to
achieve in many places. Landlords were sensitive to
We found that most jurisdictions launched brand-new requirements that they freeze rent, forgive arrears,
rental assistance programs, and while they experienced or suspend evictions (especially for longer periods
growing pains, many of these new programs were of time). While tenant protections are of the utmost
ultimately successful in serving households within importance, landlords weigh these restrictions against
We again use a point system to measure application requirement stringency. Requirements to provide a social security number, proof of income losses due to COVID-19, and proof of other COVID-19-related hardships are
18
weighted two points each, while all other requirements (including those manually entered by survey respondents in the “other” column) are weighted one point each.
13the assistance they would receive and may choose Many jurisdictions have developed a foundation for
not to participate. Some programs modified landlord a new round of rental assistance. Other jurisdictions
requirements to increase participation rates. Others are developing rental assistance programs for the first
introduced a path for direct-to-tenant rental assistance time. The context for these programs continues to
to ensure that households could receive support despite evolve; for instance, current programs are operating
a lack of landlord engagement. Programmatic learning with the Center for Disease Control’s (CDC’s) eviction
on how to address challenges, and the willingness to moratorium in place. Any changes to that moratorium
make adjustments, likely contributed to the increase will affect the demand for rental assistance, program
in the ratio of actual to expected households served design and requirements, and how landlords respond
over time. to any such requirements. Ultimately, programs must
both apply past lessons learned and ensure flexibility
Local and state rental assistance programs are now to adjust to new opportunities and challenges as they
faced with administering an even larger pool of funds, arise in order to provide much-needed assistance to
thanks to the recent coronavirus relief package. Federal tenants and landlords.
allocating agencies must provide programs with clear
guidance as to the flexibility of these funds, especially
regarding landlord and tenant eligibility requirements.
Without such clarity, program administrators may
feel pressure to impose more onerous requirements
or collect more documentation than necessary, which,
our survey indicates, can lead to a higher rate of
incomplete applications and difficulty distributing
program funds.
ACKNOWLEDGMENTS
The Annie E. Casey Foundation and the Charles and Lynn Schusterman Family Philanthropies generously supported
this research. We thank them for their support but acknowledge that the findings and conclusions presented in this
report are those of the authors alone, and do not necessarily reflect the opinions of these funders.
WITH QUESTIONS, PLEASE CONTACT:
Ingrid Gould Ellen, Faculty Director, NYU Furman Center: ingrid.ellen@nyu.edu
Vincent Reina, Faculty Director, Housing Initiative at Penn: vreina@upenn.edu
Rebecca Yae, Senior Research Analyst, National Low Income Housing Coalition: ryae@nlihc.org
14You can also read