Contracting Wide-area Network Topologies to Solve Flow Problems Quickly
←
→
Page content transcription
If your browser does not render page correctly, please read the page content below
Contracting Wide-area Network Topologies to Solve
             Flow Problems Quickly
 Firas Abuzaid, Microsoft Research and Stanford University; Srikanth Kandula,
    Behnaz Arzani, and Ishai Menache, Microsoft Research; Matei Zaharia
                     and Peter Bailis, Stanford University
           https://www.usenix.org/conference/nsdi21/presentation/abuzaid

                This paper is included in the
       Proceedings of the 18th USENIX Symposium on
      Networked Systems Design and Implementation.
                                April 12–14, 2021

                                978-1-939133-21-2

                                        Open access to the Proceedings of the
                                       18th USENIX Symposium on Networked
                                        Systems Design and Implementation
                                                  is sponsored by
Contracting Wide-area Network Topologies to Solve Flow Problems Quickly
Firas Abuzaid†∗ , Srikanth Kandula† , Behnaz Arzani† , Ishai Menache† , Matei Zaharia∗ , Peter Bailis∗
Microsoft Research† and Stanford University∗
Abstract– Many enterprises today manage traffic on their Network Clusters Allocate flow on
wide-area networks using software-defined traffic engineer- Contract Flow
Demand Paths contracted
network Allocation
ing schemes, which scale poorly with network size; the solver History network
runtimes and number of forwarding entries needed at switches occasionally Demands (periodically; e.g.,
every few min)
increase to untenable levels. We describe a novel method,
which, instead of solving a multi-commodity flow problem Figure 1: NCFlow’s workflow.
on the network, solves (1) a simpler problem on a contrac-
tion of the network, and (2) a set of sub-problems in parallel
on disjoint clusters within the network. Our results on the
topology and demands from a large enterprise, as well as on Cluster
publicly available topologies, show that, in the median case,
our method nearly matches the solution quality of currently Figure 2: The original network on the left is divided into clusters, shown
deployed solutions, but is 8× faster and requires 6× fewer with different background colors. The contracted network is on the right.
FIB entries. We also show the value-add from using a faster
footprints today are already over 10× larger than the few tens
solver to track changing demands and to react to faults.
of sites that were considered in prior work [35, 36], since
enterprises have built more sites to move closer to users.
1 Introduction In this paper, we seek to retain the benefits of global traffic
management for large WAN networks without requiring ex-
Wide-area networks (WANs), which connect locations across cessively many forwarding entries at switches or prohibitively
the globe with high-capacity optical fiber, are an expensive long solver runtimes. Also, by using a faster solver, WAN
resource [7, 35, 36, 38]. Hence, enterprises seek to carefully operators can reduce loss when faults occur and carry more
manage the traffic on their WANs to offer low latency and traffic on the network by tracking demand changes.
jitter for customer-facing applications [28, 62, 69] and fast
response times for bulk data transfers [46, 56]. Our solution is motivated by the observation that WAN
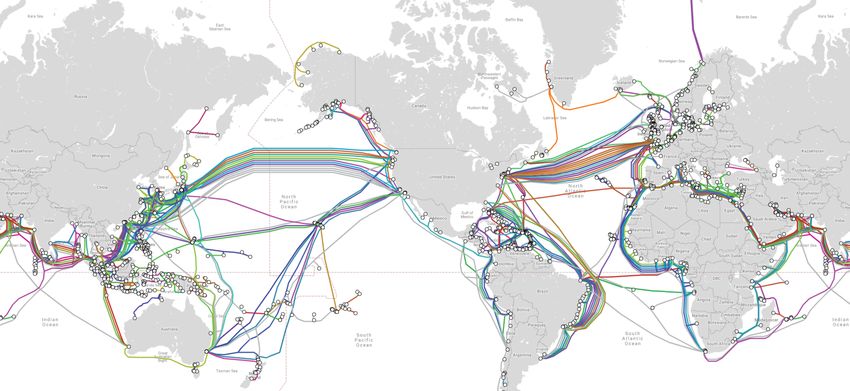
The state-of-the-art approach used in several enterprises topologies and demands are concentrated: the topology typi-
today [35, 36, 38] is to compute optimal routing schemes for cally has well-connected portions separated by a few, lower-
the current demand by solving global multi-commodity flow capacity edges, and more demand is between nearby datacen-
problems [7,35,36,38]; the global flow problems are re-solved ters. This is likely due to multiple operational considerations:
periodically, since demands may change or links may fail, (1) submarine cables have become shared choke points for
and the computed routes are encoded into switch forwarding connectivity between continents (see Figure 3), (2) the con-
tables using software-defined networking techniques [7]. nectivity over land follows the road or rail networks along
As network sizes grow, solving multi-commodity flow prob- which fiber is typically laid out, and (3) enterprises build
lems on the entire network becomes practically intractable. datacenters close to users, then steer traffic to nearby datacen-
As noted in [36], the “algorithm run time increased super- ters [12, 62, 69]. Therefore, more capacity and demand are
linearly with the site count,” which led to “extended periods available between nearby nodes; an analysis of data from a
of traffic blackholing during data plane failures, ultimately large enterprise WAN in §2 supports this observation.
violating our availability targets,” as well as “scaling pressure We leverage this concentration of capacity and demand
on limited space in switch forwarding tables.” This problem to decompose the global flow problem into several smaller
is unlikely to go away: anecdotal reports indicate that WAN problems, many of which can be solved in parallel. As shown
USENIX Association 18th USENIX Symposium on Networked Systems Design and Implementation 175
10                               Norm. Change
                                                                                                                       Fract. demand unmet

                                                                                 Normalized
                                                                                                                                1

                                                                                   Change
                                                                                                                              0.8
                                                                                               1                              0.6

                                                                                                                           CDF
                                                                                                                              0.4
                                                                                                                              0.2
                                                                                         0.1                                    0
                                                                                                   0   500 1000 1500 2000         0   0.3 0.6
                                                                                                         Time (mins)                  Metric
                                                                             Figure 4: On the left, we plot the L2 norm of the change in the demands
                                                                             between successive 5-minute periods divided by the L2 norm of the traffic
                                                                             matrix at a time. On the right, we show the CDF of this change ratio. We
Figure 3: Submarine cables serve as choke points in WAN topologies; figure   also show a CDF of the fraction of demand that is unsatisfied if using the
is excerpted from [63].                                                      allocation computed for the previous period.

in Figure 2, we divide the network into multiple connected                   by reusing pathlets within clusters and traffic splitting rules
components, which we refer to as clusters. We then solve                     across multiple demands (§3.5).
modified flow problems on each cluster, as well as on the con-                  Figure 1 shows the workflow for NCFlow. First, we choose
tracted network, where nodes are clusters and edges connect                  appropriate clusters and paths using an offline procedure over
clusters that have connected nodes. Prior work [4, 9, 15] notes              historical traffic—these choices are pushed into the switch
that Google and other map providers use different contractions               forwarding entries. This step happens infrequently, such as
to compute shortest paths on road network graphs. Our goal                   when the topology and/or traffic changes substantially. Then,
is to closely match the multi-commodity max flow solution in                 online (e.g., once every few minutes), NCFlow computes how
quality (i.e., carry nearly as much total flow), while reducing              best to route the traffic over the clusters and paths, similar to
the solver runtime and number of required forwarding entries.                deployed solutions [35, 36, 38].
We discuss related work in §7; to our knowledge, we are the                  Overall, our key contributions are:
first to demonstrate a practical technique for multi-commodity                 • We propose NCFlow, a decomposition of the multi-
flow problems on large WAN topologies.                                           commodity max flow problem into an offline cluster-
   Solving flow problems on the contracted network poses                         ing step and an online, provably feasible, algorithm that
two key challenges:                                                              solves a set of smaller sub-problems in parallel.
                                                                               • We evaluate NCFlow using real traffic on a large enter-
  1. How to partition the network into clusters? More clusters
                                                                                 prise WAN, as well as synthetic traffic on eleven topolo-
     leads to greater parallelism, but maximizing the inter-
                                                                                 gies from the Internet Topology Zoo [6]. Our results
     cluster flow requires careful coordination between the
                                                                                 show that, for multi-commodity max flow, NCFlow is
     sub-problems at multiple clusters.
                                                                                 within 2% of the total flow allocated by state-of-the-
  2. How to design the sub-problems for each cluster to im-
                                                                                 art path-based LP solvers [35, 36, 38] in 50% of cases;
     prove speed while reducing inconsistencies in alloca-
                                                                                 NCFlow is within 20% in 97% of cases. Furthermore,
     tion? The sub-problem for a cluster has fewer nodes and
                                                                                 NCFlow is at least 8× faster than path-based LP solvers
     edges to consider, but it will not be be faster if it must
                                                                                 in the median case; in 20% of cases, NCFlow is over
     consider all node pairs whose traffic can pass through
                                                                                 30× faster. Lastly, NCFlow requires 2.7–16.7× fewer
     the cluster.
                                                                                 forwarding entries in the evaluated topologies. NCFlow
   Our solution NCFlow1 achieves a high-quality flow alloca-                     also compares favorably to state-of-the-art approxima-
tion with a low runtime and space complexity by addressing                       tion algorithms [27,41] and oblivious techniques [44,57].
each of these challenges in turn. First, we contract the network               • We show that, as a fast approximate solver, NCFlow can
using well-studied algorithms such as modularity-based clus-                     be used to react quickly to demand changes and link
tering [25] and spectral clustering [53], which are designed                     failures. Specifically, in comparison to TEAVAR [19],
to identify the choke-point edges in a network. Second, we                       NCFlow carries more flow when no faults occur and suf-
bundle demands whose sources and/or targets are in the same                      fers about the same amount of total loss during failures.
cluster, treating them as a single demand. In Figure 2 for ex-               We have open-sourced an anonymous version of NCFlow [2],
ample, the yellow cluster considers as one bundled demand                    and are in the early stages of integrating NCFlow into produc-
all traffic from source nodes in the red cluster to target nodes             tion use at a large enterprise.
in the green cluster. Doing so can lead to inconsistent flow
allocations between clusters (which we explain in §3.1.1) and
we devise careful heuristics to provably avoid them (§3.2).                  2        Background and Motivation
Finally, we reduce the forwarding entries needed at switches
                                                                             We analyze the changes in topology and traffic on a large
   1 short   for Network Contractions for Flow problems                      enterprise WAN over a several-month period. As Figure 4

176     18th USENIX Symposium on Networked Systems Design and Implementation                                                     USENIX Association
103
Runtime (s), log scale
from a uniform distribution.
102
101 WAN topology properties:
100 • When nodes are divided into tens of clusters, 76% of all
10 1
10 2 5-minute time window edges and 87% of total capacity is within clusters.
112 202 294 372 486 1790 • The skew in capacity is small: the ratio between the
# of Edges (log scale) largest edge capacity and the mean is 10.4.
• The skew in node degree is also small: the average node
Figure 5: Runtimes of a state-of-the-art solver on topologies from Internet degree is 3.9, with σ = 2.6; the max is 16.
Topology Zoo [6]. Both axes are in log scale and the band represents stan-
dard deviation. In production WANs, new traffic demands arrive every few • Relative to the network size (hundreds of nodes), the
minutes [35, 38]. average network diameter (=11) and the average shortest-
path length (= 5.3) are very small.
shows, the change in traffic demand from one 5-minute win-
dow to the next is substantial; the average change is 35%; Motivated by the above analyses, NCFlow seeks to be a fast
in 20% of the cases, the traffic change is over 45%. The en- solver for large WAN topologies by leveraging the concentra-
terprise solves a global flow allocation problem every few tion of traffic demands and capacity.
minutes. The figure on the right shows the fraction of traffic Background: Before we describe NCFlow’s design, we give
that will remain unsatisfied if the flow allocation from the some background on multi-commodity flow problems. Given
previous window were to be used instead of computing a new a set of nodes, capacitated edges, and demands between nodes,
allocation. We see that the median loss is 13%; in 20% of the a flow allocation is feasible if it satisfies demand and capacity
cases, over 20% of the demand remains unsatisfied. We verify constraints. The goal of a multi-commodity flow problem is to
that computing a new allocation will satisfy all of the demand; find a feasible flow which optimizes a given objective; Table 1
using the previous window’s allocation causes loss because lists some common flavors.
some datacenter pairs may receive more flow in the previous The fastest algorithms [27, 41] are approximate; i.e., given
allocation than their current demand while other datacenter a parameter ε, they achieve at least (1 − ε)× the optimal value.
pairs go unsatisfied. And, their runtime complexity is at least quadratic (Table 1).
Given the above data, computing a new allocation in each Moreover, these solutions allow demands to travel on any
time window is needed to carry more traffic on the WAN. edge, thus requiring millions of forwarding table entries at
However, solver runtime increases super-linearly with the each switch for thousand-node topologies. Instead, produc-
size of the topology, as shown in Figure 5. For several public tion systems [35, 38] restrict flow to a small number of pre-
topologies and on a variety of traffic matrices, we benchmark configured paths per demand, which reduces the required
the multi-commodity max-flow problem (specifically PF4 , as forwarding table entries by 10–100×.
will be described in §5.1). The runtimes were measured on a
Using notation from Table 2, the feasible flow over a pre-
server-grade machine using a production-grade optimization
configured set of paths can be defined as:
library [33]. As the figure shows, when the topology size ex-
ceeds a thousand edges, the time to compute a flow allocation
can exceed the allotted time window. FeasibleFlow(V , E , D , P ) , fk | ∀k ∈ D and (1)
p
A fast solver would not only ensure that new allocations fk = ∑ fk , ∀k ∈ D (flow for demand k)
p∈Pk
complete in time—it could also enable more frequent alloca-
fk ≤ dk , ∀k ∈ D (flow below volume)
tions, e.g., every minute. Doing so would enable allocations p
to track changing demands at a finer granularity. Moreover, ∑ fk ≤ ce , ∀e ∈ E (flow below capacity)
∀k,p∈Pk ,e∈p
as we show in §5, a fast solver can help when reacting to link p
fk ≥ 0 ∀p ∈ P , k ∈ D (non-negative flow)
and switch failures.
Our observation that demand and capacity are concentrated
Production systems use linear optimization-based
among nearby nodes is grounded on the following measure-
solvers [35, 36, 38]. On WANs with thousands of nodes, the
ments from a production WAN:
optimization problem could have millions of variables and
Demand properties: equations just to verify that a flow allocation is feasible.
• On average, 7% (or 16%) of the node pairs account for
In this paper, we consider the problem of maximizing the
half (or 75%) of the total demand.
total flow across all demands:
• When nodes are divided into a few tens of clusters, 47%
of the total traffic stays within clusters. If the demands
MaxFlow(V , E , D , P ) , arg max ∑ fk (2)
were distributed uniformly across node pairs, only 8% f
k∈D
of the traffic would stay within clusters; thus the demand s.t. f ∈ FeasibleFlow(V , E , D , P )
within clusters is about 6× larger than would be expected
USENIX Association 18th USENIX Symposium on Networked Systems Design and Implementation 177Maximization term Additional Constraints Used in Known best complexity
MaxFlow ∑k∈D fk none [35, 38] O(M 2 ε−2 logO(1) M) [27]
p
MaxFlow with Cost Budget ∑k∈D fk ∑k ∑ p∈Pk ∑e∈p fk Coste ≤ Budget O(ε−2 M log M(M + N log N) logO(1) M) [27]
Max Concurrent Flow α dk α ≤ fk , ∀k ∈ D [19, 39, 40] O(ε−2 (M 2 + KN) logO(1) M) [41]
Table 1: We illustrate a few different multi-commodity flow problems all of which find feasible flows but optimize for different objectives and can have additional
constraints; see notation in Table 2. Equation 6 fleshes out the problem completely for the case of maximizing flow. More problems are discussed in [11].
Term Meaning MaxAggFlow
V , E , D, P Sets of nodes, edges, demands, and paths
N, M, K The numbers of nodes, edges, and demands, i.e., N = f1 ,MaxFlow(Vagg , Eagg , Dagg , Pagg )
|V |, M = |E |, K = |D |
MaxClusterFlow
e, ce , p Edge e has capacity ce ; path p is a set of connected edges
(sk ,tk , dk ) Each demand k in D has source and target nodes (sk ,tk ∈ ∀clusters x, fx2 ,MaxFlow(Vx , Ex , Dx , Px )
V ) and a non-negative volume (dk ). s.t. NoMoreFlowThruCluster(f, f1 , x) (see §D)
p
f, fk Flow assignment vector for a set of demands and the flow
for demand k on path p. MinPathE2E
f3 , fk , ∀k ∈ Dagg s.t.
Table 2: Notation for framing multi-commodity flow problems.
s.t. NoMoreAlongPaths(f, f2 ) (see §D)
Vagg , Eagg , Nodes, edges, demands, and paths in the aggregated
Dagg , Pagg graph SrcTargetMax
xy
Vx , Ex , Dx , Px Subscript denotes entities in the restricted graph for ∀clusters x, y,x 6= y, f4 ,arg max ∑ fk
cluster x k∈Kxy
x y
x, η Each cluster x is a strongly connected set of nodes and s.t. ∑ fk ≤ f2,Ksy
, ∀s ∈ x; ∑ fk ≤ f2,Kxt , ∀t ∈ y;
η is the number of clusters k∈Ksy k∈Kxt
k, Kxy , Ksy , Kxt An actual demand (k); the rest are bundled demands fk ≤ f3,Kxy ; fk ≤ dk , ∀k ∈ Kxy
from one source (s) or all nodes in a cluster (x) to a
∑
k∈Kxy
target (t) or to all nodes in a cluster (y)
Figure 6: The basic flow allocation algorithm used by NCFlow; notation
Table 3: Additional notation specific to NCFlow.
used here is defined in Table 3.
SDN-based traffic engineering schemes [35, 38], in addi-
tion to repeatedly solving global optimizations, must maintain some of which can be solved independently and in parallel.
an up-to-date view of the topology, gather desired volumes We describe these sub-problems in §3.1. Although they can be
for demands and update traffic splits at switches based on the solved quickly, disagreements between independent solutions
result of the optimization. Our production experience is that can lead to infeasible allocations; we present a simple heuris-
most of these repetitive steps have a latency of a few RTTs tic in §3.2 that provably leads to feasible flow allocations.
(round trip times) and so solving the optimization dominates, In §3.3, we discuss extensions that increase the total flow al-
especially on large topologies. Moreover, demands are lim- located by NCFlow. We also show sufficient conditions under
ited to their allocated rates in software at the source servers which NCFlow is optimal and matches the flow allocated by
and thus allocating less than the full desired rate need not MaxFlow. Finally, in §3.5, we discuss how NCFlow uses fewer
result in packet loss [35]. Finally, applications that contribute forwarding entries by reusing pathlets within clusters and
a large fraction of the bytes moving between datacenters are splitting rules for different demands.
elastic in short timescales; e.g., large dataset transfers for data
analytics. That is, these apps seek a fast completion time but
do not need a large rate in every optimization epoch. Some 3.1 Basic Flow Allocation
other applications have a decreasing marginal utility as their
rate allocation increases such as video streams of varying We begin by describing a simple (but incomplete) version
quality [43]. Today’s SDN-based TE solutions [35, 38] use of NCFlow’s flow allocation algorithm; the pseudocode is
multiple priority classes to maximize allocations for elastic in Figure 6. We continue using Figure 2 as a running example.
traffic without affecting the latency-sensitive traffic. The basic algorithm proceeds in four steps.
In the first step, we allocate flow on the aggregated graph;
as shown in MaxAggFlow in Figure 6. In the aggregated graph,
3 NCFlow an example of which is in Figure 2 (right), nodes are clusters
and the edges are bundled edges from the original graph—
In this section, we describe NCFlow. Our steps are as shown the edge between the red and yellow clusters corresponds
in Figure 1. Offline, based on historical demands, we divide to the five edges between these clusters on the actual graph.
the network into clusters and determine paths. Further details Similarly, we bundle demands on the aggregated graph: the
are in §3.4. Online, we allocate flow to the current demands by demand Kxy between the clusters x and y corresponds to all
solving a carefully constructed set of simpler sub-problems, of the demands whose sources are in cluster x and targets are
178 18th USENIX Symposium on Networked Systems Design and Implementation USENIX Association.
"+,%&' " Problem # of Nodes # of Edges # of Demands
MaxFlow N M K
! # 2
,
MaxAggFlow η ≤ min(M, η2 ) ≤ min(K, η2 )
"+,%&' 0,)
! "#,%
, . (,)
≤ "+,%&' + "+,%&' ! "#,% , . MaxClusterFlow ∼ Nη + η ∼M η + 2η ∼ ηK2 + 2 Nη + η2
/' &'
≤ "+,%&' + "+,%&'
1,) )
Table 4: Sizes of the problems in Figure 6 using notation from Tables 2
Figure 7: An example illustrating how the flow allocated in MaxAggFlow and 3. Just verifying that flow is feasible (i.e., FeasibleFlow in Eq. 1) uses
translates to constraints on the flow to be allocated in MaxClusterFlow. O(# nodes ∗ # edges) number of equations and variables. NCFlow has one
instance of MaxAggFlow and executes the η instances of MaxClusterFlow in
in cluster y. The resulting flow allocation (f1 ) accounts for parallel. MinPathE2E and SrcTargetMax, are relatively insignificant.
bottlenecks on the edges between clusters. However, this flow 2
!" &
may not be feasible, since there may be bottlenecks within $" %"
the clusters. & & & & !"
1 1
$"
In the second step, we refine the allocation from step 1 to !# & $# %#
!# $#
1 1
account for intra-cluster demands and constraints. Specifically,
(a) Disagreement arising from bundling edges: As shown on the right, the algo-
we allocate flow for the demands whose sources and targets rithm in Figure 6 will allocate 2 units of flow but only 5ε units can be carried.
are within the cluster. We also allocate no more flow than
was allocated in f1 for the inter-cluster flows. MaxClusterFlow !" % $" !" 1
1
% % 1 1
in Figure 6 shows code for this step. We note a few details: !# $# !# !" 1 $"
% !# ` 1 $#
• We use virtual nodes to act as the sources and targets for 1 1
the inter-cluster flows; the flow allocated in f1 determines (b) Disagreement arising from bundling demands: As shown on the right, the
algorithm in Figure 6 will allocate 2 units of flow, but only 2ε units can be carried.
which virtual node (i.e., which neighboring cluster) is
the sender or the receiver for an inter-cluster demand.
• Figure 7 shows two examples on the right where the Figure 8: Illustrating how disagreements in flow allocation can occur in the
basic flow allocation algorithm; see §3.1.1.
virtual nodes are drawn using squares.
• Figure 7 also shows the NoMoreFlowThruCluster con- read directly from the fx2 solution of MaxClusterFlow. For
straints for demands from sources in the red cluster to demands that span clusters, however, more work remains be-
targets in the black cluster (depicted as x and z respec- cause the steps thus far do not directly compute their flow. In
tively). On the aggregated graph, the flow for this de- particular, f3 allocates flow for cluster bundles; such as say for
mand takes the two paths shown. In the red cluster, as all the demands whose sources are in cluster x and targets are
shown in the equation, the traffic from all sources (s), in cluster y. The corresponding per-cluster flow allocations, fx2
y
along multiple paths (r) to the virtual node, is restricted and f2 , allocate flow from a source node and to a given target
to be no more than what was allocated in f1 . respectively. Thus, in the final step, SrcTargetMax, we assign
• Figure 7 on the right also shows a more complex case the maximal flow to each inter-cluster demand that respects
that happens in the yellow cluster. Here, the traffic arrives all previous allocations.
at one virtual node but can leave to multiple virtual nodes.
In MaxClusterFlow, we set up paths between all pairs 3.1.1 Properties of Basic Flow Allocation
of virtual nodes. As shown in the equation, the traffic
leaving the red virtual node on paths (r) to either of the Solver runtime: The numbers of equations and variables in
other virtual nodes must be no more than the total flow the sub-problems are shown in Table 4. If the number of clus-
on paths p and q from f1 . ters η is 1, note that there is exactly one per-cluster problem,
• Observe that bundling demands ensures fewer variables MaxClusterFlow, which matches the original problem from
and constraints for MaxClusterFlow. The demand from Eqn. 2. When using a few tens of clusters, we will show in §5
red to black clusters comprises twenty node pairs in the that all of the sub-problems are substantially smaller than the
actual graph in Figure 2 (left); four sources in the red original problem (MaxFlow).
cluster and five targets in the black cluster. However, the Feasibility: The flow allocated by Figure 6 satisfies demand
MaxClusterFlow for the red cluster only has four bundled and capacity constraints; we will prove this formally in §B.1.
demands, from each source to the virtual node, and the For demands whose source and target are in different clusters,
yellow cluster has just one bundled demand from and to however, disagreements may ensue since the different prob-
virtual nodes. lem instances assign flow to different bundles of edges and
demands. We illustrate two such examples in Figure 8; both
In the third step, we reconcile end-to-end; that is, we find
have 1 unit of demand from s1 to t1 and from s2 to t2 . The
the largest flow that can be carried along each path on the
dashed edges have a capacity of ε
1 and all of the other
aggregate graph. As shown by MinPathE2E in Figure 6, for
edges have a very large capacity.
each bundle of demands and each path, we take the minimum
flow allocated (fx2 ) at each cluster on the path. • The example in Figure 8a illustrates an issue with
The flow allocation for the demands in a cluster x can be bundling edges. The actual graph on the left can only
USENIX Association 18th USENIX Symposium on Networked Systems Design and Implementation 179t t
s s
Figure 10: Contrasting with Figure 9, for the same cluster bundle, in a sub-
Figure 9: To guarantee feasibility, each cluster bundle is allocated flow on
sequent iteration, NCFlow allocates flow on a different path on the aggregate
only one path on the aggregated graph (left) and on only one edge between
graph and on different inter-cluster edges. The chosen paths and edges are
each pair of clusters (right); the usable path and edges are shown in dark red.
again shown in red.
Note that multiple paths can still be used within clusters.
carry 5ε units of flow for each demand. However, as the 3.3 Stepping towards optimality
figures on the right show, MaxAggFlow allocates two
The flow allocation algorithm described thus far is fast but
units of flow since the four edges between these two
not optimal; that is, it may allocate less total flow over all
clusters can together carry all of the two units of demand.
demands than the flow allocated by solving the larger global
The MaxClusterFlow instances also allocate two units
problem (MaxFlow from Eqn. 2). There are a few reasons
of flow as shown. The discrepancy arises because the
why this happens. The MaxAggFlow in Figure 6 allocates
problems in Figure 6 do not know that the top egress of
flow on paths through clusters without knowing how much
the left cluster can take in all of the demand of s1 but has
flow the clusters can carry. Switching the order, i.e., solving
only a low capacity to t1 .
MaxClusterFlow before MaxAggFlow, could be worse because
• The example in Figure 8b illustrates an issue with
each cluster must allocate flow without knowing how much
bundling demands. Here too, observing the actual net-
flow can be carried end-to-end. Furthermore, the heuristic
work on the left will show that 2ε units can be carried for
in §3.2 constrains each cluster bundle to use only one edge
each demand split evenly between the top and the bottom
between clusters and one path on the aggregated graph. We
path. Again, as the figures on the right show, the basic
now discuss a few extensions to increase the flow allocation.
flow allocation algorithm will conclude that both units
of demand can be carried. Here, the discrepancy arises First, we re-solve the problems in Figure 6 multiple times.
from the bundling of demands, the problems in Figure 6 A simple way to do this would be to deduct the allocated flow
cannot discern that the MaxClusterFlow instance of the and use the residual capacity on edges in the next iteration.
left cluster sends the first demand to the brown cluster Also, we pick different edges between clusters and/or different
while the MaxClusterFlow of the right cluster wants to paths on the aggregated graph in different iterations (see Fig-
receive the second demand from the brown cluster. ure 10 for an example). The number of iterations is config-
urable; we continue as long as the total flow increases in each
iteration by at least a pre-specified amount (say 5%). One
3.2 A feasible heuristic could apply other policies such as a timeout. We show in §5
that a small number of iterations suffice for a sizable increase
To avoid end-to-end disagreements, we make two simple in the total flow. We will also show that later iterations finish
changes to the basic flow allocation in §3.1. faster than the first iteration perhaps because fewer demands
First, when solving MaxAggFlow, only one path on the remain to satisfy.
aggregated graph can be used for all of the demands between Next, we empirically observe that the choice of clusters
a given pair of clusters; we call such groups of demands to be and edges/paths to use in different iterations has an effect on
cluster bundles. Next, between a pair of connected clusters, flow allocation. For instance, the disagreements in Figure 8
only one edge can carry the flow for a cluster bundle. Figure 9 go away by using a different choice of clusters—specifically,
shows in dark red an example path for a cluster bundle and the see Figure 31d and Figure 31e. We discuss how NCFlow
allowed edges between clusters; we also show the intra-cluster precomputes cluster and edge/path choice in §3.4.
paths that can carry flow for this bundle. To sum up, we prove that flow allocation will be optimal
There are multiple ways to avoid disagreements while keep- when a few sufficient conditions hold:
ing the problem sizes small via bundling. We discuss the
above changes here because they are simple and sufficient. Theorem 2. The method in Figure 6 leads to the optimal flow
Specifically, we show that: allocation when any path can be used within each optimiza-
Theorem 1. The algorithm in Figure 6, when constrained as tion and the number of clusters is 1 or equal to the number of
discussed above, will always output a feasible flow. nodes or all of the following conditions hold:
Proof. The proof is in §B.2. Intuitively, these changes suffice • the aggregated graph Gagg is a tree,
because the independent decisions made by different prob- • only one edge connects any pair of clusters,
lems in Figure 6 cannot disagree; per cluster bundle, all prob- • all demands are satisfiable.
lem instances allocate flow to the same edge and path.
180 18th USENIX Symposium on Networked Systems Design and Implementation USENIX AssociationProof. By optimal, we mean that the total allocated flow must apply modularity-based clustering with edge weights set
be as large as an instance of Equation 6 wherein any path can to their capacity.
be used. The proof is in §B.3. Intuitively, when the number • Spectral clustering [53] computes eigenvectors of the
of clusters is 1 and any paths can be used, a single instance of weighted adjacency matrix and chooses a desired number
MaxClusterFlow is identical to the optimal problem in Equa- of the top eigenvectors as cluster heads; each node is
tion 6. Similarly, when the number of clusters equals the assigned to the cluster of their closest eigenvector (e.g.,
number of nodes, MaxAggFlow is identical to the optimal using k-means).
problem. Furthermore, the conditions listed lead to optimality • Leader Election picks a desired number of nodes at ran-
because the optimal flow allocation can be transformed into dom as leaders and assigns each other node to the closest
an allocation that can be outputted by Figure 6. leader; wherein, distance is measured as the path length
using invcap edge weights.
Even though the listed conditions appear restrictive, note
that the topology within clusters can be arbitrary. We will Some other clustering techniques [5, 42, 65] can balance clus-
show in §5 that NCFlow offers nearly optimal flow allocations ter sizes or trade-off between concentration and balance but
even when the above conditions do not hold. are more complex computationally; it is possible that using
such schemes can further improve NCFlow.
3.4 Choosing clusters and paths Path choice in NCFlow: On the aggregated graph and on
each cluster graph, we pre-compute offline a small number of
The choice of clusters and paths affects both the solution paths between every pair of nodes. We consider the following
quality and runtime of NCFlow. We cast cluster choice as a different path choices and pick paths that lead to the largest
graph partitioning problem [5, 21, 65] with these objectives: flow allocation on historical demands:
• Concentrated with a low cut: NCFlow can output better
• k-shortest paths [70] with edge weight of 1 or c1e where
flow allocations when much of the total demand and the
ce is the capacity of edge e and k = 4, 8 or 16.
total edge capacity is between nodes in the same cluster.
• As above, but with the additional requirement that the
• Balanced cut: Intuitively, NCFlow will have a smaller
paths for a node pair are edge-disjoint [52].
runtime when the complexity of MaxAggFlow balances
with that of MaxClusterFlow. Recall from Table 4 that NCFlow also pre-computes offline (1) a pseudo-random
the former depends on the number of clusters whereas choice of which edges to use between a pair of connected
the latter depends on the size of the largest cluster. clusters in each iteration and (2) which path on the aggregated
We empirically observe, based on experiments with many graph to use for each cluster bundled demand in each iteration.
WANs and different types of demands, that:
√ 3.5 Setting up switch forwarding entries
• On a graph with N nodes, about N clusters, irrespective
of the clustering technique, leads to the best result, i.e., NCFlow uses many fewer switch forwarding entries than prior
smallest runtime and fewest forwarding entries while works due to the following reasons.
allocating nearly the largest amount of flow possible; First, the paths along which NCFlow allocates flow can be
see Figure 13. thought of as a sequence of pathlets [32, 47, 68] in each clus-
• When choosing the same number of clusters, one of the ter connected by crossing edges between clusters. Figures 9
three considered clustering techniques (described below) and 10 illustrate such paths on the right. This observation is
generally performs better than the others but not in all crucial because a pathlet can be reused by multiple demands.
cases; see Figure 21. For example, in Figure 9, the flow from any source in the red
Thus, the optimal clustering choice for a WAN is unclear; cluster to any target in the grey cluster would use the same
it is possible that hand-tuning or using a learning technique pathlets shown in the yellow, green, and blue clusters. Prior
may lead to better-performing clusters. Nevertheless, any of work [35, 36], on the other hand, establishes paths for each
the three simple clustering schemes discussed below already demand. Using pathlets has two advantages. The number of
suffice for NCFlow to improve substantially over baselines. pathlets used by NCFlow is about η times less than the number
We consider the following clustering choices because they of paths used by prior works2 . Furthermore, a typical pathlet
are simple and fast; unless otherwise noted, results in this has fewer hops than a typical end-to-end path. Thus, NCFlow
paper use FMPartitioning. uses many fewer rules to encode paths in switches.
2 More precisely, the number reduces from PN(N −1) to
• FMPartitioning [18, 25] divides nodes into clusters so as ∑x P(Nx )(Nx −1)
where P is the number of paths per node pair, the N nodes are divided into η
to maximize a “modularity” score which prefers more clusters, and cluster x has Nx nodes. If clusters are evenly sized, Nx = N/η,
edges to lie within than between clusters. In NCFlow, we and the ratio of these terms is ∼ η.
USENIX Association 18th USENIX Symposium on Networked Systems Design and Implementation 181Next, whenever NCFlow allocates flow at the granularity Topology # Nodes # Edges # Clusters
of cluster bundles, all of the demands in a bundle take the PrivateLarge ∼ 1000s ∼ 1000s 31
same paths and are split in the same way across paths. Hence, Kdl 754 1790 81
NCFlow uses one traffic splitting rule for all demands in such PrivateSmall ∼ 100s ∼ 1000s 42
Cogentco 197 486 42
bundles. For instance, the demands from source s in the red
UsCarrier 158 378 36
cluster in Figure 9 to any target in the grey cluster are split Colt 153 354 36
with the same ratio across the same pathlets in all clusters GtsCe 149 386 36
(except the grey cluster where they take different pathlets to TataNld 145 372 36
DialtelecomCz 138 302 33
reach their different targets). Thus, with NCFlow, the √number Ion 125 292 33
of splitting rules at a source decreases by a factor of N/23 . Deltacom 113 322 30
The paths and splitting rules to push into switch forwarding Interoute 110 294 20
tables are determined by the offline component of NCFlow Uninett2010 74 202 24
and only change occasionally. After each allocation, only the Table 5: Some of the WAN topologies used in our evaluation; see §5.1.
splitting ratios change. More details on the data-plane of
NCFlow such as how to compute the total flow that can be • How do our various design choices in NCFlow impact
sent by each demand and the splitting ratios as well as how to its performance?
move packets from one pathlet to the next are in Appendix C.
In §5, we measure the numbers of rules used by NCFlow. 5.1 Methodology
Here, we describe our methodology—the topologies, traffic,
4 Implementing NCFlow baselines, and metrics used in our evaluation.
Topologies: We use two real topologies from a large
Our current prototype of NCFlow is about 5K lines of Python enterprise—PrivateSmall is a production internet-facing WAN
code, which invokes Gurobi [33] v8.1.1 to solve all of the with hundreds of sites, and PrivateLarge is a larger WAN
optimization problems. For clustering WAN topologies, we that contains many more sites. We also use several topolo-
adapt [26] to find clusters that maximize modularity; we also gies from the Internet Topology Zoo [6] and reuse topolo-
use our own implementation of NJW spectral clustering [53]. gies used by prior works [19, 38]. Table 5 shows details
We use a grid search over the number of clusters (η) and for some of the used topologies; note that the topologies
the above clustering techniques to identify the best perform- shown are 10× to 100× larger than those considered by prior
ing choice for each topology on a set of historical traffic work [19, 35, 38, 44, 49].
matrices. To compare with state-of-the-art techniques, we
customize the public implementations of SMORE [44, 45] Traffic Matrices (TMs): We benchmark NCFlow on traffic
and TEAVAR [19]. We have also implemented Fleischer’s traces from PrivateSmall, which contain the total traffic be-
algorithm [27]; our implementation is about 10× faster than tween node pairs at 5-minute intervals. We also generate the
public implementations [8, 37] since we carefully optimize following kinds of synthetic traffic matrices for all topologies:
a key bottleneck in Fleischer’s algorithm. All of these code
• Poisson λ, δ models demands with varying concentra-
artefacts are available on GitHub [2]. tion; the demand between nodes s and t is a Poisson
random variable with mean λδdst , where dst is the hop
length of the shortest path between s and t and δ ∈ [0, 1)
5 Evaluation is a decay factor. We choose δ close to 0 or to 1 to model
strongly and weakly concentrated demands, respectively.
We evaluate NCFlow on several WAN topologies, traffic matri-
• Gravity v [14, 60]: The total traffic leaving a node is
ces, and failure scenarios to answer the following questions:
proportional to the total capacity on the node’s outgoing
links (parameterized by v); this traffic is divided among
• Compared to state-of-the-art LP solvers and approxi-
other nodes proportional to the total capacity on their
mate combinatorial algorithms, does NCFlow offer a
incoming links.
good trade-off between runtime and total flow alloca-
• Uniform [0, a) : The traffic between any pair of nodes
tion? Is it substantially faster, with only a small decrease
is chosen uniformly at random, between 0 and a.
in total flow?
• Bimodal [0, a), [b, c), p [14]: A p fraction of the node
• For real-world TE scenarios, in which flow solvers must
pairs, chosen uniformly at random, receive demands
adapt to changing demands and faults, how much benefit
from Uniform [b, c) while the rest receive demands
does NCFlow offer relative to the state-of-art?
from Uniform [0, a) . We use p = 0.2.
3 A source uses N − 1 splitting rules in prior works but with NCFlow only
requires Nx + η − 2 rules when the source’s cluster has N√
x nodes; if clusters
For each above model, we select parameters such that fully
√
are evenly sized and η ∼ N, the ratio of these terms is N/2. satisfying the traffic matrix leads to a maximum link utiliza-
182 18th USENIX Symposium on Networked Systems Design and Implementation USENIX Associationtion of about 10% in each topology. Then, we scale all entries NCFlow Fleischer-Path, = 0.5
in the TM by a constant α ∈ {1, 2, 4, 8, 16, 32, 64, 128}. Doing SMORE* Fleischer-Edge, = 0.5
1.0
Fraction of Cases
so creates demands that range from easily satisfiable to only
0.75
partially satisfiable; with α = 128, the satisfiable portion of
the demand varies between 25-70%. We generate five samples 0.5
for each traffic model and scale factor for each topology. 0.25 Better
Baselines: We compare NCFlow with these techniques: 0.0
0.5 0.6 0.7 0.8 0.9 1.0 1.1 1.2
Path Formulation (PF4 ) solves the multi-commodity max- Total Flow, relative to PF4
flow problem shown in Equation 2 using k-shortest paths be- (a) CDF of total flow relative to PF4
1.0
Fraction of Cases
tween node pairs where k = 4. Results for other path choices
are in §G.4. 0.75
PF Warm Start (PF4w ) matches PF4 except that it allows the 0.5
LP solver to “warm start”; that is, over a sequence of traffic 0.25 Better
matrices, the flow allocated to the previous TM is used as a 0.0
starting point to compute allocation for the next TM. When 10 2 10 1 100 101 102 103
traffic changes are small, warm start leads to faster solutions.
Speedup, relative to PF4 (log scale)
(b) CDF of speedup relative to PF4
Approximate Combinatorial Algorithms: Fleischer’s algo- Figure 11: CDFs comparing NCFlow with state-of-the-art methods. With
rithm [27] is the best-known approximation for MaxFlow. We only a modest decrease in total flow, NCFlow offers a substantial runtime
use two variants: Fleischer-Path where flow is restricted to speedup.
a path set and Fleischer-Edge without any path restrictions. NCFlow Räcke KSP Edge-Based
106
# of FIB entries (log scale)
We show results here for an approximation guarantee of 0.5;
that is, the techniques must achieve at least half of the optimal 105
Max
flow allocation. Results for other approximation guarantee 104
values are in [10]. 103
SMORE [44] allocates flow dynamically on paths that are pre- 108
107
Total
computed using Räcke’s Randomized Routing Trees (RRTs). 106
We use the code from [45] to compute paths. Since the LP 105
in [45] requires demands to be fully satisfiable, we imple- 202 294 372 486 1790
ment a variant, SMORE*, that maximizes the total flow on the # of Edges (log scale)
Figure 12: Comparing the number of forwarding entries used by various
computed paths, regardless of demand satisfiability. methods for the experiments from Figure 11.
TEAVAR [3,19] models link failure probabilities and computes solver runtimes, since models can be constructed once
flow allocations given an availability target. We implement offline in practice. For combinatorial methods, we report
a variant, TEAVAR*, that maximizes the total flow4 ; further algorithm execution time. All runtimes are measured on
details are in Appendix F. an Intel Xeon 2.3GHz CPU (E52673v4) with 16 cores
Clusters, Paths, and # of Iterations: Table 5 shows the num- and 112 GB of RAM.
ber of clusters used by NCFlow per topology. Here, we report • FIB Entries: We measure the number of switch forward-
results on edge-disjoint paths, chosen using inverse capacity ing entries used.
as the edge length; results for other path choices are quali-
tatively similar (see §G.4). All schemes that use paths (i.e.,
PF4 , Fleischer-Path, TEAVAR*, and NCFlow) use the same 5.2 Comparing NCFlow to the State of the Art
method to compute paths. For each iteration up to I = 6, we
also pre-compute offline the path to use on the aggregated Figures 11a and 11b show cumulative density functions
graph, and the edge to use between connected clusters for (CDFs) of the relative total flow and speedup ratio for NCFlow
each cluster bundle. and several baselines. These results consist of 2, 600 traffic
matrices and 13 topologies. If a scheme matches the baseline
Metrics: We compare the schemes on the following metrics: PF4 , its CDF will be a pulse at x = 1 in both figures; the
• Relative total flow is the total flow achieved by a fraction of cases to the left (or right) of x = 1 indicate how
scheme relative to PF4 . often a scheme is worse (or better) than PF4 . Note that the
• Speedup ratio is the runtime of each scheme relative x-axis for the speedup ratio is in log scale.
to PF4 . For LP-based methods, we report the Gurobi We see that SMORE*, shown using green dashed lines in
the figures, modestly improves the flow allocation (in 25% of
4 TEAVAR [3, 19] maximizes the concurrent flow; see Table 1 the cases) while almost always taking longer to run than PF4 .
USENIX Association 18th USENIX Symposium on Networked Systems Design and Implementation 1831.0 103 1.000
Total Flow,
rel. to PF4
Speedup, rel. to PF4
Metric, rel. to PF4
0.8 0.975
(log scale)
0.6 Total Flow Relative 102 NCFlow PF4w
# of FIB Entries Speedup
0.4 10.0
Speedup, rel. to PF4
101
0.2 7.5
0.0 0 100 5.0
50 100 150 200
# of Clusters
Figure 13: NCFlow’s performance when using different numbers of clusters 2.5
on PrivateLarge. The speedup ratio is plotted on the right y-axis in log scale;
0 5 10 15 20 25
the other metrics use the left y-axis. Time (days)
Both effects are because SMORE* allocates flow on Räcke’s Figure 14: Allocated flow and speedup relative to PF4 on a sequence of
RRTs instead of k-shortest paths. production TMs from PrivateSmall. In half of the cases, NCFlow allocates at
least 98.5% of the flow and is at least 8.5× faster.
The edge and path variants of Fleischer’s, shown using
purple and red lines in the figures, perform similarly; since
they are approximate algorithms, they allocate less flow than flow that is allocated by NCFlow. Later iterations are faster
PF4 in roughly 50% of cases, but are also faster than PF4 perhaps because they have less traffic to consider.
in slightly less than 50% of cases. We conclude that these Breaking down the runtime by the steps in Figure 6, we
approximate algorithms are not practically better than PF4 . see cases where MaxClusterFlow accounts for over 70% of
In contrast, NCFlow, shown with dark blue lines in the fig- NCFlow’s runtime perhaps because the largest cluster contains
ures, almost always allocates at least 80% of PF4 ’s total flow, a large fraction of the nodes. Better cluster choice or recur-
while achieving large speedups. In the median case, NCFlow sively dividing the largest clusters can further lower runtime.
achieves 98% of the flow and is over 8× faster. These im-
provements accrue from NCFlow solving smaller optimization 5.4 NCFlow on Real-World Traffic
problems than PF4 .
Figures 18 and 19 tease apart the above results by load, Here, we experiment with a sequence of traffic traces collected
traffic type and topology. Figures 23–27 show results for alter- on the PrivateSmall WAN. Figure 14 plots the moving average
nate path choices. Taken together, these results indicate that (over 5 windows) of the total flow and speedup relative to PF4
NCFlow’s improvements hold across a variety of scenarios.
for two schemes—NCFlow in blue and PF4w in light blue. The
figure shows that PF4w ’s warm start yields a median speedup
For the same experiments considered above, Figure 12
of 1.66×. NCFlow achieves a consistently higher speedup
shows the number of switch forwarding entries used in dif-
(8.5× in the median case), and the flow allocation is nearly
ferent topologies. (A full set of results is in Table 6.) The
optimal: the median total relative flow is 98.5%, and NCFlow
bottom plot is the total number of forwarding entries across
always allocates more than 93%.
all switches, while the top shows the maximum for any switch.
Note that both the x and y axes are in log scale. NCFlow con-
sistently uses fewer forwarding entries; using NCFlow offers 5.5 Tracking Changing Demands
a greater amount of relative savings than switching from all
Here, we evaluate the impact of a technique’s runtime on its
edges to just a handful of paths per demand. The savings
ability to stay on track with changing demands. Specifically,
from NCFlow also increase with topology size. The reason,
on the PrivateLarge topology, we use a time-series of traffic
as noted in §3.5, is that NCFlow reuses pathlets and traffic
matrices, wherein a new TM arrives every five minutes and
splitting rules for many different demands.
the change from one TM to the next is consistent with the
findings in Figure 4 (more details are in Figure 20). At each
5.3 Effect of Design Choices time-step, all techniques have the opportunity to compute a
new allocation for the current TM or to continue computing
Figure 13 shows how NCFlow’s performance varies with the the allocation for an earlier TM if they have not yet finished;
numbers of clusters used on PrivateLarge. While NCFlow al- in the latter case, their most recently computed allocation will
locates roughly the same amount of total flow, using about be used for the current TM. For example, a technique that
30 clusters improves runtime and reduces forwarding entries. requires five minutes to compute a new allocation will be
Figure 21 compares NCFlow’s performance when using dif- always one window behind, i.e., each TM will receive the
ferent clustering techniques; more details are in §G.2. allocation that was computed for the previous TM.
Recall from §3.3 that NCFlow uses multiple iterations Figure 15 shows the fraction of demand that is satisfied
of Figure 6. In the above experiments, the first iteration alone by three different schemes; we also show the value for an
accounts for 75% of the runtime and for roughly 90% of the instantaneous scheme which is not penalized for its runtime.
184 18th USENIX Symposium on Networked Systems Design and Implementation USENIX AssociationInstant PF4 NCFlow PF4 PF4w 1
100% 0.8
CDF (over faults)
80%
Satisfied Demand
0.6
60% 0.4
NCFlow before fault
NCFlow after recompute
NCFlow after fault
40% 0.2
TEAVAR* before fault
TEAVAR* after re-balance
Reuse Prev. Allocation TEAVAR* after fault
20% 0
-0.1 0 0.1 0.2 0.3 0.4 0.5 0.6 0.7 0.8
Loss = 1 - (Flow carried by scheme/ Flow carried by PF 4 when no fault)
0% (a) CDFs of the flow loss before faults, immediately after faults and after recovery (B4
0 20 40 60 80 100 120 topology, many traffic matrices and faults; see §5.6).
Time (mins)
NCFlow TEAVAR* TEAVAR 1
Figure 15: When demands change, how solver runtimes affect flow allocation 1
on PrivateLarge: Due to the slow runtime, PF4 and PF4w carry only 62%
Total Flow, relative to PF4
0.8
of the traffic that can be satisfied by Instant PF4 , a (hypothetical) scheme
CDF (over faults)
0.8
which has zero runtime. NCFlow carries 87% of the traffic since its faster 0.6
runtime compensates for its sub-optimality. NCFlow recomputes
0.6
0.4
PF4 ’s average runtime here is over 15 minutes; hence, as 0.4
the orange dashed line shows, PF4 is able to compute a new 0.2
allocation only for every third or fourth TM. This leads to 0.2 Tunnels rebalance
Fault happens 0
substantial demand being unsatisfied: for node pairs whose 0
0 5 10 15 20
Time Recompute Time (ms)
current demand is larger than before, PF4 will not allocate
(b) Timelapse of when a fault occurs (B4 topology, Uni- (c) NCFlow’s time to re-
enough flow. On the other hand, node pairs whose current form traffic matrix, β = 0.99) compute after fault.
demand is less than their earlier demand will be unable to Figure 16: Comparing failure response of NCFlow with prior work.
fully use PF4 ’s allocation. As the figure shows, PF4 only
satisfies 53% of the changing demand on average, whereas traffic splits when a failure happens; doing so takes about one
Instant PF4 satisfies 87% of the demand. RTT on the WAN. Given a parameter β, TEAVAR* guarantees
PF4w (the dash-dot light blue line), where the solver warm that there will be no flow loss after the tunnels re-balance
starts using the previous allocation, is modestly faster than with a probability of 1 − β. See §F for more details. We use
PF4 on average. As the figure shows, the average demand β = 0.99, as recommended in [19]. NCFlow, on the other hand,
satisfied by PF4w is only slightly larger than PF4 (about 54%). recomputes flow allocations taking into account the links that
In contrast, NCFlow (the solid dark blue line) finishes well have failed; doing so takes one execution of NCFlow and some
within five minutes which allows allocations to change along RTTs to change the traffic splits at switches; more details are
with the changing demands. We find that on average NCFlow in §E. Figure 16c shows that the recomputation time is well
satisfies 75% of the demands; its smaller runtime more than within one RTT on the WAN.
makes up for sub-optimality, allowing NCFlow to carry more Figure 16b shows a timelapse of the flow carried on the
flow than PF4 when demands change. network before the fault, immediately after the fault, and after
recovery. As the figure shows, TEAVAR* can have a smaller
loss and for a shorter duration; i.e., until sources rebalance
5.6 Handling Failures with NCFlow traffic while NCFlow can carry more flow before fault and
Here, we evaluate the effect of link failures. As we note in §F, after recovery; moreover, the fast solver time can reduce the
TEAVAR* did not finish within several days on any of the duration of loss.
topologies listed in Table 5 because when all possible 2-link Figure 16a shows CDFs over many faults and traffic ma-
failure scenarios are considered, the number of equations and trices for NCFlow and TEAVAR*. We record the flow loss at
variables in the optimization problem increase from O(N 2 ) three stages: before the fault, immediately after the fault, and
for MaxFlow to O(M 2 N 2 ) for TEAVAR [19], where N and after recovery. As the figure shows, NCFlow’s ability to carry
M are the numbers of nodes and edges, respectively. Hence, more flow before the fault and after recovery more than com-
we report results on the 12-node, 38-edge WAN topology pensates for the slightly larger loss it may accrue in between.
from B4 [38]. We generate synthetic traffic matrices as noted
in §5.1. Using link failure probabilities from TEAVAR [3], we 6 Discussion
generate several hundred failure scenarios and, for each TM,
we measure the flow carried by NCFlow and TEAVAR* before Extending beyond MaxFlow: FeasibleFlow is a common con-
the fault, immediately after the fault, and after recovery. straint for many objectives beyond MaxFlow (see Table 1).
A key difference in fault recovery between NCFlow and Since the algorithm in §3.1 and the heuristic in §3.2 guarantee
TEAVAR* is that TEAVAR* requires sources to rebalance the feasibility, NCFlow can apply to objectives beyond MaxFlow;
USENIX Association 18th USENIX Symposium on Networked Systems Design and Implementation 185however, we believe that more work is needed to improve the similar intra-node scheme and can support WANs that are
solution quality for different objectives. 10× larger than were considered in [36]. The specific con-
Optimality guarantee: In §I, we show that constraining by traction used by NCFlow—node clusters with large capacity
clusters and paths, as done by NCFlow, does not necessar- and/or demand between themselves—also differs from the
ily reduce the flow allocation; that is, nearly the maximum contractions used in route planning [4, 9, 15]. Some BGP-
amount of flow can be carried while respecting clustering and based TE schemes [24, 62, 69], which address how best to
path constraints. This is promising because a better heuristic move traffic between different (BGP) domains, are also com-
(than Figure 6) may allocate more flow without losing the plementary to NCFlow which considers the WAN of a single
benefits of solving smaller per-cluster problems. Furthermore, enterprise (domain). Other TE schemes use different proto-
although NCFlow achieves sizable speedups by using simple cols, such as OSPF, or work over longer timescales (e.g., hours
clustering methods, the optimal cluster choice is uncertain; to days) [29, 39, 46, 51].
we show examples in §H to illustrate the challenges. Multi-Commodity Flow Solutions: Both the edge- and path-
Recursive (or multiple levels of) clusters: For large topolo- based LP formulations are well-studied [16, 67]. Some works
gies or when the largest cluster has a disproportionate number consider the case of a single commodity, i.e., one source and
of nodes, we can further divide a cluster into sub-clusters. target, and do not directly extend to the case of multiple com-
Doing so is an extension of the algorithm in Figure 6 where, modities [34,48,55]. The best-known approximate algorithms
in the iterative step, the MaxClusterFlow problem at a cluster for multi-commodity flow problems incrementally allocate
is replaced with a new instance of all of the steps in Fig- flow on the shortest path and increase the length of all edges
ure 6 along with the additional constraints that arise from the on that path [17, 27, 30, 41]. For the problem sizes considered
current level (e.g., NoMoreFlowThruCluster constraints). We here, LP solvers such as Gurobi are faster in practice, perhaps
leave further details to future work. because they take larger steps towards the optimal allocation.
A few works customize LP solvers to improve performance
on flow problems [23, 50]. NCFlow is agnostic to the solver
7 Related Work used and can use any solver for the sub-problems in Figure 6.
NCFlow builds upon a few themes in prior work. We dis- Decompositions: Using standard decomposition techniques
cuss and evaluate against some prior works already. To recap: for large optimization problems, such as Dantzig-Wolfe and
(1) Some large enterprises use path-based global optimiza- Benders [16,20], for multi-commodity flow problems has lead
tion problems similar to MaxFlow to manage traffic on their to inconclusive results [31,54]; i.e., not consistently faster than
WANs [35, 36, 38]. We saw in §5 that doing so does not MaxFlow. NCFlow can be thought of as a problem-specific de-
scale to the WAN topologies of today or the future, which composition that leverages the observation that both capacity
consist of thousands of sites; (2) We saw that approximate and demands are concentrated in today’s WANs.
algorithms for multi-commodity max flow, such as [27], re-
quire a large number of switch forwarding entries since they 8 Conclusion
can send flow along any edge. Also, NCFlow allocates more
flow and is faster compared to path-based versions of these We present a fast and practical solution for allocating flow
algorithms. (3) Probabilistic fault protection schemes such as on large WANs. We leverage the concentrated nature of de-
TEAVAR [19] take infeasibly long to run on large topologies mands and topologies to divide nodes into clusters and solve
when considering multiple link failures; they also allocate less sub-problems per cluster and on the aggregated graph. Our
flow to reserve capacity to deal with possible failures. Other heuristics guarantee feasibility and empirically achieve close-
oblivious techniques [13,14,19,44,49,66] have a similar trade- to-optimal flow allocations. By reusing pathlets and splitting
off. Quickly recomputing using NCFlow trades off slightly rules across demands, we require fewer forwarding entries in
more loss after a fault to carry much more traffic before the switches. Empirically, on topologies that are over 10× larger
fault and after recomputation; hence, we believe that NCFlow than were considered in prior work and many traffic matrices,
is better suited to enterprise WANs, which target very high our solution NCFlow is 8.2× faster than the state of the art,
link utilization and have traffic that is elastic to short-term while allocating 98.8% of the total flow and using 6× fewer
loss (e.g., scavenger-class traffic, such as replicating large forwarding entries in the median case. We demonstrate that
datasets [35, 38, 49]). Here, we discuss other related work. NCFlow offers sizable benefits when tracking changing de-
TE on WANs: Typically, a WAN node is not a single switch, mands and reacting to failures. As enterprise WANs continue
but rather a group of switches connected in a specific way to grow, we believe techniques such as NCFlow can enable
such as a full mesh. Similarly, a WAN edge is a systematic improved traffic orchestration and higher link utilization.
collection of links between many switches. [36] discusses Acknowledgements: We thank Himanshu Raj, Umesh Kr-
how to hide the intra-node connectivity from the global TE ishnaswamy, Dejan Kostic, Jakub Tarnawski and the NSDI
solution. NCFlow complements this technique; it can use a reviewers for comments which improved this paper.
186 18th USENIX Symposium on Networked Systems Design and Implementation USENIX AssociationYou can also read