Consistency and identifiability of football teams: a network science perspective - Nature
←
→
Page content transcription
If your browser does not render page correctly, please read the page content below
www.nature.com/scientificreports
OPEN Consistency and identifiability
of football teams: a network
science perspective
D. Garrido1,2, D. R. Antequera1,2, J. Busquets3, R. López del Campo4, R. Resta Serra4,
S. Jos Vielcazat4 & J. M. Buldú1,2,5*
We investigated the ability of football teams to develop a particular playing style by looking at
their passing patterns. Using the information contained in the pass sequences during matches, we
constructed the pitch passing networks of teams, whose nodes are the divisions of the pitch for a given
spatial scale and links account for the number of passes from region to region. We translated football
passings networks into their corresponding adjacency matrices. We calculated the correlations
between matrices of the same team to quantify how consistent the passing patterns of a given team
are. Next, we quantified the differences with other teams’ matrices and obtained an identifiability
parameter that indicates how unique are the passing patterns of a given team. Consistency and
identifiability rankings were calculated during a whole season, allowing to detect those teams of
a league whose passing patterns are different from the rest. Furthermore, we found differences
between teams playing at home or away. Finally, we used the identifiability parameter to investigate
what teams imposed their passing patterns over the rivals during a given match.
Is it possible to quantify to what extent a team has a defined playing style? During the last years, this question
has captured the attention of many scientists working on sports s ciences1–4. Year after year new technologies are
incorporated to obtain more information about any action carried out by players on the pitch. Consequently,
the acquisition of event and tracking data has boosted in-depth analysis of football, leading to the definition
of new metrics to characterize the player and team p erformance5. Understanding the team’s organization and,
particularly, the identification of playing styles has benefited from these new m ethodologies6. For example,
departing from the position of all players of a given team during a match, Moura et al.7 calculated the convex
hull, i.e., the area covered by the contour of the player’s position. Next, they analyzed the convex hull′s fluctua-
tions, quantifying players’ ability to spread and compact depending on the phases of the game, which was linked
to a team’s playing style.
Performance indicators have also been successfully used as a proxy to determine playing styles in football.
In8, several passing parameters (e.g., passes per action, passing directions, and target players) and rates of passing
success were combined to define an Index of Game Control (IGC). An Index of Offensive Behaviour (IOB) was
also introduced by combining parameters of ball possession, gain of possession and quality of possession. IOB
allowed to distinguish between two playing styles, namely, possession play and direct play. Interestingly, IOB
revealed that most successful teams preferred possession play. More recently, Fernandez-Navarro et al.9 collected
19 team performance indicators (14 during the attacking phase and 5 for the defending one) and automatically
classified the playing styles of LaLiga and Premier League teams. Six different factors (e.g., direct/possession
play, pressure area, possession width, etc..) were used to define the different playing styles, and the results of the
analysis identified 12 different styles according to the score obtained at each factor.
However, despite the advances for an “algorithmic recognition” of the playing style, a fundamental obstacle
remains: The team’s playing style is a subjective concept that relates to the team’s overall use of the different
playing methods. The team formation, consisting on how players of a team are distributed on the field, has been
traditionally used as a proxy to identify the way a team plays. With this regard, the starting line-ups given by
the coaching teams to the media at the beginning of a football match are used to describe how players will be
organized at the pitch. Classical team formations, such as 4-4-2 or 4-3-3, are then suggested by experienced
journalists to be expected during the match. Team formation indicates the position of all players, except for the
1
Complex Systems Group & GISC, Universidad Rey Juan Carlos, 28933 Madrid, Spain. 2Laboratory of Biological
Networks, Center for Biomedical Technology, UPM, Pozuelo de Alarcón 28223, Madrid, Spain. 3E.S.A.D.E. Business
School, Barcelona, Spain. 4Mediacoach-LaLiga, 28043 Madrid, Spain. 5Unmanned Systems Research Institute,
Northwestern Polytechnical University, Xi’an 710072, China. *email: javier.buldu@urjc.es
Scientific Reports | (2020) 10:19735 | https://doi.org/10.1038/s41598-020-76835-3 1
Vol.:(0123456789)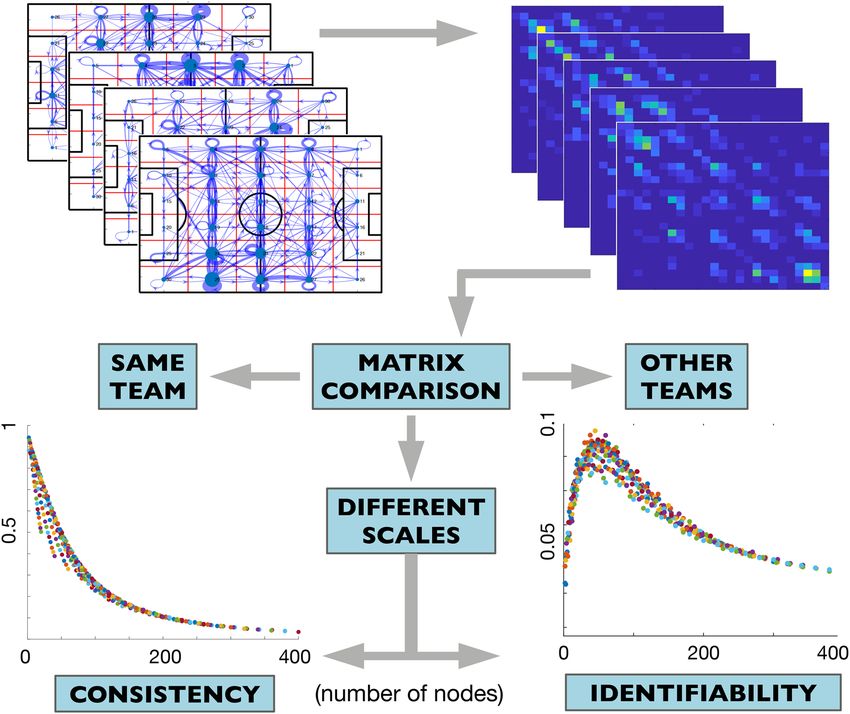
www.nature.com/scientificreports/
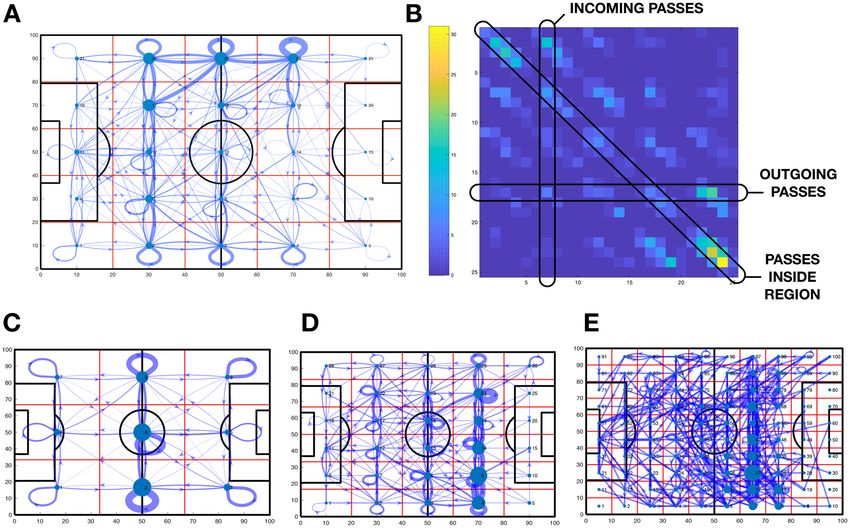
Figure 1. Pitch passing networks. In (A), an example of the pitch passing network of Real Madrid during its
match against Getafe (season 2018/2019). The pitch is divided into a p × q grid, leading to m = p × q nodes. In
this particular example, p = q = 5 and m = 25. The width of each link is proportional to the number of passes
aij from node (region) i to node j. In (B), we plot the corresponding weighted adjacency matrix A of the pitch
passing network plot in plot (A). The element A{i, j} contains the number of passes from node i to node j. Note
that line k of the matrix contains all outgoing passes from node k. On the other hand, column k accounts for
the passes entering region k. The diagonal elements contain the number of passes starting and finishing inside
each of the k nodes. In (C–E), pitch passing networks of Real Madrid during a match against F.C. Barcelona at
different scales. Note that, despite passes are the same, the fact that the pitch is divided into areas of different
sizes results on different pitch passing networks.
goalkeeper, towards the opponent’s goal in a qualitative way. For example, the 4-4-2 formation is characterized
by 4 defenders (two center-backs in the middle, two full-backs on the left and right sides), 4 midfielders (two
central midfielders, two wingers on the left and right sides) and 2 strikers. Teams (and coaches) are supposed to
be identified with one (or two) specific team formation, being one of the leading indicators of a team’s playing
style. However, nothing is simple in football. As explained by Wu et al.3 the formation of players evolves during
the match, which recommends the use of tracking algorithms that continuously evaluate the team formation
during the different phases of the game.
In this paper, we propose an alternative way of analyzing the playing styles of football teams. Our main aim
is to determine whether specific teams maintain their playing style along a season and, more importantly, if it is
possible to distinguish the particular organization of a given team from the rest. We focused on questions such as
what teams adapt to others and what teams remain loyal to their styles? Or, can we quantify what team imposed
its style over its opponents during a given match? To answer these questions, we propose a new methodology to
analyze the passing patterns of a given team and evaluate whether they are maintained along a season. Using event
data supplied by Mediacoach10, we constructed the passing networks associated with each team and analyzed
their structures using different methodological tools coming from Network S cience11.
The application of Network Science to a diversity of fields, from epidemics to social networks or brain dynam-
ics, has demonstrated the utility of this new branch of science in analyzing complex problems from new perspec-
tives. In recent years, different research papers have proposed the adaptation of a diversity of network metrics to
football12–14, showing the possibility of evaluating the performance of players and t eams15–17. The fundamental
difference between Network Science and classical analysis about team organization and performance is that the
attention is not paid to the individual components (i.e., players) but, on the contrary, considering the system as
a whole. Following this approach, we used the event datasets to construct the multi-scale pitch passing networks
of football teams. Specifically, we divided the pitch into m regions and constructed the pitch-passing networks,
whose nodes are the m divisions of the pitch and the links between nodes account for the number of passes from
one region to any other during a match (see Fig. 1A, for an example). Pitch passing networks have been used
Scientific Reports | (2020) 10:19735 | https://doi.org/10.1038/s41598-020-76835-3 2
Vol:.(1234567890)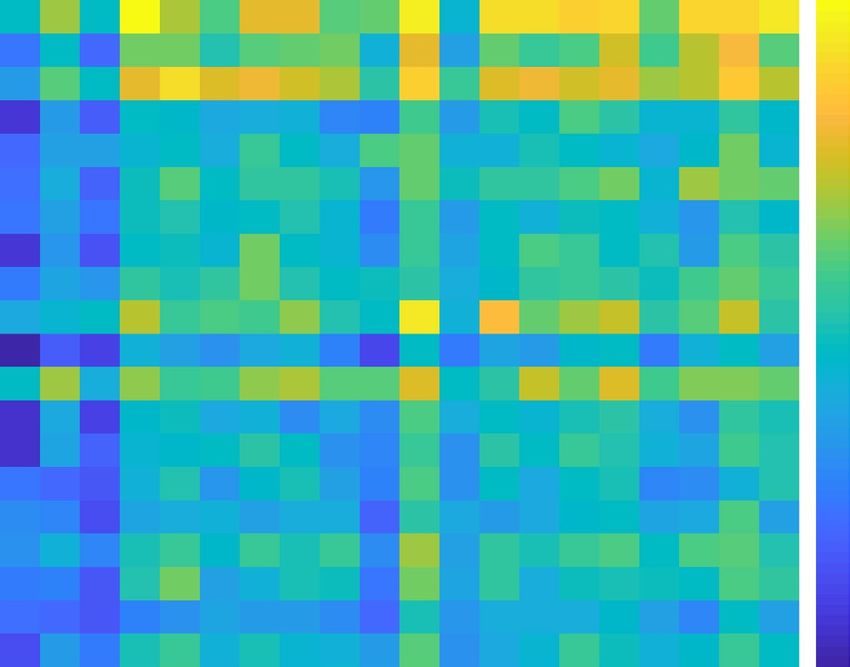
www.nature.com/scientificreports/
Ranking (2018/2019) Team Points Scored goals Conceded goals
1 F.C. Barcelona 87 90 36
2 Atlético de Madrid 76 55 29
3 Real Madrid 68 63 46
4 Valencia 61 51 35
5 Getafe 59 48 35
6 Sevilla 59 62 47
7 R.C.D. Espanyol 53 48 50
8 Ath. Bilbao 53 41 45
9 Real Sociedad 50 45 46
10 Real Betis 50 44 52
11 Alavés 50 39 50
12 Eibar 47 46 50
13 Leganés 45 37 43
14 Villarreal 44 49 52
15 Levante 44 59 66
16 Valladolid 41 32 51
17 Celta de Vigo 41 53 62
18 Girona 37 37 53
19 S.D. Huesca 33 43 65
20 Rayo Vallecano 32 41 70
Table 1. Teams and ranking at the end of the season 2018/2019 of LaLiga Santander. Ranking, points, number
of scored goals and conceded goals.
to quantify team p erformance16 and analyze differences in the playing patterns of football t eams18. In our case,
we tracked the evolution of the pitch-passing networks of Spanish football teams playing at the first division of
LaLiga during the season 2018/2019. We defined a consistency parameter of each team, which measures how
similar the organization of pitch passing networks is during the season. Next, we analyzed how different pitch
passing networks are from the rest of the teams, and we defined a new parameter called the team identifiability.
We borrowed this idea from neuroscience, where identifiability consists of the ability to identify the functional
brain networks of one individual from a group of functional networks of different people19,20. We propose to use
the identifiability parameter to determine what teams have particular passing patterns and what teams change
their passing distribution according to their rivals. Finally, we showed that the identifiability parameter could
quantify to what extent a team imposed their passing patterns over the other in a given match.
Methods
Datasets. Datasets were acquired through Mediacoach10, whose event provider is StatsPerform21. From all
events recorded during a match, we focused in all passes made during each match of the 2018/2019 season of the
first division of the Spanish national league “LaLiga”. Twenty teams played the competition (see Table 1 for the
final ranking). For each of the 380 matches played during the season, we considered the number of successful
passes of each team. The information about the passes contained, for a pass i: (1) the precise moment t(i) when
the pass was made, (2) the x and y coordinates of the position from where the pass was sent [x1 (i), y1 (i)] and (3)
the position where the pass was received [x2 (i), y2 (i)]. Importantly, the x and y coordinates were given in “field
units”, ranging, in both axes, from 0 to 100 (in all fields). The information about the home and away teams of
each match was also used in the analysis.
Multi‑scale pitch passing networks. Pitch passing networks describe how the ball flows through the
field during the possession of a given team using specific partitions of the pitch18. The construction of this kind
of networks requires several steps, beginning with the division of the pitch into m = p × q areas, each one corre-
sponding to a node of the passing network, as shown in Fig. 1A. In this particular example, the field was divided
into 5 × 5 rectangular areas (i.e., m = 25 areas or nodes). Next, we considered all completed passes made by a
given team during a match. The links connecting the nodes of the network represented the number of passes
made from each region (i.e., node) to any other. In Fig. 1A arrows are the representation of those links, whose
width is proportional to the number of passes between nodes. In turn, we can see in Fig. 1A that some areas
have loops, which correspond to passes that start and finish inside the same area. On the other hand, nodes’
sizes are proportional to their importance, which are obtained through the eigenvector centrality, a measure to
quantify the relevance of a node inside a network22. The adjacency matrix A is the mathematical abstraction of
the pitch passing network, whose elements ai,j account for the number of passes starting in area i and finishing
in area j. The ai,i elements of the diagonal are the number of passes that do not cross the boundaries of the region
i. Importantly, the adjacency matrix A has crucial information about each area of the pitch. As we can see in the
Scientific Reports | (2020) 10:19735 | https://doi.org/10.1038/s41598-020-76835-3 3
Vol.:(0123456789)www.nature.com/scientificreports/
example of Fig. 1B, the i-row of the matrix contains the number of out-going passes of area i, while the i-column
has the number of the incoming passes.
It is worth noting that the number of nodes and, in turn, the structure of the pitch passing networks crucially
depends on the number of divisions of the field. In Fig. 1C–E we plot the pitch network of the same team, for the
same match, at three different partitions: 3 × 3 (C), 5 × 5 (D) and 10 × 10 (E). Increasing the number of divisions
results in an increase of nodes, while the number of passes remains the same. Therefore, the average weight of
the links decreases as it does the link density. Indeed, some nodes could get disconnected from the rest when
the pitch division leads to a high number of nodes, as shown in the case of Fig. 1E (see the disconnected area at
the bottom left). However, we should not consider this fact as a drawback. On the contrary, it means that each
scale leads to different networks and, consequently, different information, suggesting a multi-scale analysis of
pitch passing networks.
Calculating consistency and identifiability. The next step was to evaluate if teams’ pitch networks
maintain their organization along a season and if networks of certain teams have unique properties not shared
with other teams. With this aim, we first analyzed the pitch networks of each team for each match of the sea-
son. Specifically, for a given team and given match we obtained the p × q pitch networks with 1 ≤ p ≤ 20 and
2 ≤ q ≤ 20, leading to passing networks from m = 2 nodes to m = 400 nodes. In this way, each pitch network
corresponds to a different spatial scale; the higher the number of nodes, the smaller the area associated with
them, and the higher the spatial resolution. Next, we computed, for each scale, the correlation between all the
adjacency matrices of each team. Given a specific scale m, the correlation between two matrices A(m) and B(m)
is obtained as:
i j (A(m)i,j − Ā(m))(B(m)i,j − B̄(m))
C(m) =
2
2
(1)
i j (A(m) i,j − Ā(m)) i j (B(m) i,j − B̄(m))
This way, we call “scale-consistency” C(m) to the average correlation between matrices of the same team at each
scale, where m is the number of divisions of the pitch. Finally, the team “average consistency” |C| is computed
as the average of the scale-consistency, |C| = �C(m)�. Figure 2 shows a qualitative description of the process
undergone. The bottom left plot shows an example of the consistency C(m) of a team at different scales. We can
observe how C(m) decreases as the number of nodes increases. The reason is that a low number of nodes leads
to small networks with a low number of links (with a high weight), and, as a consequence, there is less diversity
in the possible network structures. We can also observe that there are different combinations of the pitch divi-
sion leading to the same number of nodes, e.g., we can have m = 20 with p = 4 and q = 5 or, conversely, with
p = 5 and q = 4.
We can also quantify how different pitch-passing networks of a team are compared with other teams’ net-
works. With this aim, we first obtained the scale-consistency C(m) of a given team following the process explained
above. Next, we calculated the correlation R(m) of all passing networks of a team (at all scales) with the rest
of the league’s teams. This can be done by considering matrices A(m) of Eq. (1) belonging to a given team and
matrices B(m) corresponding to the rest of the teams. We called this parameter the “rival correlation” R(m),
where m indicated the number of partitions (nodes) of the scale at which the correlation is calculated. Finally,
we define the “scale-identifiability” I(m) of a team as the team’s scale-consistency C(m) minus the rival correla-
tion R(m), i.e. I(m) = C(m) − R(m). Finally, we can calculate the team average identifiability |I| as the mean
value of the scale-identifiability, |I| = � I(m)�. Note the implications of the identifiability parameter |I|: Teams
with a high value are those whose pitch passing networks are consistent, i.e., have a similar organization for all
matches but, at the same time, are different from the rest of the teams. Again, Fig. 2 shows an example of the
scale-identifiability (bottom-right plot) of a team. In this case, the function shows a maximum for a particular
scale, which corresponds to a number of nodes around m = 50. This fact reveals that pitch partitions around
this scale better capture the characteristic features of this particular team’s passing networks.
Results
First, we computed the scale-consistency C(m) and the average consistency |C| of the 20 teams of LaLiga
2018/2019 season. Figure 3A,B shows, respectively, the scale-consistency of the teams that ranked first, F.C.
Barcelona (FCB), and last, Rayo Vallecano (RV), at the end of the season. In both cases, we obtained a monotoni-
cally decaying function indicating that the higher number of divisions of the pitch, the lower the consistency of
both teams. The same pattern is also reported for all teams of the competition (see Supplementary Information).
However, scale-consistency has differences between teams, as we can observe in Fig. 3C, where we plot the dif-
ference between the scale-consistencies of both teams CFCB (m) − CRV (m). As we can see, scale-consistency is
higher at F.C. Barcelona, no matter what the number of divisions of the pitch is and, furthermore, the difference
is maximum around m ∼ 50, revealing that there is a particular scale where F.C. Barcelona was much more
consistent than Rayo Vallecano.
Figure 3D shows the average consistency of all teams for matches played at home (x-axis) and away (y-axis).
First, we restricted the calculation of the scale-consistency C(m) to matches played just at home or just away,
leading to C(m)home and C(m)away , respectively. Next, we obtained |C|home and |C|away by averaging both scale-
consistencies. The red solid line of Fig. 3D corresponds to |C|home = |C|away and it is plot to help the reader
detecting whether a team has more consistency playing at home (points below the line) or away (points above
the line). We can observe how all teams but one (Rayo Vallecano) have higher average consistencies when playing
at home, since they are placed below the line |C|home = |C|away . Thus, the increase in consistency could be one
Scientific Reports | (2020) 10:19735 | https://doi.org/10.1038/s41598-020-76835-3 4
Vol:.(1234567890)www.nature.com/scientificreports/
Figure 2. Qualitative description of how the consistency and identifiability of football teams are calculated.
First, we obtained the multi-scale pitch passing networks of all matches and teams. Second, the adjacency
matrix (see Fig. 1B) of each match and pitch partition is calculated. Third, we calculate the cross-correlation of
all matrices for all scales. Each scale corresponds to a different number of nodes m. The scale-consistency C(m)
(bottom left) is obtained when only the same team’s adjacency matrices are considered. Finally, we calculate the
scale-identifiability I(m) (bottom right) subtracting the correlation with other teams from the scale-consistency
C(m). The procedure is repeated for partitions of the pitch of different sizes, leading to a value of C(m) and I(m)
that depends on the number of nodes m.
more of the benefits of being the home team. Interestingly, Real Madrid and F.C. Barcelona are the teams with
the highest average consistency both at home and away. These two teams achieved the third and first positions,
respectively, and the highest values of consistency indicate that they are the teams whose passing networks have
a more regular structure. Using the k-means algorithm23 we categorized teams into three groups, which are
indicated by the shadowed regions in Fig. 3D. The three detected clusters correspond to high (1), intermediate
(2), and low consistency (3). Real Madrid and F.C. Barcelona belong to cluster 1, the one corresponding to the
highest consistency. Seven teams, including Athlético de Madrid (second at the end of the season), belong to
cluster 2. Finally, eleven teams are assigned to the cluster with the lowest consistency (3). Interestingly, the three
teams relegated to the second division (Girona, Huesca, and Rayo Vallecano) belong to this cluster.
Second, we calculated the identifiability of all teams as explained in the “Methods” section. Figure 4A,B show
the scale-identifiability I(m) of, again, F.C. Barcelona and Rayo Vallecano (see Supplementary Information for
the rest of the teams). In this case, we observe a different scaling behavior when the two teams are compared.
F.C. Barcelona reaches high values of identifiability (as we will see, it is the team with the highest average
identifiability), particularly around a pitch partition with m ∼ 50 nodes. Therefore, it is at this scale where F.C.
Barcelona passing networks are more distinguishable from the rest of the teams. Concerning Rayo Vallecano,
its identifiability rapidly decays to zero, indicating that the organization of its passing networks does not have
remarkable differences with the rest of the teams. Concerning the differences between playing at home or away,
we observe similarities and differences from the patterns reported for the average consistency (see Fig. 4C). As
in the previous case, the k-means the algorithm detects F.C. Barcelona and Real Madrid to be in the cluster of
teams with the highest identifiability. However, while Real Madrid was the team with the highest consistency, the
team with the highest identifiability is F.C. Barcelona. The second cluster, the one with moderate identifiability,
contains only three teams: Atlético de Madrid, Real Sociedad, and Eibar. Finally, the third cluster includes the
rest of the teams. The solid line in Fig. 4C corresponds to |I|home = |I|away , and we can observe how there are
teams at both sides of the line, a fact not reported when carrying a similar analysis about the team’s consistency.
Therefore, there is no evidence that playing at home increases the team’s identifiability. However, the two teams
with the highest identifiability have better values when playing at home.
Scientific Reports | (2020) 10:19735 | https://doi.org/10.1038/s41598-020-76835-3 5
Vol.:(0123456789)www.nature.com/scientificreports/
Figure 3. Scale-consistency C(m) of a football team, where m is the number of divisions of the pitch. Plots
(A) and (B) show the consistency of F.C. Barcelona and Rayo Vallecano, the first and the last teams of the
ranking at the end of the season, respectively. In both plots, the horizontal axis corresponds to the number of
nodes m (areas of the pitch) at which the consistency is calculated. As we can observe, consistency decreases
as the number of nodes increases. In plot (C), we plot the difference between the consistency of F.C. Barcelona
and Rayo Vallecano as a function of the number of nodes. Differences maximize around m ∼ 50. In (D), we
compared the average consistency when playing at home |C|home or away |C|away . The blue shadowed areas
represent the three clusters detected by the k-means algorithm. Teams are numbered according to their ranking
at the end of the season.
Finally, Fig. 4D shows the relation between consistency and identifiability. We plot the average consistency
|C| of each team vs. its average identifiability |I| and calculate the linear regression between both variables. The
high value of the correlation coefficient (r = 0.956) confirms that teams with a high consistency also have high
identifiability, despite some teams deviate from the general trend. This is the case, for example, of Getafe (ranked
#5), which has much higher identifiability than the one expected by its consistency.
Identifiability has practical implications that may be used by coaching teams to prepare and analyze matches.
For example, we can calculate our next rival’s identifiability, check if it is higher or lower when playing at home
or away, and prepare the match accordingly. An opposing team with high identifiability is prone to impose its
passing pattern, while a team with low identifiability will probably adapt to the opponent. Besides, we can obtain
a value of the identifiability of two teams for a particular match. For example, suppose F.C. Barcelona and Rayo
Vallecano have played between them. We can obtain the multi-scale passing networks of both teams for this
specific match. Next, we can compute how similar are the networks of this match to the rest of the matches played
by each team and obtain the match-identifiability parameter of both teams, ImatchFCB and I RV , respectively. Finally,
match
we can calculate the difference between the match-identifiability of both teams and obtain Idiff = Imatch
FCB − I RV .
match
Note that Idiff indicates which of the two teams played more similarly to its style (maintaining its passing pat-
terns) in that match. We computed Idiff for all matches of the season and summarized the results in Fig. 5. Rows
contain home teams, while columns correspond to away teams. Teams have been ordered, from top to bottom,
according to the final ranking at the end of the season, to show the connection between identifiability and the
performance of a team. Matches where the home teams imposed their passing patterns (i.e., home teams had
higher identifiability) are plot in yellow, while bluish cells correspond to away teams imposing their passing
patterns. In this way, we can observe how yellowish cells are mainly placed above the diagonal of the matrix,
indicating that when two teams played, the one ranked in a higher position had a higher probability of impos-
ing its playing style. If we pay attention to particular teams, we can observe that F.C. Barcelona was the team
that won the “identifiability contest” in more matches, both at home and away, just followed by Real Madrid.
However, it is worth mentioning that Idiff is not always an indicator of the result of a match since there are some
Scientific Reports | (2020) 10:19735 | https://doi.org/10.1038/s41598-020-76835-3 6
Vol:.(1234567890)www.nature.com/scientificreports/
Figure 4. Identifiability of LaLiga teams. In (A) and (B), we plot the scale-identifiability I(m) of F.C. Barcelona
(A) and Rayo Vallecano (B), the first and last teams of the ranking, respectively. In (C), we plot the average
home identifiability |I|home vs. the away identifiability |I|away . The solid line corresponds to |C|home = |C|away ,
indicating the frontier between having higher identifiability at home (below the line) or away (above the line).
The shadowed areas correspond to a cluster classification given by the k-means algorithm. In (D), we plot the
average consistency |C| vs. the average identifiability |I| of each team. In this case, the solid line is the linear
regression, which has a correlation coefficient of r = 0.956. Team numbers are the ranking at the end of the
season (see Fig. 3 or Table 1 for the teams’ names).
matches where the team that lost the match had higher identifiability. In other words, playing your way does not
guarantee the victory. With this regard, we analyzed the results of a match according to the match-identifiability
Idiff and we obtained that, for the season 2018/2019, the team with highest Idiff won in the 44% of the matches,
while the three points went to the team with the lowest Idiff in the 27% of the cases.
Discussion
We have introduced a new methodology to quantify the consistency and identifiability of football teams. Our
approach focuses on the organization of pitch passing networks, whose nodes are different areas of the pitch con-
nected through the completed passes between any two regions. Pitch passing networks contain information about
how teams move the ball along the match and what are the most connected areas of the pitch. Furthermore, they
contain spatial information that is lost when the nodes of the passing networks are the players t hemselves14,18.
It is worth mentioning that there is no unique pitch passing network for a given match, but a “family” of them.
The reason is that the pitch can be divided into partitions of different sizes, leading to different pitch passing
networks, with a different number of nodes and, consequently, with a different structure. Within this framework,
we defined the team’s consistency as the ability to maintain the structure of pitch passing networks from match
to match. Consistency was quantified by, first, obtaining the adjacency matrices associated with pitch passing
networks of a given team and, second, calculating the cross-correlation of these matrices. We repeated this
process with partitions of the pitch of different sizes, from m = 4 areas to m = 400. In this way, we obtained the
scale-consistency C(m) of football teams, indicating how similar pitch passing networks are at different scales.
The team consistency |C| obtained as the average of the scale-consistency allows to rank teams according to this
parameter and, furthermore, to distinguish between the behavior of the team in matches played at home or away.
The analysis of Spanish football teams paying at LaLiga during season 2018/2019 revealed that Real Madrid and
F.C. Barcelona were the most consistent teams, while Alavés and Getafe were the most inconsistent. It is worth
Scientific Reports | (2020) 10:19735 | https://doi.org/10.1038/s41598-020-76835-3 7
Vol.:(0123456789)www.nature.com/scientificreports/
Figure 5. Match-identifiability for the season 2018/2019 of LaLiga. Teams are ordered according to their
ranking at the end of the season. Rows correspond to home teams, while columns are the away teams. Each cell
contains the final score of the match.
mentioning that consistency (or identifiability) is not a proxy of team’s performance, but a quantifier of how a
team maintains a particular passing pattern. Therefore, the value reported for each team requires a particular
interpretation. On that sense, Getafe is a team with a playing style characterized by an intense pressure at higher
positions of the field, adapting to the specific formation of their rivals and, as a consequence, having a low con-
sistency (and identifiability). However, Getafe qualified fifth at the end of the season, a commendable position
according to its budget. Concerning the location of the match, all teams played more consistently at home than
away, except Rayo Vallecano, the team that finished the championship at the last position. These results indicate
that home teams are prone to maintain a playing pattern compared to away teams.
Beyond consistency, we investigated how the organization of pitch passing networks was related to each
particular team. Our main aim was not to categorize playing styles but to quantify how different are the passing
patterns of a given team from the rest of its rivals. With this target, we computed the identifiability of football
teams by, first, quantifying their consistency and, second, subtracting the similarity with the pitch passing net-
works of the rest of the teams. Teams with high identifiability fulfill two requirements: (1) they have consistent
passing networks during the season and (2) their passing networks are different from the rest of the teams.
Again F.C. Barcelona and Real Madrid were the two teams with the highest identifiability. However, the Catalan
team led the identifiability ranking, instead of Real Madrid, which had the highest consistency. Furthermore,
we found that specific teams had an optimal partition of the pitch (around m ∼ 50 nodes) at which the team’s
identifiability was higher. This optimal scale was reported at the identifiability of F.C. Barcelona, Real Madrid,
Atlético de Madrid and Real Betis, all of them having high values of the identifiability parameter. The fact that
an optimal scale exists has significant consequences on the definition of pith networks: Divisions of the pitch
leading to a too high or too low number of nodes may lose information about the passing patterns. Interestingly,
we did not find a standard behavior when comparing the identifiabilities of home/away teams, i.e., some teams
are more identifiable at home but others away. The comparison between consistency and identifiability showed
a positive correlation, despite some teams, such as Getafe, deviated from the general trend. The interpretation
of such deviations should be carried out by football professionals/experts with knowledge about each team’s
specificities and the circumstances surrounding their performance (e.g., a change of the coaching team or player
injuries). Finally, we showed how it is possible to obtain an identifiability value of a team for each match, which
can be used to assess which team imposed its passing pattern during the game. This information could also help
to prepare the next match according to the particular identifiability of the rival. The match-by-match analysis
showed that F.C. Barcelona was the team imposing their passing patterns more frequently both at home and
away, followed by Real Madrid. However, having higher identifiability than the rival at a given match was not
necessarily an indicator of a victory. Although teams placed at a more top position of the ranking generally had
Scientific Reports | (2020) 10:19735 | https://doi.org/10.1038/s41598-020-76835-3 8
Vol:.(1234567890)www.nature.com/scientificreports/
higher match identifiability than their rivals, we observed some matches where the final score did not correlate
with this difference.
It is worth also mentioning the limitations of our methodology. On the one hand, we only used the informa-
tion contained in the passes made by a team. This fact unavoidably limits the detection of the particular signature
of teams, since there are a diversity of other actions contributing to a team’s playing style. Indeed, there is space
for improving the identification of playing styles once the analysis goes beyond the limitations of classical team
formations, such as 4-4-2 or 4-3-3. Therefore, further improvements in our methodology should consider includ-
ing information about other actions such as shots, tackles, or dribbles. Another shortcoming of the consistency
and identifiability parameters is that we need a certain number of matches to quantify them. Therefore, although
we could obtain both parameters before the end of the season, they can not be calculated at the beginning of
the championship since we would not have enough matches to define each team’s average consistency and iden-
tifiability. Furthermore, there are unavoidable changes in the team structure that may affect the team’s passing
pattern. For example, a given team may change its coach in the middle of the season and have low identifiability
values due to a change in its playing style. With this regard, it is always necessary to know each team’s context to
interpret team consistency or identifiability adequately.
Finally, we believe that further studies could develop in more detail the information contained in both the
identifiability and consistency parameters. For example, it would be possible to evaluate what regions of the pitch
are contributing the most to these parameters. In this way, coaching teams could benefit from the detection of
the areas of the pitch where our team (or the rival) is playing as expected and others, where the behavior devi-
ates from the plan. On the other hand, it would be possible to obtain a real-time estimation of the identifiability
parameter during a match and analyze at what moments a team (or its opponent) is playing as expected, being
a valuable information for making decisions and/or find explanations in the subsequent analysis. Hopefully, in
the years to come, we will see more sophisticated definitions of playing styles, not only in football but in other
team sports where the way players interact crucially influences team performance.
Received: 4 August 2020; Accepted: 3 November 2020
References
1. Bialkowski, A. et al. Identifying team style in soccer using formations learned from spatiotemporal tracking data. In ICDM,
Workshop on Spatial and Spatio-temporal Data Mining (SSTDM). (2014).
2. Wang, Q., Zhu, H., Hu, W., Shen, Z. & Yao, Y. Discerning tactical patterns for professional soccer teams: an enhanced topic model
with applications. In Proceedings of the 21th ACM SIGKDD International Conference on Knowledge Discovery and Data Mining,
2197-2206 (2015).
3. Wu, Y. et al. Forvizor: Visualizing spatio-temporal team formations in soccer. IEEE Trans. Vis. Comp. Graphs. 25, 65–75 (2018).
4. Decroos, T., Van Haaren, J. & Davis, J. Automatic discovery of tactics in spatio-temporal soccer match data. In Proceedings of the
24th ACM SIGKDD International Conference on Knowledge Discovery & Data Mining, 223-232 (2018).
5. Gudmundsson, J. & Horton, M. Spatio-temporal analysis of team sports. ACM Comput. Surv. (CSUR), 1-34 (2017).
6. Rein, R. & Memmert, D. Big data and tactical analysis in elite soccer: Future challenges and opportunities for sports science.
SpringerPlus 5, 1–13 (2016).
7. Moura, F. A. et al. A spectral analysis of team dynamics and tactics in Brazilian football. J. Sports Sci. 31, 1568–1577 (2013).
8. Kempe, M., Vogelbein, M., Memmert, D. & Nopp, S. Possession vs. direct play: Evaluating tactical behavior in elite soccer. Int. J.
Sports Sci. 4, 35–41 (2014).
9. Fernandez-Navarro, J., Fradua, L., Zubillaga, A., Ford, P. R. & McRobert, A. P. Attacking and defensive styles of play in soccer:
Analysis of Spanish and English elite teams. J. Sports Sci. 34, 2195–2204 (2016).
10. https://www.mediacoach.es
11. Newman, M. E. J. Networks: An introduction (Oxford University Press, New York, 2018).
12. Passos, P. et al. Networks as a novel tool for studying team ball sports as complex social systems. J. Sci. Med. Sport 14, 170–176
(2011).
13. Ribeiro, J., Silva, P., Duarte, R., Davids, K. & Garganta, J. Team sports performance analysed through the lens of social network
theory: Implications for research and practice. Sports Med. 47, 1689–1696 (2017).
14. Buldú, J. M. et al. Using network science to analyse football passing networks: Dynamics, space, time, and the multilayer nature
of the game. Front. Psychol. 9, 1900 (2018).
15. Grund, T. U. Network structure and team performance: The case of English Premier League soccer teams. Soc. Netw. 34, 682–690
(2012).
16. Cintia, P., Rinzivillo, S., & Pappalardo, L. A network-based approach to evaluate the performance of football teams. In Machine
Learning and Data Mining for Sports Analytics Workshop, Porto, Portugal. (2015).
17. Buldú, J. M., Busquets, J. & Echegoyen, I. Defining a historic football team: Using Network Science to analyze Guardiola’s FC
Barcelona. Sci. Rep. 9, 1–14 (2019).
18. Herrera-Diestra, J. L. et al. Pitch networks reveal organizational and spatial patterns of Guardiola’s FC Barcelona. Chaos Solitons
Fractals 138, 109934 (2020).
19. Finn, E. S. et al. Functional connectome fingerprinting: Identifying individuals using patterns of brain connectivity. Nat. Neurosci.
18, 1664–1671 (2015).
20. Amico, E. & Goñi, J. The quest for identifiability in human functional connectomes. Sci. Rep. 8, 8254 (2018).
21. https://www.statsperform.com
22. Bonacich, P. Some unique properties of eigenvector centrality. Soc. Netw. 29, 555–564 (2007).
23. MacQueen, J. B. Some Methods for classification and Analysis of Multivariate Observations. In Proceedings of 5th Berkeley Sym-
posium on Mathematical Statistics and Probability, 281-297 (University of California Press, Berkeley, 1967).
Acknowledgements
Authors acknowledge Paco Seirul.lo (F.C. Barcelona), Matías Conde (Superliga & Analítica Sports) and Andy
Cooper (StatsPerform) for fruitful conversations. J.M.B. is funded by MINECO (Project: FIS2017-84151-P).
Scientific Reports | (2020) 10:19735 | https://doi.org/10.1038/s41598-020-76835-3 9
Vol.:(0123456789)www.nature.com/scientificreports/
Author contributions
J.M.B. conceived the idea behind the paper; All authors contributed to mature the idea; R.L.C., S.J.V. and R.R.
supplied the datasets; D.G. and D.R.A. implemented the calculations and numerical simulations; All authors
interpreted the results; J.M.B. wrote the first draft of the manuscript; All authors reviewed the manuscript and
contributed to the final version.
Competing interests
The authors declare no competing interests.
Additional information
Supplementary information is available for this paper at https://doi.org/10.1038/s41598-020-76835-3.
Correspondence and requests for materials should be addressed to J.M.B.
Reprints and permissions information is available at www.nature.com/reprints.
Publisher’s note Springer Nature remains neutral with regard to jurisdictional claims in published maps and
institutional affiliations.
Open Access This article is licensed under a Creative Commons Attribution 4.0 International
License, which permits use, sharing, adaptation, distribution and reproduction in any medium or
format, as long as you give appropriate credit to the original author(s) and the source, provide a link to the
Creative Commons licence, and indicate if changes were made. The images or other third party material in this
article are included in the article’s Creative Commons licence, unless indicated otherwise in a credit line to the
material. If material is not included in the article’s Creative Commons licence and your intended use is not
permitted by statutory regulation or exceeds the permitted use, you will need to obtain permission directly from
the copyright holder. To view a copy of this licence, visit http://creativecommons.org/licenses/by/4.0/.
© The Author(s) 2020
Scientific Reports | (2020) 10:19735 | https://doi.org/10.1038/s41598-020-76835-3 10
Vol:.(1234567890)You can also read