Comparison on Advance Regression Techniques on House Price Prediction - IJSPR
←
→
Page content transcription
If your browser does not render page correctly, please read the page content below

INTERNATIONAL JOURNAL OF SCIENTIFIC PROGRESS AND RESEARCH (IJSPR)                                                    ISSN: 2349-4689
Issue 173, Volume 73, Number 01, July 2020

   Comparison on Advance Regression Techniques
            on House Price Prediction
                          Puneet Tiwari1, Varun Singh Thakur2, Shiv Shankar Prasad Shukla3
                                                  1
                                                   M.Tech Scholar, 2,3Assistant Professor
                                            1,2
                                                  Rewa Institute of Technology, Rewa M.P.
                                                      3
                                                       ICFAI University, Jharkhand

Abstract - The broad and consistent real estate characteristics         bagging decision trees is the quantity of samples and
are frequently listed individually from the enquiring price and         hence the number of trees to consist of. This can be
the overall description. Thus with these characteristics or the         selected by growing the number of trees on run after run in
features are individually listed in a prepared organized way,
                                                                        anticipation of the accuracy begins to stop viewing
such that they can be effortlessly compared across the entire
                                                                        enhancement [15]. Random forest is a supervised learning
range of prospective houses. Though, every house has its own
distinctive features, such as a particular view, balcony 1 or 2,
                                                                        algorithm that is used for in cooperation with
parking area, Kids Park or type of sink the sellers can provide a       categorization as well as regression. But though, it is
précis of all the important description of the house. Thus the          predominantly used for classification problems [17]. As it
given real estate features can be measured by the probable              would known that a forest is prepared up of trees and more
buyers, but it seems to be nearly impossible to make available          trees means more robust forest. Likewise, random forest
an automated evaluation on all features or variables due to the         algorithm produce decision trees on data samples and then
huge variety. This is as well true in the erstwhile direction:          obtains the prediction from every of them and at last
house sellers have to formulate an estimation of the worth
                                                                        choose the most excellent solution through means of
based on its characteristics or features in similarity to the
                                                                        voting [18]. It is an ensemble technique which is enhanced
existing market price of related houses Using the Machine
Learning or the hypothesis function an automated system is to
                                                                        than a single decision tree since it diminishes the over-
be creating to predict the house price..                                fitting by averaging the result[19].

Keywords: model, machine learning, linear regression, random                         II. LITERATURE SURVEY
forest , supervised learning.
                                                                        diminish ratio, indicative of a trend line of data. In
                   I. INTRODUCTION                                      erstwhile words, the value of the dependant variable is
                                                                        altered to a constant sample, and the relationship amid
Machine learning is an relevance of artificial intelligence
                                                                        these variables is referred to as linear regression in the
(AI) that endow with systems the capability to repeatedly
                                                                        linear function of the primary function, and the statistical
learn and improve from experience without being overtly
                                                                        modelling means is the for the most part normally used
programmed[1][2]. Machine learning do centre of
                                                                        method[5] . Multiple linear regression analysis take for
attention on the growth of computer programs that can
                                                                        granted a linear relationship between several independent
access data and use it be trained for themselves.
                                                                        variables (X1, X2, ..., Xn) and dependent variables (Y),
Networking Sites using which helps the people to connect
                                                                        which compute the things of each independent variable (β)
with the existing friends, relatives, group of employees
                                                                        using the subsequent expressions [22]. Y= β₀ + β₁x₁ +
etc. The process of learning start with interpretation or
                                                                        β₂x₂…βn xn + ε in multiple linear regression analysis, a lot
data, such as examples, straight experience, or instruction,
                                                                        of input variables are inclined to noise data or contain
so as to look for sample in data and make enhanced
                                                                        preventable information, thereby sinking the predictive
judgment in the future pedestal on the instance that it
                                                                        power of regression analysis . In this paper, They evaluate
provide[3]. The primary aspire is to permit the computers
                                                                        and analyze the presentation of the wave information
learn robotically without human interference or support
                                                                        prediction algorithm in instruct to get better the stability of
and fiddle with actions accordingly[4]. Whilst bagging
                                                                        the direction-finding and the efficiency all the way
with decision trees, it may less fretful about individual
                                                                        through the maritime traffic control due to normal
trees over fitting the training data. For this reason and for
                                                                        occurrence of marine accidents. In addition, with initiate
effectiveness, the human being decision trees are full-
                                                                        the linear regression model, Algorithm[20]. First, this
grown deep and the trees are not pruned. These trees will
                                                                        paper is a procedure of finding waves. It is linked to this
have together high variance and low bias. These are
                                                                        paper in that it predicts the predicted dangerous waves by
significant illustrate of sub-models when mingling
                                                                        be relevant linear regression algorithms shows the result
predictions using bagging [16]. The only factors when
 www.ijspr.com                                                                                                              IJSPR | 66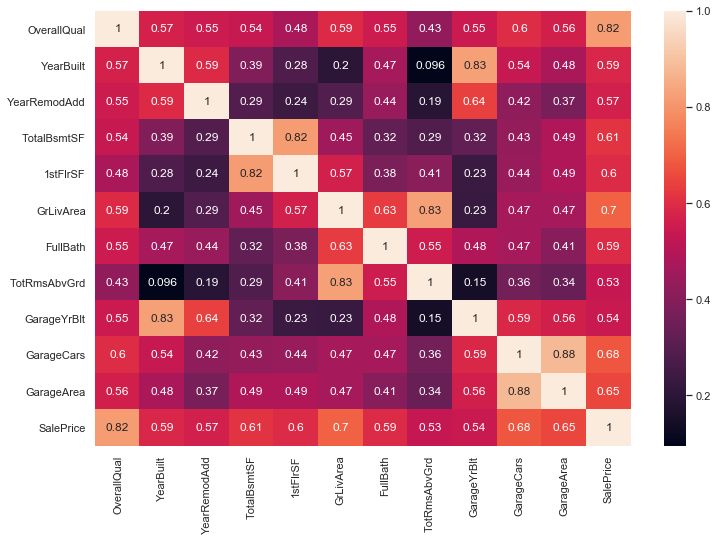
INTERNATIONAL JOURNAL OF SCIENTIFIC PROGRESS AND RESEARCH (IJSPR)                                         ISSN: 2349-4689
Issue 173, Volume 73, Number 01, July 2020

of the linear regression[6][7]]. In most recent two decades     ratings. Real Estate Data was obtained from Metropolitan
forecasting the property worth has turn out to be an            Regional Information Systems (MRIS) database. The
important field. Rise in insist intended for property and       author extracted approximately 15,000 records from these
unpredictable behaviour of financial system induce              three sources which included 76 variables. Subsequently,
researchers to come across out a method that forecast the       t-test was used to select 49 variables as a preliminary
real estate prices devoid of any biases. Therefore, it is a     screening. Their research question was to determine
challenge meant for researchers to discover out all the         whether the closing price was higher or lower than the
miniature features that can have an effect on the outlay of     listing price. Thus to speak to this categorization problem,
property and create a predictive model by taking into           the author used four machine learning models. C4.5,
deliberation all the features. Constructing a predictive        RIPPER, Naive Bayesian, and AdaBoost are the four
model for real estate price evaluation necessitate              algorithms used by writer. However, they originate that
methodical information on the subject. A lot of researchers     RIPPER outperforms previous house prediction model.
have effort on this problem and converse their research         However the problem is that presentation evaluation is
work. For the most division of this research work is            pedestal only on classifiers. Performance comparison of
enthused from this [31]. The author has worn out the            other machine learning algorithms should also be
housing data set since Centris.ca and duProprio.com.            measured. In article, the authors have forecast the stock
Their dataset consists of just about 25,000 examples and        market prices using linear regression methods [12].
130 factors. Approximately 70 features were worn out
                                                                            III. PROBLEM DEFINITION
from the above websites and real estate agencies such as,
RE/MAX, Century 21, and Sutton, etc. Erstwhile 60               The broad and consistent real estate characteristics are
features were socio-demographic based on everywhere the         frequently listed individually from the enquiring price and
property is positioned [32]. Later, author put into practice    the overall description. Thus with these characteristics or
Principal Component Analysis to decrease the                    the features are individually listed in a prepared organized
dimensionality. The author used four regression                 way, such that they can be effortlessly compared across
techniques to forecast the price worth of the property. The     the entire range of prospective houses. Though, every
four methods are Linear Regression, Support Vector              house has its own distinctive features, such as a particular
Machine, KNearest Neighbors (KNN) and Random Forest             view, balcony 1 or 2, parking area, Kids Park or type of
Regression and an ensemble move towards by combining            sink the sellers can provide a précis of all the important
KNN and Random Forest Technique. The ensemble                   description of the house[13]. Thus the given real estate
moves towards forecast the prices with least error of           features can be measured by the probable buyers, but it
0.0985 [9]. Though, applying PCA did not perk up the            seems to be nearly impossible to make available an
prediction error. A group of researchers have been              automated evaluation on all features or variables due to
complete on Artificial Neural Networks. This has helped         the huge variety. This is as well true in the erstwhile
many researchers focusing on real estate problem to             direction: house sellers have to formulate an estimation of
resolve using neural networks. In [7], the author has           the worth based on its characteristics or features in
compared hedonic price model and ANN model that                 similarity to the existing market price of related houses.
forecast the house prices. Hedonic price models are             The assortment of the characteristics or the huge number
essentially used to calculate the price of any commodity        of features makes the challenging task to calculate
that is dependent relative on internal description as well as   approximately a satisfactory market price. Apart, a
external descriptions [10]. The hedonic model                   description of the significant features of the house, the
fundamentally involves regression technique that believes       house depiction is also a means of raising interest in the
various parameters such as property area, age, bedrooms         reader, or in other words to convince the person. It is
number and so on. The Neural Network is trained to begin        probable that there are definite word sequences in the
with and the weights and biases of the edges and nodes in       language text that seduce probable buyers more than
that order are measured using trial and error method.           others. Therefore, there may be a relation between the
Training the Neural Network model is a black box                language or verbal communication sentence used in the
technique. However, the RSquared value for Neural               explanation or summary and the value of the property.
Network model was greater compared to hedonic model             This evaluation does not spotlight principally on the house
and the RMSE value of Neural Network model was                  characteristics, but on all words within the feature
reasonably lower[11]. Hence it is finished that Artificial      summary. For example, a summary with the word
Neural Network performs superior than Hedonic model. A          extremely can break one with the word very looking at
number of researchers like that in have used classifiers to     price fluctuation: the difference between real estate house
forecast the property values. The author in research article    price asking- and selling price. This can mean that the
has collected the data from Multiple Listing Service            word or the feature variable highly is commonly seen in
(MLS), historical mortgages rates and public school             summary of the detail database that show an boost in real
 www.ijspr.com                                                                                                    IJSPR | 67
INTERNATIONAL JOURNAL OF SCIENTIFIC PROGRESS AND RESEARCH (IJSPR) ISSN: 2349-4689
Issue 173, Volume 73, Number 01, July 2020
estate house price prediction while the features having pd.read_csv(file path). Thus file will automatically get
low characteristics very generally leads to a decrease in uploaded in the environment.
price.
IV. EXPERIMENTAL RESULT
Before going in the methodology understanding of the
problem is much important. The problem is creating the
hypothesis function that may give the prediction of the
target value based on the data given as the training part.
Then see or analyze the prediction on the testing part of
the data. Here the data given is on the house price and its Figure1: data sets
respective features which accommodate the price of the
After analyzing the data information it get to be known
house. Thus to build the machine to learn the data features
that there are several missing values in the data which will
and predict the price accurate is the challenging task. This
act as the noisy data in the data set , so there are several
will also help the society of the real estate builder to easily
ways to check the missing data and there are also several
predict the price of the land, house etc according to their
ways to fill data or drop the column if it is not required
feature with the help of this model. The data set for this
and have many missing values. Isnull().any() function
thesis is taken from Kaggle’s Housing Data Set
will easily display the attributes that having any missing
Knowledge Competition. Data set is simple and this thesis
values, which is also get visualize by the plotting the isnull
aims at the prediction of the house price (residential) in
function through heat map . It will give the visualization
Ames Lowa, USA. Thus the data has been downloaded
where are the values missing in several aatributes.
from the Kaggle Housing Datasets. The detail of the
dataset is as follows it contain 81 explanatory variables or
the features or characteristics variable. The last variable is
considered as the target value; here it is named as Sale
Price, which is the actual price of the house. The when
machine will predict the price it will get matched with the
actual value and the mean error will get calculated which
will give the accuracy rate of the model. The data set may
contain the various detail features of the houses. With
explanatory variables describing (almost) every aspect of
residential homes in Ames, Iowa, this challenges the
researcher to predict the final price of each homeNow
import the data set by the help of the pandas in python
platform and analyze the data set. Check all the features of
the house related to the dependent target. Analyze and
Figure 2: Missing values in data set
visualize the data by checking the missing values, fill all
the missing values by taking median of all the values of The white portion in the figure 5.6 shows the missing
that attribute. Change the data which are in categorical value in the respective attributes while the black portion is
form, place the one hot encoder, or the label encoder the value in the attributes. Here PoolQc ,Misc Feature,
coding for changing the categorical data into the Alley have the most of the value as missing. Fireplaces ,
numerical data. Change the entire alphabet values of the Mszoning, garagetype etc also have some value missing.
attribute into the numerical values. Find the appropriate These all value should be filled with some respective
features by the help of heat map and the correlation matrix number by calculating the median average of the
generated by the help of Seaborn in python. Select the remaining values of the attribute. Now as data is ready for
most nearly features to which the label target is truly the pre processing it is important to select the features
dependent. Before applying the machine learning which are correlated with the target value. The correlation
regression function to the data, split the data into two parts here means that the target value is dependent on those
one is training data and another is the testing data .Apply features i.e. if the value of that particular features is get
the machine learning on the training part of the data by the increased than the value of the target value is also get
help of the sklearn library on python platform. For loading increased and vice versa. For finding the correlation of the
the data set there is a library function in the python known features there are several ways but the most popular way
as pandas and the code is written as follows. First import is the heatmap correlation graph.
the library import pandas as pd. Then write the command
www.ijspr.com IJSPR | 68INTERNATIONAL JOURNAL OF SCIENTIFIC PROGRESS AND RESEARCH (IJSPR) ISSN: 2349-4689
Issue 173, Volume 73, Number 01, July 2020
housing features. Overall, the results endow with practical
information regarding the cause of various features on
house prices and their corresponding analysis.
REFERENCES
[1] Rochard J. Cebula. “The Hedonic Pricing Model Applied to
the Housing Market of the City of Savannah and Its
Savannah Historic Landmark District”. In: The Review of
Regional Studies 39.1, 2009, pp. 9–22.
[2] Gang-Zhi Fan, Seow Eng Ong, and Hian Chye Koh.
“Determinants of House Price: A Decision Tree Approach”.
In: Urban Studies 43.12, 2006, pp. 2301–2315
Figure 3: Correlation Matrix [3] Gu Jirong, Zhu Mingcang, and Jiang Liuguangyan.
Table 1. Comparison between regression techniques “Housing price based on ge-netic algorithm and support
vector machine”. In: Expert Systems with Applications 38,
Regression technique Accuracy rate 2011, pp. 3383–3386..
Linear regression 89.26% [4] Hasan Selim. “Determinants of house prices in Turkey:
Hedonic regression versusartificial neural network”. In:
Random Forest 89.39%
Expert Systems with Applications 36, 2009, pp. 2843–2852.
Gradient Boosting 91.77%. [5] G. Stacy Sirmans, David A. Macpherson, and Emily N.
Zietz. “The Composition of Hedonic Pricing Models”. In:
Journal of Real Estate Literature 13.1,2005, pp. 3–43.
linear regression is applied to the training data and then
tests the result accuracy on testing data. The linear [6] Alex J Smola and Bernhard Scholkopf¨. “A tutorial on
support vector regression”. In: Statistics and computing
regression techniques give accuracy of 89.2%. The
14.3, 2004, pp. 199–205.
random forest regression technique is applied on the same
training and testing data and gets the result of approximate [7] R. J. Shiller, “Understanding recent trends in house prices
89.39% which is little much better than the linear and home ownership,” National Bureau of Economic
regression. . When the gradient boosting is applied on the Research, Working Paper 13553, Oct. 2007.
data sets, it gives the accuracy of approximate 91.77%. [8] Pow, Nissan, Emil Janulewicz, and L. Liu. "Applied
Thus the gradient boosting regression technique shows the Machine Learning Project 4 Prediction of real estate
best result in comparison of all the three regression property prices in Montréal.", 2014.
techniques. It clearly get compared that the random forest [9] Park, Byeonghwa, and Jae Kwon Bae. "Using machine
gives the better result that the linear regression and the learning algorithms for housing price prediction: The case
gradient boosting is giving the best result in this house of Fairfax County, Virginia housing data."Expert Systems
price dataset. The gradient boosting is giving the far with Applications 42.6, 2015, pp 2928-2934..
better result than both of them and become the better [10] Bhuriya, Dinesh, et al. "Stock market predication using a
advance regression technique for this dataset. linear regression." Electronics, Communication and
Aerospace Technology (ICECA), 2017 International
V. CONCLUSION
conference of.Vol. 2.IEEE, 2017.
With the use of a range of analytical and graphical tools, it
[11] Li, Li, and Kai-Hsuan Chu. "Prediction of real estate price
was able to estimate the predictive performance of a variation based on economic parameters." Applied System
variety of housing price models. In totting up, the models Innovation (ICASI), 2017 International Conference
also helped categorize which characteristics of housing on.IEEE, 2017.
were most robustly coupled with price and could elucidate
[12] Wu, Jiao Yang. "Housing Price prediction Using Support
most of the price variation. Moreover, it was able to get Vector Regression”, 2017.
better models’ prediction accuracy by accounting for the
impact of different regression technique. The methods [13] Changchun Wang and HuiWu. “A new machine learning
approach to house estimation”, NTMSCI 6, No.4, 2018, pp
used in this study consisted of simple and multiple linear
165-171.
regression, random forests, and gradient boosting for
predictors. The models were evaluated and measured [14] Cherny L (1995), The MUD register: Conversational modes
using median absolute error and median percent error as of action in a text-based virtual reality. Linguistics
Department. Palo Alto, CA: Stanford University.
performance metric criterion. Another main goal of this
thesis was to inspect the significance of each predictor in [15] Neelam Shinde, Kiran Gawande. “Valuation of house prices
illumination of price variation for a specified set of using predictive techniques”, International Journal of
www.ijspr.com IJSPR | 69INTERNATIONAL JOURNAL OF SCIENTIFIC PROGRESS AND RESEARCH (IJSPR) ISSN: 2349-4689
Issue 173, Volume 73, Number 01, July 2020
Advances in Electronics and Computer Science, ISSN:
2393-2835, Volume-5, Issue-6, Jun.-2018, pp 34-40.
[16] Lim, Wan Teng, et al. "Housing price prediction using
neural networks." Natural Computation, Fuzzy Systems and
Knowledge Discovery (ICNC-FSKD), 2016 12th
International Conference on.IEEE, 2016.
[17] S. C. Bourassa, E. Cantoni, and M. Hoesli, “Predicting
house prices with spatial dependence: a comparison of
alternative methods,” Journal of Real Estate Research, vol.
32, no. 2, 2010, pp.139–160.
[18] Kelvin J. Lancaster. “A New Approach to Consumer
Theory”. In: The Journal of Political Economy 74.2, 1966,
pp. 132–157.
[19] Sherwin Rosen. “Hedonic Prices and Implicit Markets:
Product Differentiation in Pure Competition”. In: The
Journal of Political Economy 82.1, 1974, pp. 34–55.
[20] Gang-Zhi Fan, Seow Eng Ong, and Hian Chye Koh.
“Determinants of House Price: A Decision Tree Approach”.
In: Urban Studies 43.12, 2006, pp. 2301–2315.
www.ijspr.com IJSPR | 70You can also read