Comparison of Volume-Guaranteed or -Targeted, Pressure-Controlled Ventilation with Volume-Controlled Ventilation during Elective Surgery: A ...

Page created by Peggy Vazquez
 
CONTINUE READING
Comparison of Volume-Guaranteed or -Targeted, Pressure-Controlled Ventilation with Volume-Controlled Ventilation during Elective Surgery: A ...
Journal of
              Clinical Medicine

Review
Comparison of Volume-Guaranteed or -Targeted,
Pressure-Controlled Ventilation with Volume-Controlled
Ventilation during Elective Surgery: A Systematic Review
and Meta-Analysis
Volker Schick † , Fabian Dusse † , Ronny Eckardt, Steffen Kerkhoff, Simone Commotio, Jochen Hinkelbein
and Alexander Mathes *

                                          Department of Anesthesiology and Intensive Care Medicine, University Hospital and Medical Faculty,
                                          Cologne University, Kerpener Str. 62, 50937 Cologne, Germany; volker.schick@uk-koeln.de (V.S.);
                                          fabian.dusse@uk-koeln.de (F.D.); ronny.eckardt@uk-koeln.de (R.E.); steffen.kerkhoff@uk-koeln.de (S.K.);
                                          simone.commotio@uk-koeln.de (S.C.); jochen.hinkelbein@uk-koeln.de (J.H.)
                                          * Correspondence: alexander.mathes@uk-koeln.de
                                          † Both authors contributed equally to the manuscript.

                                          Abstract: For perioperative mechanical ventilation under general anesthesia, modern respirators aim
                                          at combining the benefits of pressure-controlled ventilation (PCV) and volume-controlled ventilation
                                          (VCV) in modes typically named “volume-guaranteed” or “volume-targeted” pressure-controlled
                                          ventilation (PCV-VG). This systematic review and meta-analysis tested the hypothesis that PCV-VG
                                          modes of ventilation could be beneficial in terms of improved airway pressures (Ppeak , Pplateau ,
                                Pmean ), dynamic compliance (Cdyn ), or arterial blood gases (Pa O2 , Pa CO2 ) in adults undergoing
         
                                          elective surgery under general anesthesia. Three major medical electronic databases were searched
Citation: Schick, V.; Dusse, F.;
                                          with predefined search strategies and publications were systematically evaluated according to the
Eckardt, R.; Kerkhoff, S.; Commotio,
                                          Cochrane Review Methods. Continuous variables were tested for mean differences using the inverse
S.; Hinkelbein, J.; Mathes, A.
                                          variance method and 95% confidence intervals (CI) were calculated. Based on the assumption that
Comparison of Volume-Guaranteed
                                          intervention effects across studies were not identical, a random effects model was chosen. Assessment
or -Targeted, Pressure-Controlled
Ventilation with Volume-Controlled
                                          for heterogeneity was performed with the χ2 test and the I2 statistic. As primary endpoints, Ppeak ,
Ventilation during Elective Surgery:      Pplateau , Pmean , Cdyn , Pa O2 , and Pa CO2 were evaluated. Of the 725 publications identified, 17 finally
A Systematic Review and Meta-             met eligibility criteria, with a total of 929 patients recruited. Under supine two-lung ventilation,
Analysis. J. Clin. Med. 2021, 10, 1276.   PCV-VG resulted in significantly reduced Ppeak (15 studies) and Pplateau (9 studies) as well as higher
https://doi.org/10.3390/jcm10061276       Cdyn (9 studies), compared with VCV [random effects models; Ppeak : CI −3.26 to −1.47; p < 0.001;
                                          I2 = 82%; Pplateau : −3.12 to −0.12; p = 0.03; I2 = 90%; Cdyn : CI 3.42 to 8.65; p < 0.001; I2 = 90%]. For
Received: 3 March 2021                    one-lung ventilation (8 studies), PCV-VG allowed for significantly lower Ppeak and higher Pa O2
Accepted: 15 March 2021                   compared with VCV. In Trendelenburg position (5 studies), this effect was significant for Ppeak only.
Published: 19 March 2021
                                          This systematic review and meta-analysis demonstrates that volume-targeting, pressure-controlled
                                          ventilation modes may provide benefits with respect to the improved airway dynamics in two-
Publisher’s Note: MDPI stays neutral
                                          and one-lung ventilation, and improved oxygenation in one-lung ventilation in adults undergoing
with regard to jurisdictional claims in
                                          elective surgery.
published maps and institutional affil-
iations.
                                          Keywords: volume controlled ventilation; pressure controlled ventilation; volume guarantee; volume
                                          target; auto-flow; PCV-VG; perioperative; surgery; anesthesia

Copyright: © 2021 by the authors.
Licensee MDPI, Basel, Switzerland.
                                          1. Introduction
This article is an open access article
distributed under the terms and                 Mechanical ventilation is a common perioperative requirement, and modern respira-
conditions of the Creative Commons        tors enable mechanical ventilation in a variety of modes [1]. New ventilation strategies aim
Attribution (CC BY) license (https://     at combining the advantages of two modes of ventilation, pressure-controlled ventilation
creativecommons.org/licenses/by/          (PCV) and volume-controlled ventilation (VCV). While pressure-controlled ventilation
4.0/).                                    modes allow a decelerating flow, this technique may result in a relevant variation of the

J. Clin. Med. 2021, 10, 1276. https://doi.org/10.3390/jcm10061276                                                 https://www.mdpi.com/journal/jcm
Comparison of Volume-Guaranteed or -Targeted, Pressure-Controlled Ventilation with Volume-Controlled Ventilation during Elective Surgery: A ...
J. Clin. Med. 2021, 10, 1276                                                                                               2 of 16

                               achieved tidal volume. VCV, on the other hand, more or less guarantees a set volume of
                               ventilation, but uses a fixed flow, and this can result in variations of the achieved peak
                               and/or plateau airway pressure. To combine both, modern ventilation modes aim at
                               using a pressure-controlled way of applying flow and ventilation, with digital feedback
                               mechanisms continuously controlling the applied tidal volume, targeting for a fixed tidal
                               volume. The compliance of the lung is calculated by the ventilator to deliver the target tidal
                               volume using the lowest possible pressure. These ventilation modes are called “volume
                               guaranteed” (PCV-VG) or “volume targeted” pressure-controlled ventilation. Depending
                               on the manufacturer, the names “dual control mode”, “auto-flow”, “Pressure Regulated
                               Volume Controlled (PRVC) ventilation” or unique variations are also in use.
                                    For the most common form of perioperative ventilation, i.e., continuous mandatory
                               ventilation (CMV), there has been an ongoing debate whether PCV or VCV may offer ad-
                               vantages or disadvantages for the general patient or in certain subpopulations, for specific
                               perioperative procedures (e.g., one-lung ventilation) or patient positioning (e.g., prone
                               position, Trendelenburg position) [2,3]. Up to date, there is no consensus on whether PCV
                               or VCV may significantly improve the patient outcome in the perioperative setting [4,5].
                                    For laparoscopy and the Trendelenburg position, research showed potential advan-
                               tages for PCV-VG in the perioperative setting, e.g., in terms of improved oxygenation and
                               reduced airway pressures [6]. However, other publications did not show an improved oxy-
                               genation for this new ventilation mode [7], and Sahutoglu even described a non-significant
                               trend toward the more post-operative complications after the use of PCV-VG [8]. Other
                               comparisons of PCV-VG in the perioperative setting, e.g., with PCV itself, are sparse and
                               limited to three studies up to date. To shed more light on this new form of periopera-
                               tive ventilation, we therefore hypothesized that pressure-controlled, volume-guaranteed
                               ventilation modes (PCV-VG) may have advantages over conventional, volume-controlled
                               ventilation (VCV) during surgery with respect to airway pressures and blood gas analysis.
                               Therefore, we conducted a systematic review and meta-analysis, comparing ventilation
                               with PCV-VG and VCV in adults undergoing elective surgery.

                               2. Materials and Methods
                                    A systematic review and meta-analysis were performed according to the PRISMA
                               guidelines [9] and the Cochrane Handbook for Systematic Reviews of Interventions [10]. This
                               systematic review was not registered in international databases prior to the investigation.

                               2.1. Search Strategy, Elegibility Criteria, and Study Selection
                                    NCBI/PubMed (including MEDLINE), Cochrane and EMBASE were searched for
                               eligible studies using the general search strategy given in Table 1. Each strategy was
                               modified for the technical interface of the database and included all relevant fields (e.g., title,
                               abstract and keywords) as well as all word variations (e.g., with and without hyphens)
                               according to the instructions for the algorithm of the database. All searches were performed
                               in an open, non-truncated fashion and included automatic term mapping functions as
                               well as thesaurus functions, according to each database. In addition, manual searches
                               included secondary references and citations of the relevant literature to find potentially
                               unlisted publications.
                                    In- and exclusion criteria were based on the PICOS model [9,10] and defined as follows.
                               Inclusion Criteria: Participants = adult patients ≥ 18 years; Interventions = elective surgery;
                               Comparisons = pressure-controlled ventilation with a volume-guaranteed or volume tar-
                               geted mode (PCV-VG) versus volume-controlled ventilation (VCV); Outcomes = blood
                               gas analysis, respirator mechanics and airway pressures as primary endpoints, hemody-
                               namic variables and adverse events as secondary endpoints; Study design = randomized
                               controlled trials. Exclusion Criteria: Participants = patients < 18 years, children, neonates;
                               Interventions = non-elective surgery, e.g., emergency surgery, critical care ventilation; Com-
                               parisons = missing comparison or other modes of ventilation; Outcomes = case reports
                               or interventions not reporting outcomes, or outcomes not appropriate for meta-analysis;
J. Clin. Med. 2021, 10, 1276                                                                                                          3 of 16

                               Study design = not randomized trials, not full studies, e.g., case reports or abstracts. Po-
                               tential subgroups were defined ex ante as positioning (supine, prone, Trendelenburg) and
                               one-lung ventilation based on a primary survey of the literature.

                               Table 1. Search strategies.

                                   String     Condition                                           Search 1
                                     #1           -                [‘ventilation’ OR ‘ventilator’ OR ‘respiration’ OR ‘respirator’]
                                                                [‘volume guarant*’ OR ‘volume-guarant*’ OR ‘volume target*’ OR
                                     #2        AND
                                                                                           ‘volume-target*’]
                                     #3         OR                 [‘autoflow’ OR ‘dual control mode’ OR ‘PCV-VG’ OR ‘PRVC’]
                                     #4        AND                     [‘perioperative’ OR ‘operating room’ OR ‘anesthesia’]
                                     #5        NOT                        [‘infant*’ OR ‘newborn’ OR ‘pediat*’ OR ‘child*’]
                                     #6        NOT                                      [‘review’ OR ‘animal’]
                                     #7          -                           [#1 AND [#2 OR #3] AND #4] NOT #5 NOT 6
                               1   All word variations (*) and field searches according to the technical interface of the database.

                                    Three reviewers (V.S., R.E., and S.C.) independently evaluated all search results using
                               the program AbstrackR® (Center for Evidence Synthesis in Health; Brown University;
                               Providence, RI; USA) in a blinded fashion based on the abovementioned criteria. An
                               additional, independent referee (J.H.) dissolved discrepancies regarding the question
                               whether a study should be included.

                               2.2. Data Extraction
                                    Two reviewers (F.D. and A.M.) independently extracted the data from the included
                               studies; again, an additional, independent referee (J.H.) dissolved discrepancies regarding
                               the question whether or how a set of data should be included and confirmed data extraction.
                               Data extraction was based on the predefined outcome criteria. The following variables
                               were collected: number of patients (n); mode of ventilation; tidal volume; reference for tidal
                               volume; airway pressures Ppeak , Pplateau , Pmean , dynamic compliance Cdyn , positive end
                               expiratory pressure (PEEP); blood gas analysis: pH, pa O2 , pa CO2 ; hemodynamic variables:
                               heart rate, mean arterial blood pressure (MAP), central venous pressure (CVP); patient
                               positioning; type of surgery; reporting of adverse events.

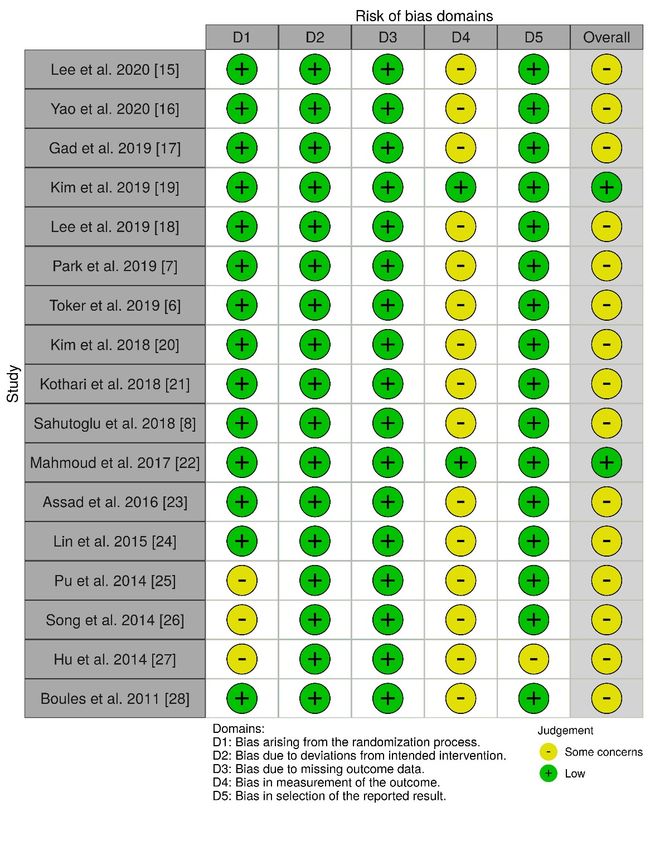
                               2.3. Study Quality and Risk of Bias
                                   Two reviewers (F.D. and A.M.) independently evaluated the risk of bias for each
                               publication using the Cochrane Risk of Bias tool version 2 (RoB-2; Centre for Research
                               Synthesis and Decision Analysis; University of Bristol; Bristol; UK) [11]; results were
                               graphically plotted using the Risk of Bias visualization software Robvis (Bristol Appraisal
                               and Review of Research Group; University of Bristol; Bristol; UK) [12]. Again, an additional,
                               independent referee (J.H.) dissolved discrepancies regarding this evaluation.

                               2.4. Statistical Analysis
                                     The parameters outlined above were obtained from the included studies at the given
                               time points. For publications stating interquartile ranges and medians (n = 3), standard
                               deviations were estimated using the formula described in Section 6.5.2.5. of the Cochrane
                               Handbook for interquartile ranges [10]. For publications stating median, minimum, and
                               maximum values (n = 1), means and standard deviations were estimated using the method
                               described by Hozo [13].
                                     All statistical analyses were performed with RevMan version 5.4 (The Cochrane
                               Collaboration; London, UK). Continuous variables were tested for mean differences using
                               the inverse variance method and 95% confidence intervals (CI) were calculated. Based
                               on the assumption that intervention effects across studies were not identical, a random
                               effects model was chosen [14]. Assessment for heterogeneity was performed with the χ2
                               test and the I2 statistic. An I2 > 50% and a χ2 test with p < 0.10 were considered to indicate
                               statistical heterogeneity; in absence of asymmetry, the random effects model was applied.
J. Clin. Med. 2021, 10, 1276                                                                                                4 of 16

                                In publications with a cross-over design, only a single set of data prior to cross-over was
                                used, and all further cross-over data were excluded from this meta-analysis, to eliminate
                                the risk of bias by carry-over effects.

                                3. Results
                                3.1. Study Selection
                                         Initially, 724 publications in NCBI/PubMed, Embase, and Cochrane were identified.
                                    Additional records and manual search resulted in one study, for a total of 725 publications.
                                    After duplicates were removed, title and abstract of 372 publications were screened for
                                    selection according to the PICOS criteria specified above. Of those, 351 had to be excluded,
                                    resulting in 21 publications that were full-text assessed for eligibility. Four publications
                                    had to be excluded, finally resulting in 17 studies that underwent the following qualitative
J. Clin. Med. 2021, 10, x FOR PEER REVIEW                                                                                   5 of 17
                                    evaluation [6–8,15–28]. A flow chart of the search strategy and study selection are shown
                                    in Figure 1.

                                Figure 1. Flow
                                Figure 1. Flow chart
                                               chart of
                                                     of study
                                                        study selection.
                                                              selection.

                                3.2. Study Characteristics
                                      Within 17 publications included for this meta-analysis, a total of 929 patients were
                                enrolled (average: 55 patients per investigation; range: 20–100 patients). Almost 60% of all
                                investigations (n = 10) were published within the last three years (2018–2020), and 94% of
                                all studies (n = 16) were published within the last 7 years (2014–2020); no study was older
                                than 10 years. Over 60% of the studies were performed in Asian countries (n = 11). There
                                was no investigation from North or South America, Australia, Great Britain, or an EU
                                country. For study characteristics, please see Table 2.
J. Clin. Med. 2021, 10, 1276                                                                                                                5 of 16

                                       3.2. Study Characteristics
                                             Within 17 publications included for this meta-analysis, a total of 929 patients were
                                       enrolled (average: 55 patients per investigation; range: 20–100 patients). Almost 60% of
                                       all investigations (n = 10) were published within the last three years (2018–2020), and 94%
                                       of all studies (n = 16) were published within the last 7 years (2014–2020); no study was
                                       older than 10 years. Over 60% of the studies were performed in Asian countries (n = 11).
                                       There was no investigation from North or South America, Australia, Great Britain, or an
                                       EU country. For study characteristics, please see Table 2.

                                                        Table 2. Study characteristics.

      Publication              Year   Origin       Surgery          Anesthesia Airway     Position      Tidal Volume        PEEP    I:E       n
    Lee et al. [15]            2020   Korea    Robotic/LSC/OBS      balanced   ITN         45◦ TDB       8 mL/kg IBW        N/A     1:2      40
    Yao et al. [16]            2020   China     TSC/Lobectomy       balanced   DLT           N/A          6–10 mL/kg         5      1:2      50
   Gad et al. [17]             2019   Egypt         LSC/HE          balanced   ITN         30◦ TDB         6–8 mL/kg         0      1:2      77
    Lee et al. [18]            2019   Korea      lumbar spine       balanced   ITN          prone        8 mL/kg IBW        N/A     1:2      36
    Park et al. [7]            2019   Korea    Robotic/LSC/PSE      balanced   ITN        Steep TDB      8 mL/kg IBW         0      1:2      76
   Toker et al. [6]            2019   Turkey        LSC/HE          balanced   ITN         30◦ TDB      8 mL/kg PBW          5      1:2      100
   Kim et al. [19]             2019   Korea         hip joint       balanced   ITN            LD            8 mL/kg          5      1:2      76
   Kim et al. [20]             2018   Korea    Robotic/LSC/PSE      balanced   ITN         30◦ TDB       8 mL/kg IBW         0      1:2      78
  Kothari et al. [21]          2018    India       LSC/CHE          balanced   ITN         Head Up          8 mL/kg          5      1:2      50
 Sahutoglu et al. [8]          2018   Turkey      Lobectomy         balanced   DLT          Lateral    4–7 mL/kg PBW         4      1:2      80
 Mahmoud et al. [22]           2017   Egypt      Thoracotomy          TIVA     DLT          Lateral       6–10 mL/kg         10     1:2      70
  Assad et al. [23]            2016   Egypt           LSC           balanced   ITN           TDB            8 mL/kg          0      1:2      39
    Lin et al. [24]            2015   China         Thoracic          TIVA     DLT          Lateral       8–10 mL/kg        N/A     1:2      43
    Pu et al. [25]             2014   China         Thoracic          TIVA     DLT           N/A          8–10 mL/kg        N/A     1:2      20
   Song et al. [26]            2014   Korea         Thoracic          TIVA     DLT          Lateral     8 mL/kg ABW          0      1:2      27
    Hu et al. [27]             2014   China     TSC/Lobectomy       balanced   ITN          Lateral         7 mL/kg         N/A     1:1.5    30
  Boules et al. [28]           2011   Egypt         Thoracic        balanced   DLT          Lateral    6–10 mL/kg IBW        0      1:2      37
      ABW = actual body weight; CHE = cholecystectomy; DLT = double lumen tube; HE = hysterectomy; IBW = ideal body weight;
      I:E = inspiratory:expiratory ratio; ITN = intubation; LSC = Laparoscopic; N/A = not available; OBS = obstetric; PBW = predicted body
      weight; PEEP = positive end expiratory pressure; PSE = prostatectomy; TDB = Trendelenburg; TIVA = total intravenous anesthesia;
      TSC = Thoracoscopic.

                                       3.3. Study Quality and Risk of Bias
                                            All of the 17 included studies used a randomized, controlled design and were ap-
                                       proved by the local/institutional review board. Most of the publications were of moderate
                                       to high quality. In general, allocation processes were randomized and patients were un-
                                       aware of their treatment; baseline differences were not detected and there was no missing
                                       data. In many studies, it was either not clear how the investigator (e.g., the anesthesiologist
                                       performing the ventilation) was blinded with respect to the ventilation mode, or the study
                                       was explicitly not blinded in this regard. However, according to the Cochrane Risk of Bias
                                       methods, even if outcome assessors were aware of the intervention and if assessment of
                                       the outcome may—in theory—have been influenced by the knowledge of intervention
                                       received, it remains highly unlikely that assessment of the outcome was in fact influenced
                                       by the knowledge of the intervention received, as most endpoints were measured using
                                       objective, validated, or calibrated devices (e.g., airway pressures or blood gas analysis).
                                       Accordingly, risk of detection bias is only rated “high” for endpoints that are vulnerable
                                       to subjective evaluation (like non-calibrated treatment effects or subjective symptoms of
                                       patients), but not regarding measurements by calibrated devices. Therefore, the risk of
                                       detection bias (D4) was only moderate in this meta-analysis. Yet, for the same reason, risk
                                       of bias assessing adherence to intervention resulted in “some concerns” for a number of
                                       investigations included in this meta-analysis (Figures 2 and 3).
J. Clin. Med. 2021, 10, x FOR PEER REVIEW                                                                                7 of 17

J. Clin. Med. 2021, 10, 1276                                                                                             6 of 16
   J. Clin. Med. 2021, 10, x FOR PEER REVIEW                                                                          7 of 17

                                     Figure 2. Risk of bias traffic
                                     Figure 2.              traffic light
                                                                    light plot.
                                                                          plot.

                                     Figure 2. Risk of bias traffic light plot.

                                     Figure 3.
                                            3. Risk of bias summary plot.
                                     Figure 3. Risk of bias summary plot.
                                     3.4. Statistical Heterogeneity
                                         All included endpoints (Ppeak , Cdyn , pa O2 , and pa CO2 ) showed a significant het-
                                     erogeneity by either I2 > 50%, a χ2 with a p < 0.10, or both. In the absence of relevant
                                     asymmetry, the random effects model was applied to all analyses.
J. Clin. Med. 2021, 10, x FOR PEER REVIEW                                                                                                   8 of 17

                                        3.4. Statistical Heterogeneity
J. Clin. Med. 2021, 10, 1276                                                                                                                       7 of 16
                                             All included endpoints (Ppeak, Cdyn, paO2, and paCO2) showed a significant heteroge-
                                       neity by either I2 > 50%, a χ2 with a p < 0.10, or both. In the absence of relevant asymmetry,
                                       the random effects model was applied to all analyses.
                                      3.5. Airway Pressures
                                       3.5. Of
                                            Airway  Pressures
                                               the 17 studies included, 15 reported peak airway pressure (P           ), 9 studies reported
                                                                                                                            peak
                                      plateauOfairway
                                                  the 17 pressures
                                                         studies included,
                                                                     (Pplateau ),15and
                                                                                     reported     peakreported
                                                                                           13 studies     airway pressure
                                                                                                                   mean airway(Ppeak),pressures
                                                                                                                                        9 studies(Pre-
                                                                                                                                                     mean )
                                        ported   plateau airway   pressures   (P          ), and  13  studies
                                      for supine two-lung ventilation without capnoperitoneum. Data for dynamic
                                                                                   plateau                     reported    mean  airway    pressures
                                                                                                                                                  airway
                                        (Pmean) for supine
                                      compliance     (Cdyn ) two-lung   ventilation
                                                             were available    for nine   without    capnoperitoneum.
                                                                                              studies.   For all endpoints, Data  forsets
                                                                                                                               data    dynamic     air-
                                                                                                                                           were chosen
                                        way the
                                      from    compliance    (Cdyn)point
                                                  earliest time    were under
                                                                         available       for nine
                                                                                    general         studies. For
                                                                                                anesthesia         all endpoints,
                                                                                                               in supine    position data  setssufficient
                                                                                                                                        with     were
                                        chosen from the
                                      equilibration    for earliest
                                                            two-lungtime  point under
                                                                       ventilation            general
                                                                                           (e.g., 5–10anesthesia
                                                                                                         min afterininduction,
                                                                                                                        supine position
                                                                                                                                    10 min  with  suf-
                                                                                                                                              in supine
                                        ficient equilibration  for two-lung    ventilation
                                      position or after 5–30 min of two-lung ventilation).       (e.g., 5–10 min   after  induction,   10  min  in su-
                                        pinePeak
                                              position  or after 5–30  min  of  two-lung       ventilation).
                                                   airway pressures were significantly lower in patients ventilated with PCV-VG
                                             Peak airway
                                      undergoing      supinepressures
                                                              two-lungwere     significantly
                                                                          ventilation,             lower in
                                                                                             compared         patients
                                                                                                           with          ventilated
                                                                                                                 VCV under            with PCV-VG
                                                                                                                                the same     conditions
                                        undergoing supine two-lung ventilation, compared with VCV under the same conditions
                                      (p < 0.00001; Figure 4); the same result was found for Pplateau (p < 0.03; Figure 5). Pmean was
                                        (p < 0.00001; Figure 4); the same result was found for Pplateau (p < 0.03; Figure 5). Pmean was
                                      not different between both ventilation modes (p = 0.13; Figure 6). In addition, dynamic
                                        not different between both ventilation modes (p = 0.13; Figure 6). In addition, dynamic
                                      compliance was significantly higher within the same comparison (Figure 7).
                                        compliance was significantly higher within the same comparison (Figure 7).

            Figure
       Figure    4. 4. Peak
                    Peak       airway
                            airway     pressure(P(P
                                     pressure       peak): supine, two-lung ventilation. The green center of each square represents the
                                                  peak ): supine, two-lung ventilation. The green center of each square represents the
            weighted
       weighted        mean    difference
                    mean difference       for
                                        for   individual   trials,and
                                            individual trials,     andthe
                                                                       the corresponding
                                                                           corresponding horizontal
                                                                                         horizontalline
                                                                                                     linestands forfor
                                                                                                           stands    a 95% confidence
                                                                                                                       a 95%          interval.
                                                                                                                             confidence  interval.
    J. Clin.The
             Med.diamonds
                  2021, 10, x represent
                              FOR PEER pooled
                                         REVIEWresults.                                                                                       9 of 17
       The diamonds represent pooled results.

      Figure 5. Plateau
         Figure          airway
                5. Plateau       pressure
                            airway pressure  (P(P plateau): supine,
                                               plateau               two-lungventilation.
                                                            supine, two-lung   ventilation.The
                                                                                            Thegreen
                                                                                                green    center
                                                                                                      center  of of each
                                                                                                                  each   square
                                                                                                                       square   represents
                                                                                                                              represents thethe
         weighted
      weighted     mean
                mean     difference
                       difference forfor individualtrials,
                                       individual       trials,and
                                                                andthe
                                                                    the corresponding
                                                                        corresponding horizontal
                                                                                       horizontalline
                                                                                                   linestands forfor
                                                                                                         stands    a 95% confidence
                                                                                                                     a 95%          interval.
                                                                                                                           confidence  interval.
      TheThe diamonds
          diamonds      represent
                      represent    pooled
                                pooled      results.
                                          results.
J. Clin. Med. 2021, 10, 1276                                                                                                                     8 of 16
        Figure
        Figure 5. Plateau
                  Plateau airway
                          airwaypressure
                                  pressure(P(P      ): ):supine,
                                               plateau
                                             plateau       supine,   two-lung
                                                                  two-lung     ventilation.
                                                                             ventilation. TheThe
                                                                                              greengreen  center
                                                                                                     center       of each
                                                                                                             of each      square
                                                                                                                      square       represents
                                                                                                                              represents the the
        weighted  mean difference
        weighted mean   differencefor
                                   forindividual
                                       individualtrials,
                                                     trials,  and
                                                            and  thethe corresponding
                                                                      corresponding      horizontal
                                                                                      horizontal lineline stands
                                                                                                      stands for afor
                                                                                                                   95%a 95%  confidence
                                                                                                                        confidence        interval.
                                                                                                                                    interval.
        The
        The diamonds   representpooled
            diamonds represent   pooledresults.
                                          results.

        Figure6. 6.Mean
      Figure        Meanairway
                          airwaypressure
                                  pressure (P(Pmean
                                                mean):): supine,
                                                           supine,two-lung
                                                                    two-lungventilation.  TheThe
                                                                               ventilation.   green  center
                                                                                                 green        of each
                                                                                                          center       square
                                                                                                                 of each       represents
                                                                                                                           square         the the
                                                                                                                                  represents
        weighted
       Figure   6.  mean
                    Mean difference
                          airway    for individual
                                   pressure    (P      trials,
                                                        ):     and
                                                            supine, the corresponding
                                                                     two-lung          horizontal
                                                                                ventilation. The  line
                                                                                                  green stands for
                                                                                                           center  a
                                                                                                                   of95%
                                                                                                                      eachconfidence
                                                                                                                            square
      weighted mean difference for individual trials, and the corresponding horizontal line stands for a 95% confidence interval.
                                                  mean                                                                               interval.
                                                                                                                                    represents  the
        The diamonds
       weighted     meanrepresent pooled
                         difference  for   results.
                                         individual
      The diamonds represent pooled results.              trials, and the corresponding   horizontal   line stands  for a 95%  confidence  interval.
       The diamonds represent pooled results.

        Figure 7. Dynamic compliance (Cdyn): supine, two-lung ventilation. The green center of each square represents the
        weighted mean difference for individual trials, and the corresponding horizontal line stands for a 95% confidence interval.
        The diamonds
       Figure
      Figure          represent
             7. 7.Dynamic
                   Dynamic      pooled results.
                            compliance
                           compliance    (C(C   ):): supine,
                                              dyn
                                            dyn       supine, two-lung
                                                                two-lung ventilation.
                                                                           ventilation. The
                                                                                        The green
                                                                                            green center
                                                                                                     center of
                                                                                                             ofeach
                                                                                                                eachsquare
                                                                                                                       squarerepresents
                                                                                                                               representsthe
                                                                                                                                           the
       weighted   mean difference
      weighted mean difference forforindividual
                                       individualtrials,
                                                      trials,and
                                                              andthe
                                                                  thecorresponding
                                                                      correspondinghorizontal
                                                                                      horizontalline
                                                                                                  linestands
                                                                                                       standsfor
                                                                                                               foraa95%
                                                                                                                     95%confidence
                                                                                                                         confidenceinterval.
                                                                                                                                     interval.
       Thediamonds
      The   diamondsrepresent
                      represent  pooled
                               pooled     results.
                                        results.

                                      3.6. Blood Gas Analysis
                                           Of all the included studies, 15 reported arterial oxygen pressure (Pa O2 ) and arterial
                                      carbon dioxide pressure (Pa CO2 ) for supine two-lung ventilation without capnoperitoneum.
                                      There was no significant difference between both ventilation modes with respect to arterial
                                      oxygen (p = 0.12; Figure 8) and carbon dioxide (p = 0.17; Figure 9) levels.
J. Clin. Med. 2021, 10, x FOR PEER REVIEW                                                                                               10 of 17

                                       3.6. Blood Gas Analysis
                                       3.6. Blood
                                             Of allGas
                                                    theAnalysis
                                                        included studies, 15 reported arterial oxygen pressure (PaO2) and arterial
J. Clin. Med. 2021, 10, 1276           carbonOf dioxide
                                                all the included   (PaCO2)15
                                                         pressurestudies,    forreported
                                                                                  supine arterial
                                                                                         two-lung   ventilation
                                                                                                  oxygen         without
                                                                                                          pressure                   9 of 16
                                                                                                                    (PaO2)capnoperito-
                                                                                                                            and arterial
                                       neum.
                                       carbonThere
                                                dioxidewas no significant
                                                         pressure   (PaCO2difference
                                                                           ) for supinebetween
                                                                                         two-lungboth ventilationwithout
                                                                                                    ventilation    modes capnoperito-
                                                                                                                           with respect
                                       to arterial
                                       neum.       oxygen
                                               There   was (p
                                                           no=significant
                                                                0.12; Figure 8) and carbon
                                                                           difference        dioxide
                                                                                       between   both(pventilation
                                                                                                        = 0.17; Figure 9) levels.
                                                                                                                   modes   with respect
                                       to arterial oxygen (p = 0.12; Figure 8) and carbon dioxide (p = 0.17; Figure 9) levels.

      Figure 8. Arterial
         Figure          oxygen
                8. Arterial oxygenpressure
                                    pressure(P(P
                                               aOaO22):
                                                      ): supine, two-lungventilation.
                                                         supine, two-lung   ventilation.The
                                                                                         Thegreen
                                                                                             green    center
                                                                                                    center of of each
                                                                                                              each     square
                                                                                                                     square   represents
                                                                                                                            represents  thethe
         weighted
      weighted     mean
         Figure mean     difference
                      difference
                8. Arterial oxygen  for individual
                                  forpressure
                                      individual     trials,
                                              (PaOtrials,    and the corresponding
                                                             and two-lung
                                                     2): supine,     corresponding  horizontal
                                                                                     horizontal
                                                                           ventilation.        line
                                                                                        The green   stands
                                                                                                 line      for
                                                                                                      stands
                                                                                                    center      a
                                                                                                           of for 95%
                                                                                                               each    confidence
                                                                                                                   a 95%          interval.
                                                                                                                         confidence
                                                                                                                     square representsinterval.
                                                                                                                                        the
      TheThe diamonds
         weighted
          diamonds mean represent pooled
                         difference
                     represent             results. trials, and the corresponding horizontal line stands for a 95% confidence interval.
                                    for individual
                                pooled   results.
         The diamonds represent pooled results.

         Figure 9. Arterial carbon dioxide pressure (PaCO2): supine, two-lung ventilation. The green center of each square repre-
         sents
      Figure  9.the
         Figure   9.weighted
                  Arterial
                     Arterial  mean
                           carbon
                              carbon difference
                                   dioxide
                                      dioxide   for individual
                                            pressure
                                              pressure(Pa(P
                                                          CO 2 ):2trials,
                                                           aCO            andtwo-lung
                                                                   ):supine,
                                                                      supine, the corresponding
                                                                              two-lung           horizontal
                                                                                       ventilation.
                                                                                        ventilation.The     line
                                                                                                     Thegreen
                                                                                                         green   stands
                                                                                                               center
                                                                                                                center   for
                                                                                                                      ofof   a 95%
                                                                                                                          each
                                                                                                                           each    confidence
                                                                                                                                square
                                                                                                                                 squarerepresents
                                                                                                                                        repre-
         interval.
         sents  the The diamonds
                    weighted   mean represent pooled
                                     difference for    results.
                                                    individual    trials, and the corresponding
      the weighted mean difference for individual trials, and the corresponding horizontal       horizontal line stands  for a 95% confidence
                                                                                                                  stands for a 95% confidence
         interval.
      interval.  TheThe diamonds
                      diamonds      representpooled
                                  represent   pooledresults.
                                                       results.
                                      3.7. Subgroup Evaluation: One-Lung Ventilation
                                      3.7. Subgroup    Evaluation: One-Lung
                                            Eight publications                 Ventilation
                                     3.7. Subgroup    Evaluation:reported
                                                                    One-Lung results  for Ppeak, PaO2, and PaCO2 after 20 min (n = 1), 30
                                                                                Ventilation
                                      min (n   = 3),publications
                                            Eight    and after 60 reported
                                                                    min (n = 4) of one-lung
                                                                             results  for Ppeakventilation.
                                                                                                , PaO2, and As
                                                                                                            PaCOthis set of20data
                                                                                                                  2 after     minis(ndifferent
                                                                                                                                      = 1), 30
                                           Eight publications reported results for Ppeak , Pa O2 , and Pa CO2 after 20 min (n = 1),
                                      from
                                      min (n the above
                                               = 3), andwith
                                                          after respect
                                                                 60 min to
                                                                        (n time
                                                                           = 4) ofofone-lung
                                                                                     measurement     and patient
                                                                                               ventilation. As thisposition,  these
                                                                                                                     set of data     data are
                                                                                                                                  is different
                                     30 min (n =in3),
                                      presented
                                                         and after
                                                      a separate
                                                                     60 min
                                                                   analysis
                                                                               (n = and
                                                                            below,
                                                                                     4) of  one-lung ventilation.
                                                                                          not included
                                                                                                                        As thisPeak
                                                                                                                                  set airway
                                                                                                                                       of data is
                                      from the above     with respect   to time  of measurement      andaspatient
                                                                                                            a true position,
                                                                                                                   subgroup.these    data are
                                     different  from the above with respect to time of measurement and patient position, these
                                      presented in a separate analysis below, and not included as a true subgroup. Peak airway
                                     data are presented in a separate analysis below, and not included as a true subgroup. Peak
                                     airway pressures (p < 0.00001; Figure 10) were significantly lower and arterial oxygen
                                     pressures (p = 0.02; Figure 11) were significantly higher in patients ventilated with PCV-VG
                                     undergoing one-lung ventilation, compared with VCV under the same conditions. There
                                     was no significant difference between both ventilation modes with respect to arterial carbon
                                     dioxide levels (p = 0.67; Forest plot not shown).
J. Clin. Med. 2021, 10, x FOR PEER REVIEW                                                                                                  11 of 17

                                        pressures (p < 0.00001; Figure 10) were significantly lower and arterial oxygen pressures
                                        pressures   (p < 0.00001;
                                        (p = 0.02; Figure  11) wereFigure  10) werehigher
                                                                      significantly  significantly lower
                                                                                            in patients   and arterial
                                                                                                        ventilated withoxygen
                                                                                                                        PCV-VG  pressures
                                                                                                                                   under-
J. Clin. Med. 2021, 10, 1276            (p = 0.02;
                                        going      Figure ventilation,
                                                one-lung   11) were significantly
                                                                         compared higher
                                                                                    with VCVin patients ventilated
                                                                                                under the          with PCV-VG
                                                                                                           same conditions.   There   10 of 16
                                                                                                                                   under-
                                                                                                                                      was
                                        going  one-lungdifference
                                        no significant     ventilation,  compared
                                                                     between   both with  VCV under
                                                                                     ventilation modesthe  same
                                                                                                         with     conditions.
                                                                                                               respect        There
                                                                                                                       to arterial    was
                                                                                                                                   carbon
                                        no  significant
                                        dioxide  levels difference   between
                                                         (p = 0.67; Forest plotboth  ventilation modes with respect to arterial carbon
                                                                                not shown).
                                        dioxide levels (p = 0.67; Forest plot not shown).

      Figure      Peak
              10.10.
         Figure         airway
                     Peak airwaypressure
                                  pressure(P(P peak):
                                             peak   ): after 20–60 min
                                                       after 20–60   min of
                                                                         ofone-lung
                                                                             one-lungventilation.
                                                                                       ventilation.The
                                                                                                    Thegreen
                                                                                                         green center
                                                                                                             center  of of each
                                                                                                                        each     square
                                                                                                                              square    represents
                                                                                                                                     represents
         Figure
      thethe     10.
          weighted
             weightedPeak
                      meanairway
                        mean      pressure
                             difference
                               differencefor(P     ):  after
                                           forindividual     20–60
                                                individualtrials,
                                               peak                 min  of
                                                               trials, and  one-lung
                                                                       and the        ventilation.
                                                                            the corresponding      The green center
                                                                                                 horizontalline
                                                                                corresponding horizontal             of
                                                                                                             linestands each
                                                                                                                   stands     square
                                                                                                                         forfor a 95%
                                                                                                                              a 95%  represents
                                                                                                                                       confidence
                                                                                                                                     confidence
         the weighted
         interval.
      interval. TheThe  mean difference
                       diamonds
                     diamonds              for
                                   represent
                                 represent      individual
                                               pooled
                                            pooled             trials, and the corresponding horizontal line stands for a 95% confidence
                                                         results.
                                                        results.
         interval. The diamonds represent pooled results.

         Figure 11. Arterial oxygen pressure (PaO2): after 20–60 min of one-lung ventilation. The green center of each square repre-
      Figure
         sents11.
         Figurethe Arterial
                 11. Arterialoxygen
                    weighted  oxygen pressure
                              mean difference   (PaO
                                     pressure for
                                               (P    O  2 ):
                                                      2):     after
                                                          after
                                                   aindividual       20–60
                                                                 20–60   min
                                                                   trials,   min
                                                                           andoftheof one-lung
                                                                                 one-lung       ventilation.
                                                                                           ventilation.
                                                                                    corresponding             Thecenter
                                                                                                        The green
                                                                                                   horizontal line  greenof
                                                                                                                   stands  center
                                                                                                                            each
                                                                                                                          for      ofconfidence
                                                                                                                                      each
                                                                                                                                  square
                                                                                                                              a 95%         square
                                                                                                                                          repre-
         sents thethe
      represents
         interval. weighted
                   The        meanmean
                       weighted
                        diamonds   difference for individual
                                         difference
                                  represent  pooled               trials, and
                                                        for individual
                                                       results.                the corresponding
                                                                            trials,                horizontal line
                                                                                     and the corresponding         stands for
                                                                                                              horizontal      a 95%
                                                                                                                           line      confidence
                                                                                                                                 stands  for a 95%
         interval. interval.
      confidence   The diamonds   represent pooled
                             The diamonds    represent results.
                                                             pooled results.
                                         3.8. Subgroup Evaluation: Trendelenburg Position
                                         3.8. Subgroup Evaluation: Trendelenburg Position
                                               Five investigations
                                       3.8. Subgroup    Evaluation: presented    various
                                                                      Trendelenburg       parameters for variable time points of Trende-
                                                                                      Position
                                               Fivepositions.
                                         lenburg     investigations
                                                              In all presented
                                                                     studies, P  various
                                                                                peak was  parameters
                                                                                         reported    for for   variable
                                                                                                           60 min         time points ofposition-
                                                                                                                    of Trendelenburg          Trende-
                                              Five investigations presented various parameters             for variable   time points of Trendelen-
                                         lenburg   positions.
                                         ing. positions.      In all studies,
                                               Ppeak was significantly        P      was reported    for   60  min  of  Trendelenburg       position-
                                                          In all studies,lower
                                                                           Ppeak in  patients  ventilated      withof PCV-VG        after 60positioning.
                                                                                                                                               min in
                                                                               peak
                                       burg                                       was  reported    for 60 min          Trendelenburg
                                         ing.  Ppeak was significantly
                                         Trendelenburg     position,     lower
                                                                      compared   in  patients
                                                                                  with VCV     ventilated
                                                                                             under      the    withconditions
                                                                                                             same      PCV-VG (pafter =    60 min
                                                                                                                                        0.003; Figurein
                                       Ppeak was significantly lower in patients ventilated with PCV-VG after 60 min in Trendelen-
                                         Trendelenburg     position,  compared    with VCV   under      the  same  conditions
                                         12). There was no significant difference between both ventilation modes with respect to   (p = 0.003; Figure
                                       burg   position, compared with VCV under the same conditions (p = 0.003; Figure 12). There
                                         12). There was
                                         the arterial      no significant
                                                       oxygen  and carbondifference    between
                                                                            dioxide levels    (PaOboth
                                                                                                    2: p =ventilation
                                                                                                             0.94; PaCOmodes         with
                                                                                                                          2: p = 0.61;     respect
                                                                                                                                         Forest      to
                                                                                                                                                  plots
                                       was
    J. Clin. Med. 2021, 10, x FOR PEER REVIEW
                                         the
                                             no  significant
                                              arterial oxygen
                                                              difference
                                                               and
                                                                          between
                                                                     carbon dioxide
                                                                                      both
                                                                                      levels
                                                                                            ventilation
                                                                                              (P  O   :  p =
                                                                                                              modes
                                                                                                             0.94; P
                                                                                                                        with
                                                                                                                       CO   : p
                                                                                                                                respect
                                                                                                                                 = 0.61;
                                                                                                                                          to the12plots
                                                                                                                                         Forest
                                                                                                                                                  arterial
                                                                                                                                                   of 17
                                         not shown).                                             a  2                a    2
                                       oxygen    and carbon dioxide levels (Pa O2 : p = 0.94; Pa CO2 : p = 0.61; Forest plots not shown).
                                         not shown).

      Figure      Peak
              12.12.
         Figure         airway
                     Peak airwaypressure
                                  pressure(P(P peak):
                                             peak  ): after 60
                                                            60 min
                                                                minof ofTrendelenburg
                                                                         Trendelenburgposition.
                                                                                        position.The
                                                                                                  Thegreen
                                                                                                       green center
                                                                                                           center  of of each
                                                                                                                      each     square
                                                                                                                            square    represents
                                                                                                                                   represents
      thethe weighted
          weighted      mean
                      mean     differencefor
                             difference    forindividual
                                                individualtrials,
                                                              trials, and
                                                                      and the
                                                                           the corresponding
                                                                               corresponding horizontal
                                                                                               horizontalline
                                                                                                           linestands
                                                                                                                 standsforfor
                                                                                                                            a 95%
                                                                                                                              a 95%confidence
                                                                                                                                     confidence
         interval.
      interval. TheThe diamonds
                     diamonds      representpooled
                                 represent     pooledresults.
                                                        results.

                                        3.9. Hemodynamic Data
                                             Hemodynamic parameters were reported only inconsistently or inhomogeneous and
                                        sometimes incomplete, and were therefore not evaluated further. In general, all investiga-
                                        tors reported stable hemodynamic conditions for all patients. Further, no adverse events
                                        were detected with respect to the hemodynamic instability (see below).
J. Clin. Med. 2021, 10, 1276                                                                                                                   11 of 16

                                     3.9. Hemodynamic Data
                                          Hemodynamic parameters were reported only inconsistently or inhomogeneous and
                                     sometimes incomplete, and were therefore not evaluated further. In general, all investiga-
                                     tors reported stable hemodynamic conditions for all patients. Further, no adverse events
                                     were detected with respect to the hemodynamic instability (see below).

                                     3.10. Adverse Events and Additional Outcome Parameters
                                           In eight publications, adverse events and various postoperative outcome parameters
                                     were explicitly reported (Table 3). In all other studies, those endpoints were not mentioned.
                                     Whenever postoperative events were investigated, most parameters did not show any
                                     significant differences between groups. Park et al. reported significantly more postopera-
                                     tive fever in VCV-ventilated patients [7]. Mahmoud and colleagues reported significantly
                                     improved outcomes, like postoperative oxygenation and even a reduced ICU and hospital
                                     stay, in PCV-VG-ventilated patients compared with VCV [22]. Yao and colleagues observed
                                     significantly lower neutrophil elastase levels after PCV-VG ventilation compared with
                                     VCV [16]. Sahutoglu et al. reported a non-significant trend toward more complications in
                                     PCV-VG, however, individual complications were almost identical between groups [8]. In
                                     general, no serious adverse events were reported.

                                        Table 3. Adverse events and additional outcome parameters.

                                                         PCV-
       Publication               Adverse Event                        VCV          p-Value                  Report on Adverse Events
                                                         VG
      Yao 2020 [16]               PACU time              1.79 h       1.56 h         0.150               No difference between groups
                                 Re-intubation            4%           4%            0.750              NE significantly lower in PCV-VG
                                 Lung infection           8%           4%            0.500
                                 Hospital stay           7.5 d        8.2 d          0.100
      Park 2019 [7]               PostOP fever             3%          12%           0.022          Significantly more post-OP fever in VCV
      Kim 2019 [19]                     -                   -            -             -                     No critical complications
      Kim 2018 [20]               PostOP fever          20.5%        28.2%           0.429                No difference between groups
                                   PACU time            48 min       45 min          0.813
                                 Hospital stay            3d           2d            0.275
                                30d-readmission          7.7%         7.7%           0.999
   Sahutoglu 2018 [8]           > 1 complication          25%         7.5%           0.066         No difference for individual complications
                                                                                                   Significantly shorter ICU and hospital stay
  Mahmoud 2017 [22]            Total complications        14%          46%           0.004
                                                                                                       and less complications in PCV-VG
                                  Pneumonia               9%           17%           0.284
                                     ARDS                 0%           6%            0.151
                                   Atelectasis            6%           17%           0.133
                                    ICU stay             19.2 h       29.1 h         0.013
                                  Hospital stay          8.1 d        13.2 d         0.033
                                                                                                  Reporting of no complications, but only 1 h
    Assad 2016 [23]                     -                   -            -             -
                                                                                                          post-OP observation time
                                                                                                    No significant difference in post-OP lung
    Boules 2011 [28]            Basal atelectasis        3 pat        4 pat           n.s.
                                                                                                                    expansion
      Bold values indicate significant findings. ARDS = adult respiratory distress syndrome; NE = neutrophil elastase; ICU = intensive care unit;
      OI = oxygenation index; PACU = post anesthesia care unit; PCV-VG = pressure-controlled ventilation with volume guarantee/targeting;
      VCV = volume-controlled ventilation.

                                     4. Discussion
                                          This systematic review and meta-analysis included 17 randomized, controlled trials
                                     that compared PCV-VG with VCV in 929 patients scheduled for elective major non-cardiac
                                     surgery under general anesthesia. PCV-VG aims at combining the advantages of VCV
                                     and PCV to ensure a target tidal volume with a decelerating flow. Depending on the
J. Clin. Med. 2021, 10, 1276                                                                                          12 of 16

                               previous breath, lung compliance is being calculated and the tidal volume is applied with
                               the lowest inspiratory pressure possible [1,29]. So far, several studies have examined the
                               effects of PCV-VG compared with the various conventional modes of ventilation, like
                               VCV. However, the published data gave no clear direction for or against the superiority of
                               any specific ventilation technology. Therefore, in this meta-analysis, we investigated the
                               potential short-term outcome parameters e.g., airway compliance, airway pressures, and
                               gas exchange in PCV-VG compared to the conventional, volume-controlled ventilation. Of
                               the 17 included studies, 15 reported peak airway pressure, arterial oxygen pressure, and
                               arterial carbon dioxide pressure for supine two-lung ventilation. Nine studies presented
                               data for plateau airway pressure and dynamic airway compliance, and five gave data for a
                               specific period of Trendelenburg position.
                                     As this meta-analysis shows, peak airway and plateau pressures were significantly
                               lower in patients ventilated with PCV-VG undergoing supine two-lung ventilation, com-
                               pared with VCV. Regarding these endpoints, only three studies showed no difference
                               for peak airway pressures, while the other twelve demonstrated moderately to signifi-
                               cantly reduced peak airway pressures when using PCV-VG. These findings are in line
                               with the previous meta-analyses comparing VCV and PCV—yet without volume target-
                               ing (“PCV-non-VG”)—resulting in significantly lower peak inspiratory pressures when
                               using a PCV-non-VG mode, compared with VCV [5,30]. The decelerating airway flow,
                               usually characterizing pressure-controlled ventilation, and digital feedback mechanisms
                               may contribute further to the reduction of the peak airway pressure using PCV-VG.
                                     High airway pressures and large tidal volumes during mechanical ventilation are not
                               part of a lung protective ventilation strategy and may therefore cause acute lung injury [31].
                               As our study shows that PCV-VG was associated with lower Ppeak and lower Pplateau than
                               similar ventilation with VCV, this could have the potential to correspond with a decreased
                               risk of ventilator-induced lung injury. This idea is supported by the (single) report on a
                               significantly reduced neutrophil elastase after the use of PCV-VG [16], as well as the finding
                               that total complications, ICU and hospital stay were significantly reduced in the PCV-VG
                               group [22]. On the other hand, this is not in line with the study of Sahutoglu, indicating a
                               non-significant trend toward more postoperative complications in the PCV-VG group [8].
                               Yet, this meta-analysis was not designed to evaluate the potential effects on lung injury,
                               and therefore, these interpretations can only be preliminary.
                                     The clinical relevance of peak airway pressure for the development of barotrauma—
                               especially in the course of intraoperative ventilation—is controversial. Some authors
                               propose that peak airway pressure could not properly reflect the alveolar pressure [5,32].
                               On the other hand, peak airway pressure is the most frequently reported value, and one
                               of the most important, clinically most useful, and readily available parameter regarding
                               airway pressures in ventilation practice. Most importantly, it was the most common
                               parameter comparing the two ventilation strategies across all included studies.
                                     Evaluation and interpretation of long-term effects using PCV-VG or VCV is chal-
                               lenging. Multiple postoperative outcome parameters were mentioned in eight out of the
                               17 publications. Only one study reported a significant difference for postoperative out-
                               come parameters with reduced ICU and hospital stay in the PCV-VG group [22]. Yet, while
                               questions on long-term outcomes may not be satisfyingly answered by this evaluation,
                               the reported data on adverse events—although limited—also allow the assumption that
                               PCV-VG does not result in an increased number of serious adverse events, compared
                               with VCV.
                                     No significant differences were seen for arterial oxygen pressure between VCV and
                               PCV-VG. However, only four out of 15 included studies showed mild to moderate re-
                               ductions in arterial oxygenation in the PCV-VG group, compared with the VCV group.
                               Therefore, based on the reported data, serious disadvantages in respect of arterial oxygena-
                               tion using PCV-VG cannot be postulated. In the same fashion, no significant differences
                               were seen for arterial carbon dioxide pressure for both ventilation techniques.
J. Clin. Med. 2021, 10, 1276                                                                                           13 of 16

                                     Data for airway compliance were extracted from nine studies. All of those included
                               studies showed an improvement in compliances using PCV-VG compared to VCV. Accord-
                               ingly, our analysis reveals significant superiority of the PCV-VG technique with respect to
                               dynamic airway compliance as a functional lung parameter in mechanical ventilation.
                                     A subgroup analysis including nine studies for one-lung ventilation was carried out
                               with regard to the parameters peak airway pressure, arterial oxygen pressure, and arterial
                               carbon dioxide pressure. Comparable results for peak airway pressure were found, but
                               a significantly higher arterial oxygen pressure was measured using PCV-VG. There were
                               no significant differences in oxygen saturation. Changes in pressure conditions during
                               one-lung ventilation, different measurement time, and patient positioning, however, were
                               potential confounders that may blur these results. Most of the studies had excluded patients
                               with poor preoperative pulmonary function or severe lung diseases. Assuming that this
                               particularly critically ill patient group would benefit from PCV-VG, the effect of PCV-VG
                               might have been underestimated. The mechanism for this beneficial effect of PCV-VG
                               on oxygenation during one-lung ventilation remains to be established. It is tempting to
                               speculate that PCV-VG might have an impact on the closing capacity during thoracic
                               surgery. This could—in theory—be caused by the fact that the flow during PCV-VG is not
                               fixed, potentially resulting in a higher ventilation of small airways in the environment of a
                               higher extraluminal pressure.
                                     This meta-analysis has various limitations. First, PCV-VG is a relatively new mode of
                               ventilation, and only 17 investigations fulfilled the inclusion criteria for our meta-analysis.
                               Especially in subgroup analyses, a relatively small number of patients was included and
                               the range of patients per study was 20–100, indicating that intervention effects could be
                               significantly overstated in small study groups.
                                     Second, double blinding was not performed by all investigators due to the chosen
                               study design and clinical needs. As discussed above, this should not have had a rele-
                               vant impact on the results, as measurements of airway pressures and blood gases were
                               performed using calibrated machines. Therefore, these data were not prone to subjective
                               falsification. In accordance with the Cochrane Methods, the risk of bias due to this effect
                               was consequentially only moderate, and we believe that the data are reliable.
                                     Third, all studies derived from selected regions of the world. This may theoretically
                               have an impact on our findings, as loco-regional effects of a health-care system cannot
                               be excluded completely. On the other hand, the objective measurement of the primary
                               endpoints of this meta-analysis should not have been influenced by the origin of the studies.
                                     Fourth, regarding all primary endpoints as well as subgroup analysis for one-lung
                               ventilation, measurements for airway pressures and blood gas analysis were taken at
                               different time points (e.g., 20, 40, or 60 min after one-lung ventilation). Therefore, for
                               interpretation of the results, individual factors of each study member and surgical progress
                               must be taken into account.
                                     Fifth, although data were generally symmetrical, most evaluations revealed a relevant
                               heterogeneity of the studies included. To draw substantial conclusions for clinical practice,
                               large-scale investigations with rigorous inclusion criteria would be needed. Due to the
                               heterogeneity observed, the results need to be interpreted with caution.
                                     Finally, it was not possible to extract uniform long-term parameters as these were not
                               reported regularly. Therefore, long-term effects due to different intraoperative ventilation
                               strategies (e.g., VCV or PCV-VG) cannot be assessed. However, this was not a primary
                               endpoint of this investigation.
                                     Yet, this meta-analysis has also certain strengths: to our knowledge, this is the first
                               systematic review of PCV-VG compared with VCV. Further, this investigation includes
                               the data of over 900 patients from 17 prospective, randomized trials. Over 90% of the
                               data is relatively new (2014+) and derives from relatively homogenous populations. All
                               endpoints were obtained using strictly objective measurements with a very low risk of
                               bias. Consequently, overall risk of bias in all studies was low to moderate and intervention
                               effects were, to the best of our knowledge, properly estimated. Further, measurements for
J. Clin. Med. 2021, 10, 1276                                                                                                           14 of 16

                                   mechanical ventilation and gas exchange have been well reported. All recorded endpoints
                                   were related to the intraoperative or direct postoperative period. Therefore, this meta-
                                   analysis—despite some limitations—may add a significant amount to our knowledge on
                                   intraoperative ventilation regarding this new volume-targeting ventilation mode, PCV-VG.
                                         Our investigation raises an important clinical question: Based on our findings, should
                                   this new mode of ventilation, PCV-VG, be routinely used in the perioperative setting? From
                                   a historical perspective, many modern ventilation modes have failed to allow for significant,
                                   long-term improvements of clinical practice. Yet, PCV-VG has the potential to combine two
                                   former “opponents” of ventilation in a single mode of action. As Ball and colleagues have
                                   put it into words, PCV-VG appears to offer “undoubted clinical advantages” [1]. Whether
                                   this mode will fulfill our high expectations for the perioperative setting, remains to be
                                   determined by future studies. Until these data are available, PCV-VG may not necessarily
                                   qualify as the “new standard” in the operating theatre, but could nonetheless prove to be
                                   useful for the individual patient.

                                   5. Conclusions
                                        This systematic review and meta-analysis indicate that PCV-VG may provide benefits
                                   in terms of improved airway dynamics compared to VCV in adults undergoing elective
                                   non-cardiac surgery. PCV-VG appears to be a safe ventilation technique without relevant
                                   disadvantages or even inferiority, with respect to the evaluated endpoints. In two lung-
                                   ventilation in supine position, peak airway and plateau pressure were significantly lower
                                   and dynamic compliance was significantly higher for PCV-VG-ventilated patients. In
                                   one-lung ventilation, peak airway pressures and oxygenation were improved. Overall,
                                   the use of the PCV-VG technique for intraoperative ventilation appears to be beneficial,
                                   although valid data of long-term outcome parameters for distinct ventilation modes remain
                                   to be established.

                                   Author Contributions: Conceptualization, A.M.; methodology, A.M., J.H., F.D., V.S.; validation,
                                   A.M., J.H.; formal analysis, R.E., S.K., S.C., F.D., V.S.; investigation, R.E., S.K., S.C., F.D., V.S.; data
                                   curation, R.E., S.K., S.C., F.D., V.S.; writing—original draft preparation, A.M., V.S., F.D.; writing—
                                   review and editing, A.M., J.H.; supervision, A.M.; project administration, A.M.; All authors have
                                   read and agreed to the published version of the manuscript
                                   Funding: This research received no external funding.
                                   Institutional Review Board Statement: Not applicable.
                                   Informed Consent Statement: Not applicable.
                                   Data Availability Statement: No new data were created or analyzed in this study. Data sharing is
                                   not applicable to this article.
                                   Acknowledgments: This study contains part of the data of Ronny Eckardt for the fulfillment of the
                                   requirements toward his doctoral degree from the University of Cologne, Faculty of Medicine.
                                   Conflicts of Interest: The authors declare no conflict of interest.

References
1.    Ball, L.; Dameri, M.; Pelosi, P. Modes of mechanical ventilation for the operating room. Best Pract. Res. Clin. Anaesthesiol. 2015, 29,
      285–299. [CrossRef]
2.    Ogurlu, M.; Kucuk, M.; Bilgin, F.; Sizlan, A.; Yanarates, O.; Eksert, S.; Karasahin, E.; Cosar, A. Pressure-controlled vs. volume-
      controlled ventilation during laparoscopic gynecologic surgery. J. Minim. Invasive Gynecol. 2010, 17, 295–300. [CrossRef]
      [PubMed]
3.    Zhu, Y.Q.; Fang, F.; Ling, X.M.; Huang, J.; Cang, J. Pressure-controlled versus volume-controlled ventilation during one-lung
      ventilation for video-assisted thoracoscopic lobectomy. J. Thorac. Dis. 2017, 9, 1303–1309. [CrossRef]
4.    Campbell, R.S.; Davis, B.R. Pressure-controlled versus volume-controlled ventilation: Does it matter? Respir Care 2002, 47,
      416–424, discussion 424-416. [PubMed]
5.    Jiang, J.; Li, B.; Kang, N.; Wu, A.; Yue, Y. Pressure-Controlled Versus Volume-Controlled Ventilation for Surgical Patients:
      A Systematic Review and Meta-analysis. J. Cardiothorac. Vasc. Anesth. 2016, 30, 501–514. [CrossRef]
J. Clin. Med. 2021, 10, 1276                                                                                                        15 of 16

6.    Toker, M.K.; Altiparmak, B.; Uysal, A.I.; Demirbilek, S.G. [Comparison of pressure-controlled volume-guaranteed ventilation and
      volume-controlled ventilation in obese patients during gynecologic laparoscopic surgery in the Trendelenburg position]. Rev.
      Bras. Anestesiol. 2019, 69, 553–560. [CrossRef]
7.    Park, J.H.; Park, I.K.; Choi, S.H.; Eum, D.; Kim, M.S. Volume-Controlled Versus Dual-Controlled Ventilation during Robot-Assisted
      Laparoscopic Prostatectomy with Steep Trendelenburg Position: A Randomized-Controlled Trial. J. Clin. Med. 2019, 8. [CrossRef]
      [PubMed]
8.    Sahutoglu, C.; Kocabas, S.; Askar, F.Z. Effects of pressure-controlled ventilation-volume guaranteed on airway pressure, oxygena-
      tion, and postoperative complications in one-lung ventilation: A prospective randomized-controlled study. Int. J. Clin. Exp. Med.
      2018, 11, 13681–13688.
9.    Moher, D.; Liberati, A.; Tetzlaff, J.; Altman, D.G.; The PRISMA Group. Preferred reporting items for systematic reviews and
      meta-analyses: The PRISMA statement. J. Clin. Epidemiol. 2009, 62, 1006–1012. [CrossRef] [PubMed]
10.   Higgins, J.P.T.; Thomas, J.; Chandler, J.; Cumpston, M.; Li, T.; Page, M.J.; Welch, V.A. (Eds.) Cochrane Handbook for Systematic
      Reviews of Interventions Version 6.1 (Updated September 2020); John Wiley & Sons: Hoboken, NJ, USA, 2020. Available online:
      www.training.cochrane.org/handbook (accessed on 17 March 2021).
11.   Sterne, J.A.C.; Savovic, J.; Page, M.J.; Elbers, R.G.; Blencowe, N.S.; Boutron, I.; Cates, C.J.; Cheng, H.Y.; Corbett, M.S.; Eldridge,
      S.M.; et al. RoB 2: A revised tool for assessing risk of bias in randomised trials. BMJ 2019, 366, l4898. [CrossRef]
12.   McGuinness, L.A.; Higgins, J.P.T. Risk-of-bias VISualization (robvis): An R package and Shiny web app for visualizing risk-of-bias
      assessments. Res. Synth. Methods 2021, 12, 55–61. [CrossRef]
13.   Hozo, S.P.; Djulbegovic, B.; Hozo, I. Estimating the mean and variance from the median, range, and the size of a sample. BMC
      Med. Res. Methodol. 2005, 5, 13. [CrossRef]
14.   Borenstein, M.; Hedges, L.V.; Higgins, J.P.; Rothstein, H.R. A basic introduction to fixed-effect and random-effects models for
      meta-analysis. Res. Synth. Methods 2010, 1, 97–111. [CrossRef]
15.   Lee, J.M.; Lee, S.K.; Rhim, C.C.; Seo, K.H.; Han, M.; Kim, S.Y.; Park, E.Y. Comparison of volume-controlled, pressure-controlled,
      and pressure-controlled volume-guaranteed ventilation during robot-assisted laparoscopic gynecologic surgery in the Trendelen-
      burg position. Int. J. Med. Sci. 2020, 17, 2728–2734. [CrossRef]
16.   Yao, W.; Yang, M.; Cheng, Q.; Shan, S.; Yang, B.; Han, Q.; Ma, J. Effect of Pressure-Controlled Ventilation-Volume Guaranteed on
      One-Lung Ventilation in Elderly Patients Undergoing Thoracotomy. Med. Sci. Monit. 2020, 26, e921417. [CrossRef]
17.   Gad, M.; Gaballa, K.; Abdallah, A.; Abdelkhalek, M.; Zayed, A.; Nabil, H. Pressure-Controlled Ventilation with Volume Guarantee
      Compared to Volume-Controlled Ventilation with Equal Ratio in Obese Patients Undergoing Laparoscopic Hysterectomy. Anesth.
      Essays Res. 2019, 13, 347–353. [CrossRef] [PubMed]
18.   Lee, J.M.; Lee, S.K.; Kim, K.M.; Kim, Y.J.; Park, E.Y. Comparison of volume-controlled ventilation mode and pressure-controlled
      ventilation with volume-guaranteed mode in the prone position during lumbar spine surgery. BMC Anesthesiol. 2019, 19, 133.
      [CrossRef]
19.   Kim, Y.S.; Won, Y.J.; Lee, D.K.; Lim, B.G.; Kim, H.; Lee, I.O.; Yun, J.H.; Kong, M.H. Lung ultrasound score-based perioperative
      assessment of pressure-controlled ventilation-volume guaranteed or volume-controlled ventilation in geriatrics: A prospective
      randomized controlled trial. Clin. Interv. Aging 2019, 14, 1319–1329. [CrossRef]
20.   Kim, M.S.; Soh, S.; Kim, S.Y.; Song, M.S.; Park, J.H. Comparisons of Pressure-controlled Ventilation with Volume Guarantee and
      Volume-controlled 1:1 Equal Ratio Ventilation on Oxygenation and Respiratory Mechanics during Robot-assisted Laparoscopic
      Radical Prostatectomy: A Randomized-controlled Trial. Int. J. Med. Sci. 2018, 15, 1522–1529. [CrossRef] [PubMed]
21.   Kothari, A.; Baskaran, D. Pressure-controlled Volume Guaranteed Mode Improves Respiratory Dynamics during Laparoscopic
      Cholecystectomy: A Comparison with Conventional Modes. Anesth. Essays Res. 2018, 12, 206–212. [CrossRef] [PubMed]
22.   Mahmoud, K.; Ammar, A.; Kasemy, Z. Comparison Between Pressure-Regulated Volume-Controlled and Volume-Controlled
      Ventilation on Oxygenation Parameters, Airway Pressures, and Immune Modulation During Thoracic Surgery. J. Cardiothorac.
      Vasc. Anesth. 2017, 31, 1760–1766. [CrossRef] [PubMed]
23.   Assad, O.M.; El Sayed, A.A.; Khalil, M.A. Comparison of volume-controlled ventilation and pressure-controlled ventilation
      volume guaranteed during laparoscopic surgery in Trendelenburg position. J. Clin. Anesth. 2016, 34, 55–61. [CrossRef] [PubMed]
24.   Lin, F.; Pan, L.; Qian, W.; Ge, W.; Dai, H.; Liang, Y. Comparison of three ventilatory modes during one-lung ventilation in elderly
      patients. Int. J. Clin. Exp. Med. 2015, 8, 9955–9960. [PubMed]
25.   Pu, J.; Liu, Z.; Yang, L.; Wang, Y.; Jiang, J. Applications of pressure control ventilation volume guaranteed during one-lung
      ventilation in thoracic surgery. Int. J. Clin. Exp. Med. 2014, 7, 1094–1098. [PubMed]
26.   Song, S.Y.; Jung, J.Y.; Cho, M.S.; Kim, J.H.; Ryu, T.H.; Kim, B.I. Volume-controlled versus pressure-controlled ventilation-volume
      guaranteed mode during one-lung ventilation. Korean J. Anesthesiol. 2014, 67, 258–263. [CrossRef] [PubMed]
27.   Hu, X.; Shen, H.; Li, X.; Chen, J. [Effects of volume-controlled ventilation and pressure-controlled volume- guaranteed mode
      during one-lung ventilation on circulation, pulmonary function and lung injury]. Zhonghua Yi Xue Za Zhi 2014, 94, 1006–1009.
28.   Boules, N.S.; Ghobrial, H.Z. Efficiency of the newly introduced ventilatory mode “pressure controlled ventilation-volume
      guaranteed” in thoracic surgery with one lung ventilation. Egypt. J. Anaesth. 2011, 27, 113–119. [CrossRef]
29.   Dion, J.M.; McKee, C.; Tobias, J.D.; Sohner, P.; Herz, D.; Teich, S.; Rice, J.; Barry, N.D.; Michalsky, M. Ventilation during
      laparoscopic-assisted bariatric surgery: Volume-controlled, pressure-controlled or volume-guaranteed pressure-regulated modes.
      Int. J. Clin. Exp. Med. 2014, 7, 2242–2247.
You can also read