Community Reinvestment Act Strategic Plan 2022 - 2024 - University Bank
←
→
Page content transcription
If your browser does not render page correctly, please read the page content below
Community Reinvestment Act
             Strategic Plan
                    2022 – 2024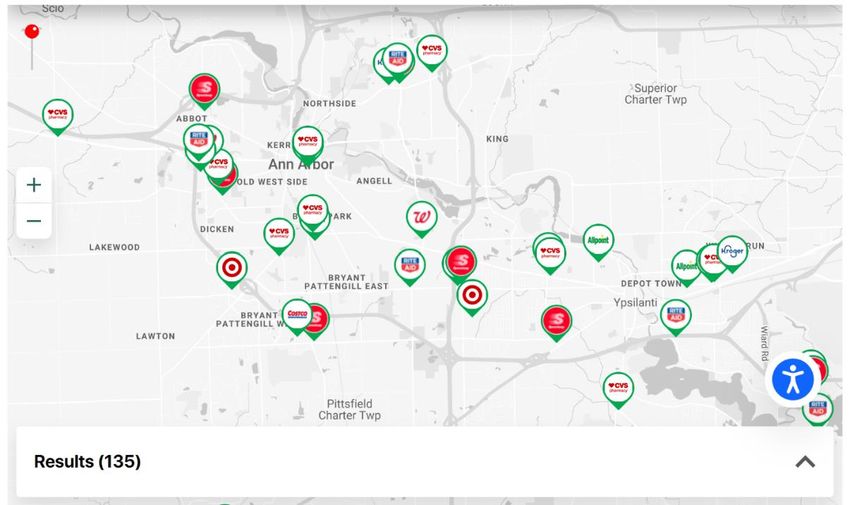
Introduction
The Community Reinvestment Act (“CRA”) regulations provide that a financial institution may
elect to have its CRA performance evaluated under the strategic plan option. The strategic plan
option enables the institution to tailor its CRA goals and objectives to address the needs of its
community consistent with its business strategy, operational focus, and capacity and constraints.
University Bank (“UB” or the “Bank”) has elected to establish a strategic plan with a 3-year
term, effective January 1, 2022, and will have its CRA performance evaluated under this plan. It
is the belief of the Bank that the plan will provide an accurate indication of the Bank’s success in
meeting the credit needs of its assessment areas. The use of a strategic plan will permit the Bank
to emphasize community development lending, investments, and services necessary to meet the
credit needs of its assessment areas, while providing an evaluation method that measures the
Bank’s success in these areas without being negatively skewed by the Bank’s nationwide
mortgage lending program and related nationwide or regional business activities that exceed the
scope of activities normally contemplated in the CRA.

Purpose of the Community Reinvestment Act
The CRA is intended to encourage depository institutions to help meet the credit needs of the
communities in which they operate, including low- and moderate-income neighborhoods,
consistent with safe and sound operations. It was enacted by the Congress in 1977 (12 U.S.C.
2901) and is implemented by Regulation BB (12 CFR 228). The regulation was substantially
revised in May 1995 and updated again in August 2005.

The CRA requires that each depository institution's record in helping meet the credit needs of its
entire community be evaluated by the appropriate Federal financial supervisory agency
periodically. Members of the public may submit comments on a bank's performance. Comments
will be taken into consideration during the next CRA examination. A bank's CRA performance
record is taken into account in considering an institution's application for deposit facilities.

Intended Use of the Strategic Plan
This Strategic Plan outlines the means by which University Bank will achieve compliance with
the requirements of the CRA via a combination of targeted lending, investment, donation, and
service hour activity commensurate with the Bank’s share of local deposits within its defined
assessment area of Washtenaw County, Michigan. The Plan will provide a brief analysis of the
market environment and competitive factors within the assessment area, the Bank’s core
business operations, and the Bank’s plans and goals for demonstrating comprehensive
compliance with the CRA.

                                           Page 2 of 42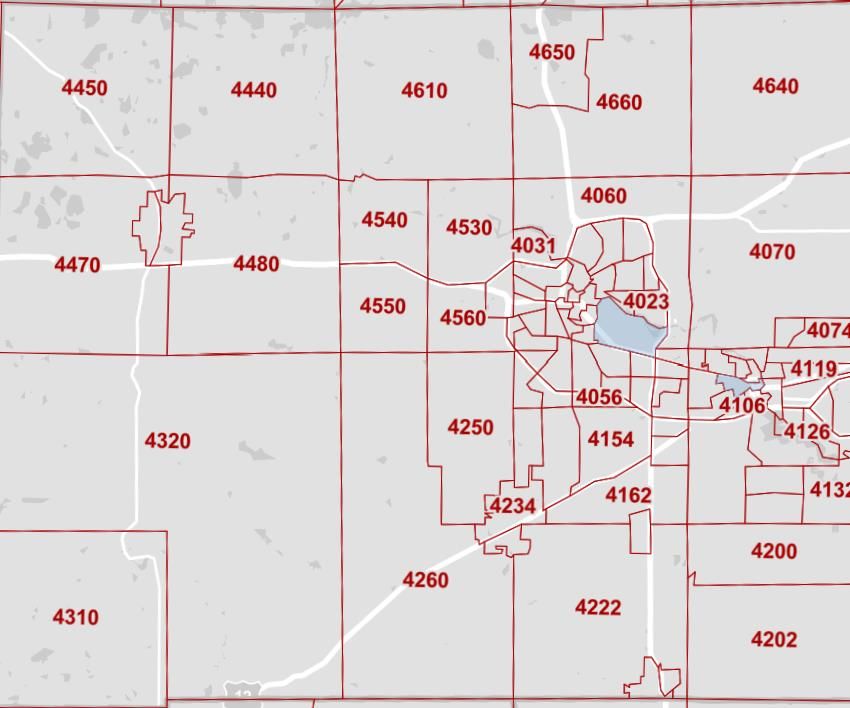
Table of Contents

Institution Background & Profile.................................................................................................... 4
  Bank Profile................................................................................................................................. 4
   Branch & ATM Network ............................................................................................................ 5
   Loan Portfolio Composition ........................................................................................................ 7
Assessment Area Analysis & Performance Context ....................................................................... 9
 General Demographics ................................................................................................................ 9
   Housing Demographics ............................................................................................................. 12
   Industry and Employment Demographics ................................................................................. 12
Historic Lending Performance Analysis ....................................................................................... 14
  Loan Distribution by Borrower’s Profile .................................................................................. 14
   Geographic Distribution of HMDA Loans................................................................................ 15
   Geographic Distribution of Small Business Loans ................................................................... 16
   Innovative or Flexible Lending Products .................................................................................. 18
Historic Community Development Analysis ................................................................................ 21
  Community Development Lending ........................................................................................... 21
   Community Development Investments & Donations ............................................................... 21
   Community Development Service Hours ................................................................................. 22
Community Needs Interviews....................................................................................................... 24
 Overview and Methodology ...................................................................................................... 24
   Community Contacts ................................................................................................................. 24
   Summary of Interview Results .................................................................................................. 25
Plan Overview and Methodology ................................................................................................. 26
  Overview and Rationale ............................................................................................................ 26
   Methodology ............................................................................................................................. 27
   Goal Attainment ........................................................................................................................ 27
   Plan Changes and Contingencies .............................................................................................. 29
   Alternative Evaluation............................................................................................................... 29
Plan Performance Goals ................................................................................................................ 30
  Performance Goal 1: HMDA Lending to LMI Borrowers ........................................................ 30
   Performance Goal 2: HMDA Lending in LMI Geographies .................................................... 32
   Performance Goal 3: Small Business Lending .......................................................................... 34
   Performance Goal 4: Community Development Loans ............................................................ 36
   Performance Goal 5: Community Development Investments................................................... 38
   Performance Goal 6: Community Development Donations ..................................................... 39
   Performance Goal 7: Community Development Service Hours ............................................... 40
                                                               Page 3 of 42
Institution Background & Profile

Bank Profile
University Bank (UB) is a community bank headquartered in Ann Arbor, Michigan, and wholly-
owned by University Bancorp, Inc., a one-bank holding company also located in Ann Arbor,
Michigan. The bank operates in Washtenaw County in southeastern Michigan. UB received a
Satisfactory rating at its previous CRA Performance Evaluation dated June 21, 2021.
One full-service branch operates within the main office, in an upper-income census tract. UB
opened a Loan Production Office (LPO) in 2021 in a middle-income census tract in Ypsilanti,
Michigan. UB offers various deposit products and mortgage, commercial, and consumer loans.
.

Bank Operations
University Bank principally operates from its main facility in Ann Arbor, Michigan located at
2015 Washtenaw Avenue and the Ypsilanti LPO located at 301 W. Michigan Avenue. In
addition, the Bank maintains two non-deposit taking administrative facilities: 2755 Carpenter
Road, Ann Arbor, MI and 29777 Telegraph Road, Southfield, MI. These administrative facilities
house staff engaged in shared backroom services for the Bank and its divisions and operating
subsidiaries. These shared services include Human Resources, Deposit Operations and
Compliance, Accounting and Finance, as well as Secondary and Capital Markets.

Principal lines of business for University Bank involve traditional lending activities, principally
focused on residential lending within the Bank’s market area, as evidenced by the concentration
of 1-4 Family residential real estate loans in the bank’s portfolio (totaling 76.3% of the loan
portfolio as of December 31, 2020). As noted, in addition to in-house residential lending
activities, University Bank also owns a controlling interest in subsidiary entities engaged in
robust mortgage origination activities, which are principally focused on origination of mortgages
eligible for sale on the secondary mortgage market. These subsidiary entities include University
Lending Group and UIF Corporation, which are both characterized as affiliates for CRA
purposes, as further detailed below. Finally, the bank also lends in other areas, such as
commercial real estate (15.1% of the loan portfolio); however, these activities are secondary
lines of business in contrast to the bank’s residential real estate lending activities.

The following UB subsidiaries engage in significant lending activity.

The Bank’s Midwest Loan Services, a subsidiary of UB until 2016, is now a division of the bank
and provides loan servicing and subservicing for financial institutions across the county. This
division is a provider of mortgage sub-servicing to over 390 clients, mainly comprised of credit
unions, and some banks and mortgage companies. Over 50 percent of the credit unions that the
company serves are designated as low-income credit unions. To qualify as a low-income credit
union, a majority of the credit union’s membership (50.01 percent) must meet certain low-
income thresholds, based on data from the Census Bureau and requirements outlined in the
NCUA’s Rules and Regulations.

Additionally, the Bank has two subsidiaries, University Lending Group, LLC (ULG) and UIF
Corporation (UIF) which are primarily engaged in originating home mortgage loans. ULG is

                                           Page 4 of 42
primarily a conventional retail lender and originates loans under most government supported
programs such as FHA, VA, RD and other State bond programs that support first home buyers
and others. UIF provides non-traditional faith-based home financing products to clients with
religious beliefs that prohibit them from engaging in “interest-based” lending programs.
University’s subsidiaries have a combined 24 Loan Production Offices (LPOs) located in 10
States which include Michigan, Florida, New Jersey, Illinois, Virginia, Texas, Washington,
California, and Tennessee.
In general, and as further reflected in this self-assessment, the community bank business unit
comprises a relatively small subset of the operations of University Bank. This department
includes approximately 23 full- and part-time staff, contributes less than three percent (3.0%) of
the Bank’s deposits by dollar volume, and less than twenty (20%) percent of the loan portfolio
by dollar volume.
Branch & ATM Network
The present structure of the Bank’s branch network is detailed in the matrix below (information
provided as of December 31, 2020)
Branch CT
Branch / ATM Location County
Income Level
Full Service Branch Locations
2015 Washtenaw Avenue
Ann Arbor Washtenaw Upper
Ann Arbor, Michigan 48104
Other Locations
301 Michigan Avenue
Ypsilanti LPO Washtenaw Middle
Ypsilanti, Michigan 48197
Automated Teller Machines
Bear Claw 2460 Washtenaw Avenue
Washtenaw Upper
(Depository ATM) Ann Arbor, MI 48104
300 S State Street
Pot Belly Washtenaw Unknown
Ann Arbor, MI 48104
Ypsilanti 301 Michigan Avenue
Washtenaw Middle
(Depository ATM) Ypsilanti, Michigan 48197
A map of the assessment area of Washtenaw County, which is also the sole county in the Ann
Arbor Metropolitan Statistical Area (MSA), is detailed below (census tracts with a branch
location or LPO are highlighted):
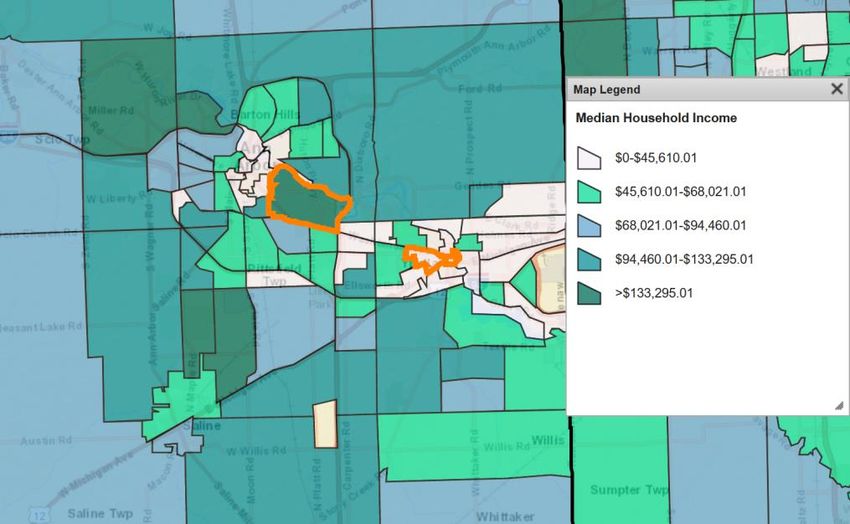
Page 5 of 42The following map also details a portion of the assessment area with the same tracts as
referenced in the map above also highlighted; however, the map also depicts estimated median
household income projections for the immediate locality of the branch and LPO locations (2019
ACS projections developed by HUD).
In addition to the present network of branch locations and loan production offices, University
Bank also maintains an extensive network of automated teller machines (ATMs) throughout
Page 6 of 42Washtenaw County for use by bank customers and other consumers present within the
communities of the region. This network is comprised of both on-site and other bank-owned and
administered ATMs as well as ATMs in the Allpoint ATM network, which provide free services
to University Bank customers. A map to illustrate the coverage of this network, including 3rd
party ATMs, is provided below. Based upon the results of a search based upon Washtenaw
County, the Allpoint ATM locator service indicates there are 135 ATMs within the county,
which appear to be reasonable dispersed and available to consumers within the designated
assessment area.
Loan Portfolio Composition
According to the Call Report dated March 31, 2021, the institution reported total assets of
approximately $658.5 million, total loans of $304.9 million, total deposits of $538.1 million, and
total securities of $3.0 million. UB experienced significant growth within all balance sheet
categories since the prior evaluation, when total assets were $127.0 million and total loans were
$91.6 million. During the evaluation period, total assets increased by 418.5 percent and total
loans increased by 232.9 percent. The institution’s strong growth includes significant increases in
the volume of mortgages originated and sold on the secondary market, while retaining servicing.
UB also has a significant level of zero-interest deposits. The following table illustrates the loan
portfolio distribution as of March 31, 2021. For illustrative purposes, the 2021 CRA examination
considered the following portfolio:
Loan Portfolio Distribution as of 03/31/2021
Loan Category $(000s) %
Construction, Land Development, and Other Land Loans 9,208 3.0
Secured by Farmland 0 0.0
Secured by 1-4 Family Residential Properties 221,701 72.7
Secured by Multifamily (5 or more) Residential Properties 661 0.2
Page 7 of 42Secured by Nonfarm Nonresidential Properties 46,455 15.2
Total Real Estate Loans 278,025 91.1
Commercial and Industrial Loans 17,465 5.7
Agricultural Production and Other Loans to Farmers 0 0.0
Consumer Loans 174 0.1
Obligations of State and Political Subdivisions in the U.S. 0 0.0
Other Loans 9,274 3.0
Lease Financing Receivable (net of unearned income) 0 0.0
Less: Unearned Income 0 0.0
Total Loans 304,938 100.0
Source: Reports of Condition and Income 03/31/2021. Due to rounding, may not equal 100.0%
REST OF PAGE LEFT INTENTIONALLY BLANK
Page 8 of 42Assessment Area Analysis & Performance Context
General Demographics
University Bank has delineated one distinct assessment area for purposes of examination under
the requirements of the CRA. This assessment area is comprised of Washtenaw County,
Michigan, which solely comprises the entirety of the Ann Arbor Metropolitan Statistical Area
(MSA). Within this county, University Bank has designated all census tracts as its assessment
area. This assessment area, with a population of 354,092, is located in southeast Michigan
southwest of Detroit, Michigan, the largest major metropolitan area in the State of Michigan. The
bank’s main office is located in Ann Arbor, Michigan, which is the county seat of Washtenaw
County and has a population of 113,934 as of the 2010 census. Washtenaw County is the home
of the main campus of the University of Michigan and its wholly owned academic medical
center Michigan Medicine, as well as Eastern Michigan University and Washtenaw Community
College. In addition to medical and educational institutions, the city features a mixed industry of
retail, industrial, service-oriented businesses, and non-profits, including another large hospital, as
well as other governmental services. Based on information from Crain Communications, a
Detroit-based publisher, the following entities are the largest reported employers in Washtenaw
County:
Largest Employers - Washtenaw County
with greater than 1,000 employees
# of
Employer Employees
University of Michigan 33,225
Trinity Health 7,435
United States Federal government 3,060
Ann Arbor Public Schools 2,225
Faurecia North America 2,178
Eastern Michigan University 1,559
IHA Health Services 1,442
State of Michigan 1,409
Washtenaw County 1,264
Thomson Reuters 1,155
TOTAL 54,952
Banking competition is heavy in the assessment area, with 18 Federal Deposit Insurance
Corporation (FDIC)-insured depository institutions maintaining 84 offices throughout the
designated assessment area. According to the FDIC Deposit Market Share Report, as of June 30,
2021, the bank ranked 8th in terms of deposit market share, encompassing 4.66 percent of the
total assessment area deposit dollars totaling $583,845M. It should also be noted that the
Assessment Area includes a very high number of large, national or regional depository
institutions with significant market profile in the assessment area, with only one locally operated
community bank in competition with University Bank in the city of Ann Arbor (Bank of Ann
Arbor) and only one other locally operated community bank elsewhere in Washtenaw County
Page 9 of 42(Chelsea State Bank). Other competitors with greater share in the deposit market ranged in size
from $83.3B in total deposits to $3,190B and with total domestic offices (on a nationwide basis)
from 421 to 4,916 offices.
Deposit Market Share - as of June
Metropolitan Statistical Area – ANN ARBOR, MI
# of
State Offices in Deposits Market
Institution Headquartered Market ($000s) Share %
JP Morgan Chase Bank, NA OH 9 2,444,010 19.51%
Bank of Ann Arbor MI 6 1,731,107 13.82%
Keybank National Association OH 8 1,525,548 12.18%
The Huntington National Bank OH 16 1,439,117 11.49%
PNC Bank, NA DE 9 1,176,804 9.39%
Comerica Bank TX 9 1,000,070 7.98%
Bank of America, NA NC 3 888,455 7.09%
University Bank MI 1 583,845 4.66%
Old National Bank IN 4 445,050 3.55%
Chelsea State Bank MI 3 366,148 2.92%
Fifth Third Bank OH 3 335,916 2.68%
Flagstar Bank MI 5 255,978 2.04%
Northstar Bank MI 1 111,574 0.89%
Level One Bank MI 3 86,068 0.69%
First Merchants Bank IN 1 62,321 0.50%
Citizens Bank, NA RI 1 58,451 0.47%
Bank Michigan MI 1 15,559 0.12%
Comerica Bank & Trust, NA MI 1 509 0.00%
Number of Institutions in the Market: 18
TOTAL 84 $12,526,531 100%
As a further reflection on the competitiveness within the assessment area it is worth noting that
with respect to the bank’s overall performance context, the deposit volume reported in Deposit
Market Share report summarized above is inclusive of deposits originating from outside the
defined assessment area based upon the Bank’s sub-servicing activities. Deposits originating
solely from the Bank’s community banking activities are detailed below:
Page 10 of 42Community Bank Deposits (Consumer & Commercial)
As of Date: Demand Deposits Savings CD's Total
December 31, 2018 $20,165,757 $442,415 $2,323,770 $22,931,942
December 31, 2019 $13,341,046 $330,732 $1,834,468 $15,506,246
December 31, 20201 $20,650,269 $432,242 $1,561,140 $22,643,651
Economic and Demographic Data
According to the 2015 American Community Survey (ACS) data, there are 100 census tracts
within the bank’s AA with the following income designations: 16 low-income, 16 moderate-
income, 37 middle-income, 25 upper-income, and 6 tracts with no income designation. Low- and
moderate income tracts are mostly in and around the City of Ypsilanti, on the east side of the
county, with a few moderate-income tracts near Ann Arbor. The tracts with no income
designation include Willow Run Airport in Ypsilanti, and tracts in downtown Ann Arbor
comprised of the University of Michigan. The following table illustrates select demographic
information about the AA.
Demographic Information of the Assessment Area
University Bank Assessment Area
Low Moderate Middle Upper NA*
Demographic Characteristics #
% of # % of # % of # % of # % of #
Geographies (Census Tracts) 100 16.0 16.0 37.0 25.0 6.0
Population by Geography 354,092 14.9 12.9 40.2 27.6 4.4
Housing Units by Geography 149,098 15.8 14.1 40.5 27.5 2.0
Owner-Occupied Units by Geography 82,525 6.6 12.0 44.7 36.5 0.2
Occupied Rental Units by Geography 55,542 28.7 17.6 34.3 15.0 4.4
Vacant Units by Geography 11,031 20.0 12.6 41.1 23.1 3.2
Businesses by Geography 28,343 9.0 9.2 42.5 32.5 6.8
Farms by Geography 925 3.5 6.2 56.5 33.4 0.4
Family Distribution by Income Level 79,373 22.7 17.0 19.6 40.7 0.0
Household Distribution by Income
138,067 25.4 15.9 15.8 42.9 0.0
Level
Median Family Income MSA - 11460
$87,331 Median Housing Value $208,543
Ann Arbor, MI MSA
Median Gross Rent $1,001
Families Below Poverty Level 8.0%
Source: 2015 ACS and 2020 D&B Data. Due to rounding, totals may not equal 100.0%
(*) The NA category consists of geographies that have not been assigned an income classification.
The above table reveals that the bank’s combined assessment area is comprised of 16 low-
income census tracts, 26 moderate-income census tracts, 37 middle-income census tracts, and 25
upper-income census tracts (with 6 tracts not rated). The largest portion of the assessment area
1
Deposit totals for 2020 include deposits related to Warehouse Lines (all out of AA).
Page 11 of 42population resides in middle-income census tracts, totaling 40.2% of the assessment area
population.
Based on 2020 census data, the median family income for the Ann Arbor MSA totaled $101,500.
At the same time, the state of Michigan non-MSA median family income was $60,900 based on
the 2020 FFIEC estimated data. The following table summarizes the income ranges for low-,
moderate-, middle-, or upper-income designations based on estimated FFIEC income values for
the MSA for the 2018, 2019, and 2020 reporting years. It should be noted that FFIEC estimated
data are subject to periodic correction based on census and ACS survey results.
Area Estimated Median Family Income Ranges
Dataset Low Moderate Middle Upper Median
Ann Arbor MSA - FFIEC Estimated MFI
$ 46,450 $ 74,320 $ 111,480
2018 $ 46,449 $ 92,900
$ 74,319 $ 111,479
$ 50,600 $ 80,960 $ 121,440
2019 $ 50,599 $ 101,200
$ 80,959 $ 121,439
$ 50,750 $ 81,200 $ 121,800
2020 $ 50,749 $ 101,500
$ 81,199 $ 121,799
Housing Demographics
Based on housing values, income levels, and rental costs, housing in the assessment areas appear
to be less affordable than in the state of Michigan at large. The median housing value for the Ann
Arbor MSA assessment area was $263,600, which is significantly higher than the estimated
median housing value for the State of Michigan of $154,900 based upon 2019 5-year estimated
ACS data. Similarly, the owner-occupied housing unit rate for Washtenaw County also trends
lower than statewide estimates at 61.1% versus 71.2%. Median gross rents from 2019 ACS data
were also significantly greater than gross rents on a statewide basis, totaling $1,114 versus $871.
This differential (~ +28%) is likely attributable not only to the greater area median income, but
also to the large concentration of student housing in the assessment area to support the
University of Michigan and Eastern Michigan University.
Industry and Employment Demographics
The assessment area economy is diverse and is supported by a mixture of education, health care
and social assistance, retail trade, and other service-oriented sectors. According to the U.S.
Census Bureau 2018 County Business Patterns, by number of paid employees in the assessment
area (excluding governmental employment, including the majority of the education sector),
health care and social assistance was the largest source of employment (39,614), followed by
accommodation and food service (18,241), retail trade (17,501), manufacturing (15,656), and
professional, scientific, or technical services (14,592). Total paid employees for all sectors were
reported as 155,894. According to the U.S. Department of Labor, Bureau of Labor Statistics, the
average unemployment rate (not seasonally adjusted) was estimated to be 9.9% during 2020 for
the state of Michigan, which was considerably greater than the projected annual rate for
Washtenaw County for the same period, which was estimated to be 3.6%. Note: Both
unemployment rate projections, but particularly the statewide rate, are projected to be
disproportionately affected by the COVID-19 pandemic event.
Page 12 of 42Conclusions as to Performance Context and Community Needs
As supported by the independent Community Needs Interviews commissioned by the Bank and
further detailed below, a review of the assessment area indicates that wealth inequality and
access to affordable housing remains one of the greatest challenges in the assessment area. As
indicated by the Bank’s CRA Self-Assessment completed in June 2021, the assessment area is a
competitive banking market with eighteen (18) institutions reported in the most recent FDIC
Deposit Market Share report and many more participating in the assessment area through direct
and indirect lending activity. Access to credit for commercial enterprises is determined to be
generally good based on the number and portfolio composition of these peer institutions;
however, access to affordable housing, particular for low-to-moderate income persons is a
significant ongoing challenge. Significant variances in tract level income ratings and individual
tract median incomes further reveal challenges in income and wealth inequality in the area.
Recent ACS data also indicated that gross rents were up to 28% higher than state averages within
the assessment area. Although reinforced strongly by the results of the Community Needs
Interviews, an independent analysis of the assessment area supports the conclusion that access to
and support for affordable housing is the most impactful focus area for the Bank’s CRA efforts
and initiatives.
REST OF PAGE LEFT INTENTIONALLY BLANK
Page 13 of 42Historic Lending Performance Analysis
Loan Distribution by Borrower’s Profile
Borrowers are classified into low-, moderate-, middle-, and upper-income categories by
comparing their reported income on the HMDA Loan Application Register (LAR) for University
Bank and the Bank’s affiliates University Lending Group (LEI: 549300DZCP6EQ7DCSD79)
and UIF, LLC (LEI: 549300BXWU32AYWT1A56) to the applicable median family income
figure applicable to the geography of the applicant, as detailed in the Income and Wealth
Demographics section of this assessment above. All activity detailed below was originated in the
Washtenaw County assessment area during the applicable reporting year. The following tables
show the distribution of HMDA loans by borrower income level on the basis of the nominal
number of loans originated (count) and dollar volume. Additional aggregate analysis and peer
information is provided in the Peer Analysis and Conclusions section of this self-assessment
below.
Ann Arbor Assessment Area:
The following tables are provided for the Washtenaw County/ Ann Arbor MSA assessment area
(as defined in the Assessment Area Analysis section above).
Distribution of Home Mortgage Loans by Borrower Income Level
University Bank Assessment Area
Aggregate
Borrower % of
Performance # % $(000s) %
Income Level Families
% of #
Low
2019 22.7 10.2 26 8.2 3,303 4.0
2020 22.7 -- 81 8.9 11,913 5.0
Moderate
2019 17.0 21.0 78 24.5 16,005 19.3
2020 17.0 -- 199 21.9 39,799 16.7
Middle
2019 19.6 24.1 92 28.8 21,543 26.0
2020 19.6 -- 250 27.6 65,231 27.4
Upper
2019 40.7 36.0 111 34.8 38,206 46.1
2020 40.7 -- 357 39.4 116,009 48.7
Not Available
2019 0.0 8.8 12 3.8 3,734 4.5
2020 0.0 -- 20 2.2 5,106 2.1
Totals
2019 100.0 100.0 319 100.0 82,791 100.0
2020 100.0 -- 907 100.0 238,058 100.0
Source: 2015 ACS; Bank Data, 2019 HMDA Aggregate Data, "--" data not available. Due to rounding, totals may not equal
100.0%
Page 14 of 42Geographic Distribution of HMDA Loans
As noted in the description of the Bank’s assessment area above, the assessment area is
comprised of 100 census tracts consisting of 16 low-income tracts, 16 moderate-income tracts,
37 middle-income tracts, 25 upper-income tracts, and 6 unrated tracts. The analysis in this
section illustrates the distribution of the Bank’s loan activity, as well as activity from its CRA
affiliates, across these geographies. The following tables display the geographic distribution of
HMDA loans within the assessment areas.
Washtenaw County Assessment Area:
The following tables are provided for the Washtenaw County/ Ann Arbor MSA assessment area
(as defined in the Assessment Area Analysis section above)
Geographic Distribution of Home Mortgage Loans
University Bank Assessment Area
% of Owner- Aggregate
Tract Income Level Occupied Performance # % $(000s) %
Housing Units % of #
Low
2019 6.6 6.5 25 7.8 4,367 5.3
2020 6.6 -- 56 6.2 9,986 4.2
Moderate
2019 12.0 12.0 48 15.0 9,248 11.2
2020 12.0 -- 102 11.2 19,784 8.3
Middle
2019 44.7 46.0 134 42.0 33,474 40.4
2020 44.7 -- 373 41.1 91,277 38.3
Upper
2019 36.5 35.2 112 35.1 35,702 43.1
2020 36.5 -- 374 41.2 116,323 48.9
Not Available
2019 0.2 0.3 0 0.0 0 0.0
2020 0.2 -- 2 0.2 688 0.3
Totals
2019 100.0 100.0 319 100.0 82,791 100.0
2020 100.0 -- 907 100.0 238,058 100.0
Source: 2015 ACS; Bank Data, 2019 HMDA Aggregate Data, "--" data not available. Due to rounding, totals may not equal 100.0%
Page 15 of 42Geographic Distribution of Small Business Loans
As noted in the description of the Bank’s assessment area above, the assessment area is
comprised of 100 census tracts consisting of 16 low-income tracts, 16 moderate-income tracts,
37 middle-income tracts, 25 upper-income tracts, and 6 unrated tracts. The following tables
display the geographic distribution of small business loans within the assessment area.
Geographic Distribution of Small Business Loans
University Bank Assessment Area
Tract Income Level % of Businesses # % $(000s) %
Low
2019 8.9 0 0.0 0 0.0
2020 9.0 4 4.7 161 2.1
Moderate
2019 9.2 0 0.0 0 0.0
2020 9.2 5 5.9 372 5.0
Middle
2019 42.7 4 40.0 1,116 50.6
2020 42.5 37 43.5 1,992 26.5
Upper
2019 32.0 6 60.0 1,088 49.4
2020 32.5 36 42.4 4,584 61.0
Not Available
2019 7.2 0 0.0 0 0.0
2020 6.8 3 3.5 406 5.4
Totals
2019 100.0 10 100.0 2,204 100.0
2020 100.0 85 100.0 7,515 100.0
Source: 2019 & 2020 D&B Data; Bank Data; "--" data not available. Due to rounding, totals may not equal 100.0%
The following table describes lending to small businesses based on the income category of the
business.
Distribution of Small Business Loans by Gross Annual Revenue Category
University Bank Assessment Area
Gross Revenue Level % of Businesses # % $(000s) %>$1,000,000
2019 5.9 0 0.0 0 0.0
2020 5.2 1 1.2 250 3.3
Revenue Not Available
2019 10.8 0 0.0 0 0.0
2020 9.6 75 88.2 5,176 68.9
Totals
2019 100.0 10 100.0 2,204 100.0
2020 100.0 85 100.0 7,515 100.0
Source: 2019 & 2020 D&B Data; Bank Data; "--" data not available.
Due to rounding, totals may not equal 100.0%
REST OF PAGE LEFT INTENTIONALLY BLANK
Page 17 of 42Innovative or Flexible Lending Products
University Bank originates consumer and commercial loans and provides funding for its two
subsidiaries, University Lending Group, LCC (ULG) and UIF Corporation (UIF) to originate
mortgages within its assessment area and other states and localities where those subsidiaries are
licensed. The HMDA analysis detailed above is inclusive of the production activity of these
subsidiaries within the Bank’s defined assessment area.
The Bank also makes SBA Loans to businesses and has made the following number of SBA
loans, exclusive of lending under the Payroll Protection Program (PPP):
SBA Lending (Through March 31, 2021)
Year 2021 2020 2019 Total
# of Loans 2 4 1 7
$ of Loans $575,000 $390,000 $571,500 $1,536,500
The Bank also offers Business Manager Lines of Credit. This program allows small to mid-size
business, who may not qualify for a traditional operating line of credit secured by accounts
receivable, to bridge the gap between payables due to suppliers today and receivables that their
customers won’t remit for 30 days or more. BusinessManager® enables these small businesses to
get cash for their accounts receivables deposited directly into their bank account by selling them
to University Bank at a discount. Currently the Bank has 5 of these Lines of Credit with potential
capacity of $2.2 Million on a cumulative basis.
University Lending Group (ULG) participates in a number of specialized lending programs
including VA, FSA (USDA), and FHA. These programs are generally targeted to under-served
borrowers that may not meet the income qualification requirements for conventional secondary
market programs. ULG made the following numbers of loans under these programs:
Number of Loans Originated per
Program
Year (Nationwide)
Type 2020 2019
VA 1099 574
FHA 642 498
FSA 185 152
Number of Loans Originated per
Year (Washtenaw Co. - Ann Arbor
MSA)
VA 18 7
FHA 29 8
FSA 7 3
Page 18 of 42In addition, ULG offers Freddie Mac’s (FHLMC) Home Possible and Fannie Mae’s (FNMA)
Home Ready products that target LMI populations. ULG made the following number of loans in
these programs combined:
Year 2020 2019
# of Loans Originated 241 234
$ of Loans Originated $40,935,186 $39,100,335
ULG also offers loans under numerous State Housing programs. Most notably in our Michigan
Market, ULG offers MSHDA’s programs that target LMI borrowers. Below is a summary of the
loans originated under these programs:
Year 2020 2019
# MSHDA (MI) 61 43
$ MSHDA (MI) $7,519,544 $4,893,371
# Out-of-state 53 81
$ Out-of-state $8,283,902 $10,917,544
Finally, ULG also instituted a special portfolio loan program (held in the University Bank
portfolio) for the Washtenaw County Habitat for Humanity (Habitat). Special criteria are used in
qualifying Habitat’s approved home buyers, enabling these LMI borrowers to purchase a primary
residence. As of April 7, 2021, we have originated 5 loans under this program and remain an
approved partner for Habitat.
UIF, Corporation (UIF) offers faith-based products, which are uniquely designed for clients who,
due to their religious beliefs, avoid the payment of interest and are therefore not willing to
participate in conventional loans of any type. Based on the target market served by UIF, a large
proportion of UIF borrowers are religious and racial minorities that have been traditionally
underserved by the domestic banking system in the United States. All UIF home mortgages are
“specialty products,” but UIF does offer home financing products that are designed for first time
home buyers and/or creditworthy low-to-moderate income borrowers with expanded eligibility
for financing homes in low-income, minority, and disaster impacted communities.
In addition, UIF offers Freddie Mac’s Home Possible and Fannie Mae’s Home Ready products
that target LMI populations. UIF made the following number of loans in these programs
combined:
Year 2020 2019
# of Loans Originated 335 320
$ of Loans Originated $73,322,201 $66,936,063
UIF also offers some commercial financing products that are secured by real estate and that
adhere to same principles with respect to being configured to accommodate the faith-based needs
of minority groups. Those products are attractive to commercial businesses owned by individuals
who wish to avoid the payment of interest for religious reasons and faith-based non-profit
Page 19 of 42organizations and that have comparatively less access to affordable credit in contrast to other
persons that do not share the same religious beliefs.
Page 20 of 42Historic Community Development Analysis
Community Development Lending
University Bank originated or renewed a total of 25 community development loans within its
assessment area totaling $2,657,729 in dollar volume between January 1, 2018 and March 31,
2021. The number and dollar volume of these loans is summarized in the table below:
Community Development Loans - Inside AA: 2019 - 2021
Dataset 2019 2020 2021 Total
Community Development 3 13 8 25
Loans 1,166,625 971,425 369,679 2,657,729
In addition to the loans above, the Bank also originated the following community development
loans (via the SBA’s payroll protection program) that are outside the defined assessment area,
but were made to qualifying businesses located in low-to-moderate census tracts in adjoining
localities in Michigan, which assists in stabilizing employment and business productivity within
the wider region:
Community Development Loans - Outside AA: 2019 - 2021
Dataset 2019 2020 2021 Total
0 2 8 10
Community Development Loans
0 15,500 607,554 623,054
Below are notable narratives of the Bank’s community development lending activities within
these performance years:
• During the assessment period, the Bank originated two PPP loans and renewed a line of
credit on two occasions for Foundations Preschool of Washtenaw County, a childcare and
early childhood development center principally serving low-to-moderate income families
in Washtenaw County. The total balance of all loans originated or renewed was $806,200
between 2018 and 2021 year-to-date.
• During 2020 and year-to-date 2021, the Bank originated 18 loans totaling $789,979 in
dollar volume to businesses or other qualifying entities located in low- or moderate-
income census tracts in Washtenaw County through the SBA’s PPP program. These loans
fulfilled critical needs in the community through allowing these businesses to retain
employees and continue business operations during the Covid-19 pandemic event.
Community Development Investments & Donations
University Bank reported no securities in qualifying community development investments for the
2019 - 2021 performance years (year to date). In addition, the Bank reported 10 qualifying
Page 21 of 42donations totaling $108,857 for the 2019 through year-to-date 2021 reporting years. The
following table summarizes this information:
Community Development Donations & Investments
Dataset 2019 - 2021
10 donations
Donations
108,857 dollars
Dataset 2019 - 2021
2 securities
Investments
3,125,146 dollars
Donation activity includes multiple investments in the Habitat for Humanity of Huron Valley, a
non-profit organization focused on improving accessibility to affordable housing for low-income
persons located in Washtenaw County, Michigan.
Community Development Service Hours
University Bank recorded 321 community development service hours between 8 distinct
functions during the 2019 through 2021 year to date performance years.
Community Development Service Hours: 2019 - 2021
Dataset 2019 - 21 Total
5 functions 5
Service Hours
321 hours 321
Below are three notable narratives of the Bank’s service hour activities for the 2019 through
2021 performance period:
• University Bank provides Individual Development Accounts to participants of the
Michigan Youth Opportunities Initiative which helps children in foster care prepare for
the time they age out of the foster care program. In conjunction with that organization,
the Bank delivers training to the at-risk youth. For example, the Branch Manager and
another Community Banker, using the FDIC’s Money Smart Program, presented a
workshop for 12 individuals covering budgeting and saving. Additional workshops have
been held with some regularity on similar topics to these at-risk youth participants.
• University Bank also seeks opportunities to reach out to small business owners,
particularly those persons interested in starting or operating businesses in low- or
moderate-income areas or that operate business to fulfill deficiencies in community
service needs. In March of 2019, the Community Bank Director presented at a workshop
sponsored by the Small Business Development Center of Washtenaw County and focused
on the necessary elements of a business plan from the viewpoint of a lending institution.
This program was attended by 12 people interested in learning how to develop a
Page 22 of 42documented business plan that would potentially lead to the being successful at acquiring
bank funding for a new or growing small business.
REST OF PAGE LEFT INTENTIONALLY BLANK
Page 23 of 42Community Needs Interviews
In the course of development of this CRA Strategic Plan, University Bank engaged independent
consultant Kim Kuhle of Omaha, Nebraska to perform a series of verbal interviews of
community contacts with business and community leaders in the Washtenaw County Assessment
Area during August 2020.
Overview and Methodology
Contacts were selected based on input from bank staff and a review of active associations and
not-for-profit entities operating in the assessment area and focused on meeting community needs
considered in the community development context of the CRA. Each identified community
contact was interviewed by the independent consultant to assist in identifying outstanding needs
within the assessment area that may be addressed via this Strategic Plan. Detailed results from
these interviews were included in a summary notation to University Bank and a brief summary
of each contact and the results of this process are detailed below.
Community Contacts
Ann Arbor SPARK – Phil Santer
Ann Arbor SPARK is an economic development organization for the Ann Arbor area with a
focus on helping companies grow, connecting job seekers to new opportunities, and supporting
millions in investments in local businesses.
Economic Development Commission of the City of Ann Arbor – Peter Long
The Economic Development Corporation of the City of Ann Arbor was formed under Michigan's
Economic Development Corporation Act in 1978. Its purpose is to assist in the attraction,
relocation, retention and expansion of profit and non-profit organizations which provide
employment and which are considered desirable and beneficial to the City. It has carried this out
primarily by its issuance of tax-exempt revenue bonds. This has permitted borrowers to realize
substantial savings in financing costs due to the difference between taxable and tax-exempt
interest rates.
Michigan Small Business Development Center – Charlie Penner
The ‘SBDC’ provides business planning and technical support services to emerging businesses in
the Ann Arbor region.
Shelter Association of Washtenaw County – Daniel Kelly, Alisha Lon
The Shelter Association of Washtenaw County provides temporary shelter and connections to
services in a safe and caring environment and works with the community to allocate the
necessary resources to meet the needs of people who are experiencing homelessness. The
Association serves nearly 1,200 adults experiencing homelessness each year.
Page 24 of 42Ann Arbor Housing Commission – Jennifer Hall
Ann Arbor Housing Commission seeks to provide desirable housing and related supportive
services for low-income individuals and families on a transitional and/or permanent basis.
AAHC partners with housing and service providers to build healthy residential communities and
promote an atmosphere of pride and responsibility.
United Way of Washtenaw County – Pamela Smith, Ugbaad Kenyan
The United Way provides funding for nonprofits that, in turn, provide basic social services to
low-and moderate-income people.
Summary of Interview Results
The independent interviews performed by Ms. Kuhle during August 2020 identified access to
affordable housing as the greatest extant need within the Washtenaw County assessment area.
Strong economic performance in the assessment area in recent years and high levels of existing
development have resulted in significantly increasing home prices; a trend which has been
further exacerbated by inflation in home prices and associated housing inputs such as materials
costs. Stocks of affordable housing are limited in the assessment area and new development and
rehabilitation activity has been outpaced by demand for affordable housing supply. A secondary
need identified via the interview process was access to financial education and financial literacy
programs. Respondents indicated that within low-to-moderate income communities, financial
literacy remains low, and many persons are unaware of the programs available from financial
institutions and other entities, indicating that opportunities for expanding outreach programs in
the assessment area exist.
REST OF PAGE INTENTIONALLY LEFT BLANK
Page 25 of 42Plan Overview and Methodology
This CRA Strategic Plan has been established in accordance with the following rationale and
methodology:
Overview and Rationale
Based on the unique business model of University Bank and its affiliated entities detailed above,
the Bank derives a substantial majority of deposits from outside the local assessment area via the
mortgage servicing activities undertaken directly by the Bank or indirectly via affiliated entities.
This business model presents unique challenges with respect to CRA performance as these
deposits are not derived from the consumers, businesses, and other entities living or operating in
the Washtenaw County assessment area, but rather are received from consumers throughout the
nation in connection with mortgage servicing activities such as payment processing and
remittance and escrow account administration. As these deposits are not locally derived through
normal business operations, an imbalance is created between the Bank’s traditional community
banking business activities and those activities corresponding to these nationwide services,
which comprise a substantial majority of the Bank’s business operations and contribute to an
elevated asset size that is not reflective of the Bank’s community banking operations.
Another significant consideration pertains to the nature of the Bank’s deposit sources. Mortgage
subservicing activity is highly cyclical with respect to continuous inflows and outflows of cash
deposits. Large transactional inflows derived from refinancing or home sales events occur
unevenly throughout the year, as do new home purchase transactions and corresponding
increases in servicing activities. Other events, such as payments of property taxes for
administered escrow accounts, also tend to be disproportionately concentrated in specific months
of a given year. Coupled with the cycle of remittances of received payments or mortgage payoffs
to the underlying investors that own mortgage-backed securities, the Bank routinely experiences
significant variations in cash deposits throughout a given year, creating a fluctuating deposit base
that cannot be utilized in the same proportion for direct lending activities in contrast to deposit
sources that traditionally comprise the majority of deposit portfolios among the Bank’s
assessment area peers. In addition, monthly deposit flows are significant, with month-end cash
deposits significantly higher than the monthly average.
Based on these considerations, this Strategic Plan will formulate goals based upon perceived
community needs, historic bank performance, and peer performance. In order to formulate
objective performance goals, we have determined that the most reasonable metric available to
establish annual goals will utilize historical annual average assets2 of the of the Bank for the
prior performance year as this value accommodates the anticipated changes in portfolio volumes
discussed above. Individual goals will generally be established based upon a percentage of this
value. These percentages will be developed based on a number of factors, including: (1) historic
2
As further defined in the Glossary, this value will be calculated after submission of the December CALL report
and will be utilized for calculating the next performance period’s targets. For example, average total assets
calculated after submission of the December 2021 CALL report will be utilized for 2022 performance goals, which
will generally be defined as achieving a given percentage of this average total asset value during the 2022
performance year.
Page 26 of 42performance of the Bank, (2) peer performance, (3) apparent community needs, (4) projected
capacity of the Bank to meet the performance goal based on current business activities and
market conditions.
Methodology
For each Plan Year, the Bank will be assessed in its Assessment Area based on seven measurable
goals: Lending to LMI Borrowers for HMDA-reportable transactions, Lending to LMI
Geographies for HMDA-reportable transactions, Lending to Small Businesses with gross annual
revenues less than $1MM, CRA-eligible lending meeting the ‘community development’
definition, Investments meeting the ‘community development’ definition, Donations meeting the
‘community development’ definition, and Services / Service Hours meeting the ‘community
development’ definition. These measurable goals will be combined in the methods detailed
below to ultimately determine the Bank’s CRA Exam rating. Performance for University Bank as
well as any eligible affiliated entities will be considered when evaluating performance in the
defined Assessment Area, which is comprised of the entirety of Washtenaw County, Michigan.
Measurable Goals
With respect to each plan goal detailed below, performance targets will be established at the
beginning of each Plan Year using the average assets from the end of the previous year as a
performance guide. To provide continuity and certainty as to performance expectations, goals
will not experience intra-cycle changes, with the exception of any adjustments based upon
significant and material changes in macroeconomic conditions that are likely to cause substantial
impairment to this Plan. Plan goals will be displayed for the baseline ‘Satisfactory’ rating as well
as the ‘Outstanding’ rating, although individual ratings for plan goals will be dependent on the
relative percentage to which that goal was achieved (e.g. achieving 110% of the baseline goal
will result in a ‘High Satisfactory’ rating as further detailed below).
Goal Attainment
When assessing attainment of performance goals, goals will be deemed to be satisfied in the
event the targeted percentage of average assets or other quantitative goal is met or exceeded. As
noted above, Performance goals will include activity from Bank affiliates occurring within the
defined Assessment Area. The Bank’s CRA Eligible Lending, CD Investment and CD Services
Performance Goals will be measured using a points system. The following chart lays out the
scoring system for the CRA performance activity. It assigns points based on the percentage of
Plan Goal achieved multiplied by the tier point multipliers. Tier levels are utilized in the plan to
provide a mechanism to ‘weight’ different plan goals based upon the importance of the goal
relative to community needs and the degree to which the goal complements the Bank’s business
model, enhancing the capacity of the Bank to demonstrate strong performance in that area.
Page 27 of 42Points Matrix
Base
Ratings Value Definition
Outstanding 12 120% of PG*
High Satisfactory 9 110% of PG
Satisfactory 6 100% of PG3
Low Satisfactory 4 90% of PG
Needs to Improve 2 80% of PG
Substantial Noncompliance 0 < 80% of PG
*PG = Plan Goal
As discussed above, the base points assigned for each rating is multiplied by the tier ranking
assigned to each plan goal. For example, a ‘Tier 1’ plan goal will have a point range of 0 – 24
points based on the 2.0x multiplier applied to that goal.
Goal Level: Point Multipliers
Tier 1 2.0
Tier 2 1.5
Tier 3 1.0
The following table summarizes the total points from all defined plan goals needed to achieve a
given rating. Total points represent the aggregate total from all plan goals calculated using the
methodology discussed above, which is inclusive of goal Tier Levels and associated multipliers.
As noted in this table, the ‘Satisfactory’ rating is subdivided into several sub-categories to
provide greater delineation of the Bank’s performance and to better align with existing
regulatory methodologies for grading CRA performance.
Overall Rating - Required Goal Scores
Ratings Total Pts to Earn
Outstanding 110
Satisfactory
High Satisfactory 88
Satisfactory 66
Low Satisfactory 44
Needs to Improve 22
Substantial Noncompliance < 22
3
100% of the Plan Goal represents the baseline scenario for performance. Actual performance falling under this
baseline will receive a lesser rating, while performance sufficiently in excess of this threshold will receive a higher
rating.
Page 28 of 42Plan Changes and Contingencies
The Strategic Plan will operate based on an initial three-year plan cycle. This cycle may in future
be amended based on the strategic needs of the Bank. As discussed above, plan performance
goals are to be established and take effect at the beginning of each new plan cycle based on
conditions immediately preceding the commencement of the new plan cycle. Performance goals
will be based upon static dollar volume or other quantitative targets for each given cycle and
represented as a percentage of average assets or other reasonable quantitative driver suitable to
the character of the plan goal (e.g. employee count for service hour goals).
Due to the nature of the Bank’s mortgage-focused business model, prevailing macroeconomic
conditions, including the interest rate policy pursued by the Federal Reserve Bank, have a
significant impact upon the volumes of the Bank’s secondary market mortgage origination and
subservicing subsidiaries. As experienced during and in the aftermath of the 2008 Financial
Crisis and the 2020 Pandemic, economic crises or other comparable disruptions can result in
material changes in market conditions that may preclude the achievement of the plan goals
established and believed to be reasonably achievable at the onset of a given plan cycle. In the
event that market conditions substantially impact the capacity of the Bank to achieve stated
goals, the Bank will proactively work with the Federal Deposit Insurance Corporation to amend
the Plan as needed in order to ensure that goals are reasonably achievable based on current
conditions.
Alternative Evaluation
If University Bank fails to meet the strategic plan goals outlined below for a “Satisfactory”
rating, the Bank elects to be evaluated under the Intermediate Small Bank examination
methodology.
REST OF PAGE INTENTIONALLY LEFT BLANK
Page 29 of 42Plan Performance Goals
The following performance goals have been defined based on the performance context,
assessment area profile, historic performance of the Bank, and outstanding credit needs of the
community in the defined assessment area.
Performance Goal 1: HMDA Lending to LMI Borrowers
Goal Summary: The Bank expects to achieve its CRA-eligible lending measurable goals
through the origination and/or purchase of HMDA loans originated in the
Ann Arbor, MI assessment area, with a percentage of average assets going
to low- or moderate-income individuals based on borrower income levels.
Goal Targets: Based on our projected asset size and financial situation, we have
established the following measurable lending goals. The goals have been
stated as a percentage of our average assets in terms of CRA qualified
lending goal to low-to-moderate income borrowers. Rather than choose a
progressive goal (as was observed in other agency approved plans) we
have chosen to tie our goal to our average asset size so that it will grow as
the bank does. These goals include all new loans within our assessment
area that are CRA qualified. The Bank’s measurable goals are set at a level
that should be sustainable, depending on the relevant economic conditions
at that time.
Plan Goal 1: LMI HMDA Loans as a percentage (%) of Average Assets
in AA (only low- to moderate-income borrowers)
Plan Year Satisfactory Outstanding Tier
2022 7% 8.4% 1
2023 7% 8.4% 1
2024 7% 8.4% 1
Goal Rationale:
As indicated by the income and wealth demographics of the assessment area and from the results
of the independent Community Needs Interviews commissioned by the Bank, access to and
support for affordable housing is the greatest extant need within the assessment area among all
income demographics, but with particular reference to low-to-moderate income households.
In establishing the plan goals above, performance targets have been designated based on historic
performance, extant community needs, future strategic plans, and projections regarding potential
future performance based on current and emerging economic conditions. As summarized in the
table below, the historic performance of the Bank has substantially increased in this area during
2020 in contrast to prior period performance. This increase is attributable to a number of factors,
including but not limited to changes in national macroeconomic conditions and responses to the
return of an exceptionally low interest rate market, which has increased volumes of refinancing
Page 30 of 42You can also read