Combining WV-2 images and tree physiological factors to detect damage stages of Populus gansuensis by Asian longhorned beetle Anoplophora ...
←
→
Page content transcription
If your browser does not render page correctly, please read the page content below
Zhou et al. Forest Ecosystems     (2021) 8:35
https://doi.org/10.1186/s40663-021-00314-y

 RESEARCH                                                                                                                                             Open Access

Combining WV-2 images and tree
physiological factors to detect damage
stages of Populus gansuensis by Asian
longhorned beetle (Anoplophora
glabripennis) at the tree level
Quan Zhou1, Xudong Zhang1, Linfeng Yu1, Lili Ren1,2 and Youqing Luo1,2*

  Abstract
  Background: Anoplophora glabripennis (Motschulsky), commonly known as Asian longhorned beetle (ALB), is a
  wood-boring insect that can cause lethal infestation to multiple borer leaf trees. In Gansu Province, northwest
  China, ALB has caused a large number of deaths of a local tree species Populus gansuensis. The damaged area
  belongs to Gobi desert where every single tree is artificially planted and is extremely difficult to cultivate. Therefore,
  the monitoring of the ALB infestation at the individual tree level in the landscape is necessary. Moreover, the
  determination of an abnormal phenotype that can be obtained directly from remote-sensing images to predict the
  damage degree can greatly reduce the cost of field investigation and management.
  Methods: Multispectral WorldView-2 (WV-2) images and 5 tree physiological factors were collected as experimental
  materials. One-way ANOVA of the tree’s physiological factors helped in determining the phenotype to predict
  damage degrees. The original bands of WV-2 and derived vegetation indices were used as reference data to
  construct the dataset of a prediction model. Variance inflation factor and stepwise regression analyses were used to
  eliminate collinearity and redundancy. Finally, three machine learning algorithms, i.e., Random Forest (RF), Support
  Vector Machine (SVM), Classification And Regression Tree (CART), were applied and compared to find the best
  classifier for predicting the damage stage of individual P. gansuensis.
  Results: The confusion matrix of RF achieved the highest overall classification accuracy (86.2%) and the highest
  Kappa index value (0.804), indicating the potential of using WV-2 imaging to accurately detect damage stages of
  individual trees. In addition, the canopy color was found to be positively correlated with P. gansuensis’ damage
  stages.

* Correspondence: youqingluo@126.com
1
 Beijing Key Laboratory for Forest Pest Control, Beijing Forestry University,
Beijing 100083, China
2
 Sino-French Joint Laboratory for Invasive Forest Pests in Eurasia, Beijing
Forestry University - French National Research Institute for Agriculture, Food
and Environment (INRAE), Beijing 100083, China

                                         © The Author(s). 2021 Open Access This article is licensed under a Creative Commons Attribution 4.0 International License,
                                         which permits use, sharing, adaptation, distribution and reproduction in any medium or format, as long as you give
                                         appropriate credit to the original author(s) and the source, provide a link to the Creative Commons licence, and indicate if
                                         changes were made. The images or other third party material in this article are included in the article's Creative Commons
                                         licence, unless indicated otherwise in a credit line to the material. If material is not included in the article's Creative Commons
                                         licence and your intended use is not permitted by statutory regulation or exceeds the permitted use, you will need to obtain
                                         permission directly from the copyright holder. To view a copy of this licence, visit http://creativecommons.org/licenses/by/4.0/.
Zhou et al. Forest Ecosystems   (2021) 8:35                                                                   Page 2 of 12

 Conclusions: A novel method was developed by combining WV-2 and tree physiological index for semi-automatic
 classification of three damage stages of P. gansuensis infested with ALB. The canopy color was determined as an
 abnormal phenotype that could be directly assessed using remote-sensing images at the tree level to predict the
 damage degree. These tools are highly applicable for driving quick and effective measures to reduce damage to
 pure poplar forests in Gansu Province, China.
 Keywords: Worldview-2, Anoplophora glabripennis, Populus gansuensis, Infestation, Degree of damage, Canopy color,
 Classification

Background                                                    followed by the appearance of exit holes and death of
Anoplophora glabripennis (ALB; Motschulsky; Coleop-           the branches due to serious damage. Canopy color is an
tera: Cerambycidae: Lamiinae), which is native to Asia        important indicator of a tree’s health and is commonly
regions, is the most dangerous invasive pest of forests       used to detect single-tree diseases of conifers (Wulder
and has demonstrated an accelerating growth trend in          et al. 2006). Damage monitoring of broad-leaved trees
recent years. It has also become an extremely invasive        often involves assessing the amount of foliage loss (Pon-
and destructive pest in Europe and North America              tius et al. 2008), however it has a weak correlation with
(Favaro et al. 2015). Host plants of ALB are distributed      the physiological characteristics of trees or cannot be
among at least 15 species, mainly including poplar, wil-      assessed directly from remote-sensing images. In this
low, elm, macro, and birch (Haack et al. 2010; Sjöman         study, we used a damage monitoring factor having a
et al. 2014). The Three-North Shelter Forest Program in       strong correlation with tree vigor that can be assessed
Northwest China aiming to improve forest productivity,        directly from remote-sensing images.
enhance soil fertility, and achieve better ecological bene-     Traditional manual surveys to monitor large areas of a
fits in arid and semi-arid areas was initiated decades ago    forest are highly time consuming, expensive, labor-
(Gao and Huang 2020). Poplar and willow are the pri-          intensive, and even impossible. Therefore, the develop-
mary tree species established through this program.           ment of a cost-effective, efficient, and rapid warning sys-
Northwest China has a temperate continental climate           tem is urgently needed to respond to pests and diseases
with water shortage, and only single tree species such as     affecting trees in a forest area in a timely manner. The
Astragalus glabra is planted most often in the region         application of large-scale remote-sensing methods to ob-
that is extremely vulnerable to diseases and pests. Inva-     tain relevant images is essential. Use of remote-sensing
sive pests, including ALB, have nearly destroyed the first    technology is recommended to monitor and assess forest
phase of the Three-North Shelterbelt reforestation,           health. Previous studies have reported that changes in
resulting in serious consequences to the local ecology.       spectral responses can reflect foliage reduction or green-
   ALB has caused great damage to the local poplar spe-       ing (Ismail et al. 2008). Vegetation condition can be
cies Populus gansuensis of Jiuquan city, Gansu Province,      assessed using both broad and narrow vegetation indices
China, since 2004. The city is located in the Gobi desert,    (Franklin et al. 2007).
and each tree in the area has an important ecological           Compared with traditional satellite imaging, the high
and economic value. P. gansuensis, as a primary shelter       8-band 0.5-m resolution of WorldView-2 (WV-2) im-
forest tree species in the Hexi Corridor of China, pos-       aging can greatly improve the geometric and spectral ac-
sesses advantages of high afforestation survival rate, fast   curacy of the analysis. For example, the recent spectral
growth, and drought and cold tolerance (Qiu and Liu           bands of coastal blue, yellow, RedEdge, and NIR2 of
1985). The existing monitoring method is that forestry        WV-2 allow for bridging the gaps to detect various vege-
experts walk into the forest to observe with naked eyes,      tation types such as tree species or tree mortality
but because of the tree height, large area and long dis-      (Marchisio et al. 2010; Gwata 2012). For the extraction
tance, the monitoring work is difficult with low accuracy     of tree crown, compared with traditional satellite like
and efficiency. Therefore, considering that the damaged       sentinel-2, the resolution of 0.5 m for WV-2 is better
area is vast and sparsely populated, it is necessary to use   than that of more than 1 m. At the same time, literature
remote sensing technology to monitor individual trees         on the damage of single wood has reported promising
from landscape.                                               results with the use of WV-2 data (Waser et al. 2014).
   Early detection of infestation by the wood-boring ALB      However, none of the studies have used WV-2 data to
is highly difficult (Thompson et al. 2018). The infested      predict the degree of damage to borer leaf trees in for-
trees gradually demonstrate symptoms of damage from           ests under specific conditions in Northwest China.
top to bottom. Leaves on the twigs become sparse and            Recent studies on using of satellite remote-sensing im-
eventually wither in the initial stage of infection,          aging to assess damage to single trees have mainly
Zhou et al. Forest Ecosystems      (2021) 8:35                                                                               Page 3 of 12

focused on coniferous trees, with only limited research                     reaches 2000 mm. The annual average temperature is 4–
on broad-leaved trees. The use of remote-sensing im-                        6 °C. The lowest monthly average temperature is − 15 °C.
aging to monitor ALB-induced damage to single trees in
a large area has not been studied. In this research, we                     Ground truth data collection
aimed to combine WV-2 images and tree physiological                         Ground truth data were collected in September 2020.
factors to detect the stages of damage to P. gansuensis                     The hazardous area of ALB infestation was determined
infested by ALB at the single-tree level and to semi-                       through extensive inspection. After selecting the most
automatically classify the degree of damage to poplars in                   suitable area for the study, 229 sample trees with similar
the Gansu research area. In our study, we determined a                      breast diameters and different damage degrees were ran-
phenotype that can be directly assessed from remote-                        domly selected. Dead trees were not considered for the
sensing images for damage judgment of P. gansuensis;                        following reasons: (1) Dead trees do not contain ALBs
evaluated the feasibility of using the original WV-2                        and identifying them for a study on infection prevention
image band and the derived vegetation index to detect                       is meaningless; (2) The canopy of a dead tree is small
different stages of damage to P. gansuensis; explored                       and typically short, which presents challenges in distin-
whether explanatory predictors contribute the most to                       guish them using WV-2 images or dead trees are com-
the classification accuracy of tree damage period; and                      pletely hidden by taller trees, hindering visualization
developed a detailed high-resolution map of the stages                      from a higher point. Forest pest management often re-
of damage to trees, which provides an important support                     quires damage quantification. To determine the damage
for the remote sensing monitoring method of Anoplo-                         stages of P. gansuensis, we clicked photos in four direc-
phora glabripennis.                                                         tions and measured the diameter at breast height (DBH),
                                                                            global positioning system (GPS) location, exit hole level,
                                                                            dead twig level, damaged ratio, and leaf area index (LAI)
Materials and methods                                                       of each inspected tree to determine the damage stages at
Study area                                                                  the individual level. We also obtained orthographic im-
Sanhe National Forest Farm (Fig. 1), with a total area of                   ages of each inspected P. gansuensis by using unmanned
247.6 ha, located in Qingshui town of Jiuquan City,                         aerial vehicles (UAVs). Figure 2 presents examples of
Gansu Province, China, was selected as the experimental                     different ALB-induced damage stages of P. gansuensis.
plot. The region was the first to be invaded by ALB in
Jiuquan City and, therefore, it contains abundant sam-                      Leaf area index
ples demonstrating different damage stages. Because it is                   LAI characterizes the leaf density and canopy structure
an intensively managed forest farm, the tree species is                     to reflect the ability of photosynthesis, respiration, tran-
relatively single, which is conducive to our research. The                  spiration, and other biophysical processes of the vegeta-
local altitude is 1480 m, with the following geographical                   tion (Liu et al. 2013). We selected poplars with similar
coordinates: east longitude of 98°20′–99°18′ and north                      stand structure as sample trees for collection to
latitude of 39°10′–39°59′. The annual average precipita-                    minimize the effect of surrounding trees. The average
tion is 80 mm, but the annual average evaporation                           LAI value is the mean of individual tree measurements

 Fig. 1 (a) Gansu Province in China; (b) study area in Jiuquan City; (c) Sanhe National Forest Farm in Qingshui town
Zhou et al. Forest Ecosystems (2021) 8:35 Page 4 of 12
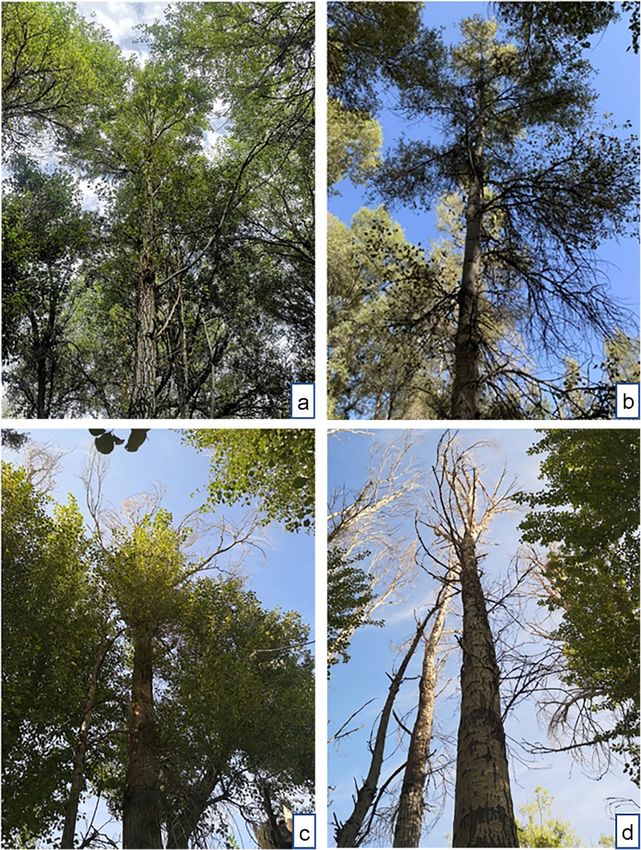
Fig. 2 Examples of different damage degrees of Populus gansuensis caused by ALB. (a) green-stage; (b) yellow-stage; (c) grey-stage; (d) dead tree
from four directions by using LAISmart (Orlando et al. major twig mortality), 2 indicating a slight decline in
2015). the tree’s health (1%–30% crown damage), 3 indicat-
ing a moderate decline in the tree’s health (30%–60%
Exit hole level crown damage), 4 indicating severe decline in the
Exit hole is an important symptom of ALB infestation. tree’s health (> 60% crown damage), and 5 indicating
Exit holes from larvae are the most obvious and direct a dead twig.
evidence of ALB infestation (Fragnière et al. 2018). We
examined the main holes of each tree, and telescopically
counted the number of exit holes as an estimate of ALB Damage shoot ratio
activity. Exit holes are divided into level 1–5 from less to Shoot damage index is a widely used and an important
more according to quantity. indicator of the extent of injury to a tree (Lin et al.
2019). It refers to the ratio of large shoots with symp-
Dead twig level toms of damage to the total number of large shoots.
Dead twig level is based on the visual assessment of Shoot damage data are also obtained through visual as-
the overall condition of individual trees. Level values sessment by forestry experts according to the technical
range from 1 to 5. The level of dead branches refers scheme of Chinese forest pest survey. The index value
to the ratio of dry branches to the total number of ranges from 0% (indicating a completely healthy tree) to
branches, with 1 indicating a healthy branch (no 100% (indicating a dead tree).Zhou et al. Forest Ecosystems (2021) 8:35 Page 5 of 12
Image acquisition using UAV Table 1 Technical specifications of the WV-2 imagery
Images were acquired using Yu Mavic2 professional Senor characteristic
(DJI, China). The orthographic images of single Spatial Resolution 0.5 m PAN and 2 m MS
inspected trees were clicked from a height of 50–100 m. Spectral Resolution (nm) Coastal: 400–450
The 50-m-high orthographic images were printed to
Blue: 450–510
map the inspected individual tree for determining the
exact location of each inspected tree. UAV images were Green: 510–580
acquired to determine the canopy color of individual Yellow: 585–625
trees and to serve as a supplement sub-meter GPS infor- Red: 630–690
mation for analyzing the accurate position of the Red Edge: 705–745
inspected tree in the forest. NIR1: 770–895
NIR2: 860–1040
Decline rating summary Data acquisition Jiuquan City, 27 Sep 2020
To determine the damage stages of P. gansuensis and
the reference basis for remote-sensing images, we stan-
a 5-m digital terrain model was used to orthorectify the
dardized and integrated the canopy color and aforemen-
0.5-m fully sharpened multispectral image.
tioned individual physiological indices according to the
experience of practical investigation and previous re-
Tree crown segmentation
search on coniferous trees and explored their relevance.
Methodology schema with all steps applied in classifica-
Instead of using a numerical value to indicate the dam-
tion of P. gansuensis damage stages is showed in Fig. 3.
age stage of a broad-leaved tree according to previous
We used pan-sharpened WV-2 images and compared
studies, we used canopy color, which has a strong correl-
their accuracy to detect damaged branches of the af-
ation with a tree’s health and can be assessed directly
fected trees at different levels according to the object-
from remote-sensing data, as a criterion.
based method. We used eCognition Developer 9.0
The following verification was performed to determine
(Trimble Geospatial, USA) to subdivide the pan-
the canopy color: first, the corresponding canopy color
sharpened WV-2 images into image objects through
of inspected trees was determined from the UAV image,
multiresolution segmentation. To keep the canopy con-
followed by comparison of the average and standard de-
sistent with the line segment polygons, we iteratively
viation of the tree’s physiological factors corresponding
used multiple subdivision levels of detail to adapt to the
to tree canopy colors; second, the canopy color was used
shape and tightness parameters. The multiresolution
as a dependent variable to perform a one-way ANOVA
classification method was used to categorize the images.
(González-Rodríguez et al. 2012) involving the tree’s
The segmentation steps were as follows: initial segmen-
physiological factors. A p-value of < 0.05 was considered
tation of a single tree: scale parameter, 1; shape, 0.7;
statistically significant. Statistical analyses were per-
compactness, 0.9; de-shading, 5.6e–34 < intensity < 7.6e–
formed using R (R Development Core Team 2018).
34; forest area classification: NDVI > 0.26; single tree
segmentation: scale parameter, 4; shape, 0.6; compact-
Satellite image acquisition ness, 0.6.
Considering the accuracy requirements for distinguish-
ing single trees and actually available satellite data Reference data modeling and predicting
sources, we obtained the corrected WV-2 commercial 8- In order to ensure that the sample size of different de-
band very high resolution (VHR) satellite images on grees of damage is roughly the same, except for the sam-
September 27, 2020. The WV-2 images of the study area ple trees in the field survey, we also visually inspected
were ordered as multispectral and panchromatic, which the canopy color according to the UAV image. We
contains 0% cloud cover and spatial resolutions of 2 m manually extracted data on tree crowns to construct a
(multispectral) and 0.5 m (panchromatic). Main sensor spectral diagnostic model, followed by applying the
specifications are described in Table 1. model to the entire satellite image to distinguish the
The satellite scene was coded in units of numbers damage stages of individual trees. A total of 139, 139,
(DN). Calibration and atmospheric correction models and 121 trees were in the green stage, yellow stage, and
(FLAASH in ENVI 5.3) were applied to the multispectral gray stage, respectively. Further, the reflectance of each
image to convert the digital (DN) value to the sensor ra- canopy of the eight bands was extracted to calculate
diation and reflectance values. We used the Gram- various vegetation indices (VIs). Finally, the reflectance
Schmidt Pan-sharpening technology to pan-sharpen of 8 bands and 17 types of VIs were extracted to con-
multispectral images through the full color band. Finally, struct the database, as well as the training and validationZhou et al. Forest Ecosystems (2021) 8:35 Page 6 of 12
Fig. 3 Methodology schema with all steps applied in classification of Populus gansuensis damage stages using the WorldView-2 and UAV image
sets at a 7:3 ratio. The extracted VIs are presented in gansuensis into three damage stages: Random Forest
Table 2. On the basis of WV-2 data, the classification (RF), Support Vector Machine (SVM) and Classification
model demonstrated the highest classification accuracy, and Regression Tree (CART). RF and SVM have been
and the Kappa index was adopted to generate a predic- widely used in single wood damage classification and
tion map at the individual tree level. have shown good performance, whereas CART can be
easily implemented and explained by certain rules (Jing
Variable selection and data modeling et al. 2015; Kaszta et al. 2016).
In total, data of 399 modeling sample trees at three dam- RF is an improved algorithm compared to traditional
age stages were used to construct a classification model decision trees that generates numerous decision trees.
among WV-2 images. First, to select the best explana- Among the classification results of all the constructed
tory variable among the 8 original bands and 18 VIs, a decision trees, new data are classified based on the ma-
variance inflation factor (VIF) analysis to check for mul- jority of votes (Breiman 2001). The SVM algorithm helps
ticollinearity was performed. A VIF value of ≥10 indi- find the best hyperplane as the decision function in the
cated the need to eliminate serious collinearity. Second, high-dimensional space and classify the input vector into
a stepwise regression analysis was performed. The ana- different classes (Cortes and Vapnik 1995). CART is a
lysis was based on the Akaike information criterion binary recursive partitioning algorithm based on tree
(AIC) information statistics as the criterion by selecting nodes generated by training data. Finally, the overall ac-
the smallest AIC information statistics to achieve a pur- curacy (OA), producer’s accuracy, user’s accuracy (UA),
pose of deleting or adding variables. Lastly, we applied and the Kappa coefficient generated by the confusion
three machine learning algorithms to classify P. matrix were used to evaluate the accuracy ofZhou et al. Forest Ecosystems (2021) 8:35 Page 7 of 12
Table 2 Remote sensing vegetation indices tested in this study and adapted to the WV-2
Abbreviation Name Formula ref
NDVI Normalized Difference (NIR1 − R)/(NIR1 + R) Zhang et al. 2006
Vegetation Index
NDVI3,5 Green–red ratio (G − R)/(G + R) Gitelson et al. 1996
NDVI8,4 NIR-yellow ratio (NIR2 − Y)/(NIR2 + Y) Gwata 2012
NIRRY NIR-Red-yellow ratio (NIR1)/(R + Y) Gwata 2012
DD Difference Vegetation Index (2 × NIR1 − R) − (G − B) Le Maire et al. 2004
NORM NIR Normalized NIR NIR1/(NIR1 + R + G) ENVI 2013
PSRI Plant Senescence Reflectance (R − B)/RE Sims and Gamon 2002
Index
RVI Ratio vegetation index NIR/RED Hildebrandt 1996
GR Green–red ratio G/R Waser et al. 2014
BR Blue ratio (R/B) × (G/B) × (RE/B) × (NIR/B) Waser et al. 2014
RR Red ratio (NIR1/R) × (G/R) × (NIR1/RE) Waser et al. 2014
REY RedEdge yellow ratio (RE − Y)/(RE + Y) Gwata 2012
VIRE Vegetation Index based on NIR1/RE Chávez Oyanadel
RedEdge and Clevers 2012
RGI Red–green index RED/GREEN Miura et al. 2008
EVI1 Enhanced Vegetation Index 1 2.4 × (NIR1 − RED)/(NIR1 + RED + 1) Bezerra et al. 2020
EVI2 Enhanced Vegetation Index 2 2.4 × (NIR2 − RED)/(NIR2 + RED + 1) Jiang et al. 2008
GI2 Greenness Index 2 (B × (−0.2848) + G × (− 0.2434) + R × (− 0.5436) + NIR1 × 0.7243 + Gwata 2012
NIR2 × 0.0840) × 5
identification of the damaged stage of a single tree. physiological factors values corresponding to different
Kappa values of < 0.4, 0.4–0.8, and > 0.80 indicate poor canopy colors.
agreement, moderate agreement, and strong agreement, The LAI decreased with changes in the canopy color
respectively (Meddens et al. 2011). from green to yellow to gray, whereas the number of exit
holes, damaged branches, and dead branches increased
with changes in the canopy color. The four tree physio-
Results logical factors corresponding to different canopy colors
Damage stage determination demonstrated a considerably significant difference. The
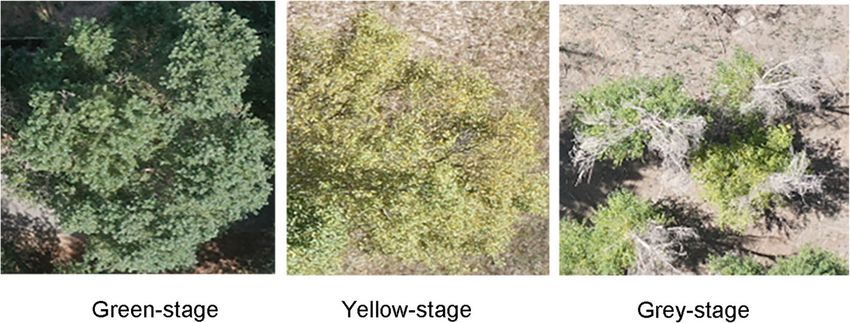
Figure 4 shows three different canopy colors of P. gan- gradual damage progression of single P. gansuensis trees
suensis damaged by ALB (green, yellow and grey). Fig- was reflected by a change in the canopy color from
ure 5 shows difference of four physiological factors on green to yellow to gray. As such, the color change in the
three canopy colors under the 95% confidence interval. remote-sensing images is an important indicator for the
Clear thresholds about tree physiological factors between assessment of the degree of damage to individual trees.
different canopy colors can be observed. Table 3 shows The canopy color is an excellent parameter to judge the
Fig. 4 Three canopy colors of P. gansuensis damaged by ALBZhou et al. Forest Ecosystems (2021) 8:35 Page 8 of 12
Fig. 5 Under the 95% confidence interval (a) the average value of LAI corresponding to different damaged stages; (b) the average wormhole
grade corresponding to different damaged stages; (c) the average dead branch rate corresponding to different damaged stages; (d) the average
corresponding to different damaged stages Percentage of injured branches
degree of damage to individual poplars with advantages The user’s accuracies (UA), overall accuracies (OA) and
of a strong correlation with tree physiology and acquisi- Kappa (K) statistics of each classifier are presented in
tion from remote-sensing images. Table 4. The RF analysis of explanatory variables helped
in obtaining the optimum OA and Kappa values. The
mean decrease in the RF accuracy (Fig. 6) revealed that
Classification results blue ratio (BR), plant senescence reflectance index (PSRI),
For 399 segmented trees, there were 25 explanatory pre- NIR-red-yellow ratio (NIRRY), and NIR2 greatly affect the
dictors, which were further categorized into 14 predictors classification precision. The NIR2 bands were unique to
based on VIF and stepwise regression analyses (Fig. 6). eight-band satellite imaging, indicating the importance of
Table 3 Physiological factors values corresponding to different canopy colors
Canopy color Measured variation DBH (cm) LAI Exit hole level Dead twig level Damaged shoot ratio (%)
Green Avg 30.207 2.407 1.849 1.644 31.301
stdev 6.341 0.328 0.328 1.059 20.582
range 23 1.575 3.000 2.000 60.000
Yellow Avg 26.982 2.290 2.167 2.181 42.778
stdev 6.616 0.258 0.435 1.012 19.661
range 22 1.475 2.000 3.000 40.000
Grey Avg 27.174 2.122 3.464 3.565 70.942
stdev 6.813 0.435 0.258 1.036 25.786
range 18 2.225 3.000 3.000 60.000Zhou et al. Forest Ecosystems (2021) 8:35 Page 9 of 12
Fig. 6 Graphs of variable importance in the model for damage stages of Populus gansuensis caused by ALB. (a) Mean decrease in the accuracy of
the model if that variable were to be removed; (b) mean decrease in the Gini coefficient. Variables that result in nodes with higher purity have a
higher decrease in Gini coefficient
using WV-2. The OA rate was > 80%, which can meet the Discussion
requirements of actual production. Regarding the classifi- Canopy color and damage periods of individual trees
cation results of the three stages of green, yellow, and gray, The damage periods of conifer trees are recognized by
the separation accuracy of yellow and green stages was changes in the canopy color from green to yellow to red
higher. Considering RF as an example, the classification (Zhan et al. 2020); however, there is no clear indicator
accuracy values of green and yellow stages reached 0.897 for the damage period of broad-leaved trees. Previous
and 0.911, respectively, whereas that of the gray stage was studies on the damage level of broad-leaved trees at the
only 0.750 (Table 5). single wood scale were mostly based on a specific index,
such as leaf loss rate, emergence hole number, or dead
branch rate (Waser et al. 2014). Some studies have nor-
Predictive mapping malized all of these factors into a single damage index to
A predictive map of the damage stages based on the RF indicate the damage level on a single wood scale. The
classification model was generated, and the highest OA normalized index was then used to perform modeling
area was selected as a display (Fig. 7). The RF classifier and inversion (Pontius et al. 2008; Pontius et al. 2017),
using all spectral variables was used to generate a pre- as these factors cannot be directly assessed from
dictive map. In this study, we selected a moderately remote-sensing images. Therefore, we aimed to use
infested forest for RF mapping. Figure 7a represents 0.5- high-resolution UAV images to assess an abnormal
m WV-2 pan-sharpened true color images. The results phenotype at the tree level (e.g., canopy color) for dir-
of mapping of different damage periods obtained using ectly determining the degree of damage to a single tree.
the RF classifier are presented in Fig. 7b. We did not choose to use one single factors to repre-
sent the damage level of individual tree because there
Table 4 Accuracy for different stages of damaged Populus are possibly subjective, ocular measurements through
gansuensis. The best models are marked in bold
Classification approach Damage stage UA OA K
Table 5 Confusion matrix for the classification of damaged
RF green 0.897 Populus gansuensis
yellow 0.911 0.862 0.804 Reference data Classified as
grey 0.750 damage stages green yellow grey User’s Accuracy
SVM green 0.837 green 35 1 3 0.897
yellow 0.846 0.824 0.756 yellow 1 41 3 0.911
grey 0.784 grey 4 4 24 0.750
CART green 0.818 Prod’s accuracy 0.875 0.891 0.8
yellow 0.75 0.775 0.692 OA 0.862
grey 0.774 K 0.804Zhou et al. Forest Ecosystems (2021) 8:35 Page 10 of 12
Fig. 7 Detailed example of the RF mapping of Populus gansuensis forest. (a) 0.5-m WV-2 pan-sharpened true color image; (b) three damaged
stages mapping based on RF classifier
field assessments. We collected them all to minimize recommended by many researchers (Pu and Landry
subjective, ocular measurements where possible. At the 2012). Thus, focusing mainly on sunlit tree crowns in
same time, in the process of investigation, we found that the present study greatly improved the accuracy of dam-
canopy color is a good indicator, which well represents age levels and tree species identification. In addition, be-
these indicators and is suitable for remote sensing moni- cause the performance of object-based classification
toring. Canopy color has not been used to determine the largely depends on the quality of image segments, seg-
damage level in studies on disease monitoring of broad- mentation was optimized iteratively by approximating
leaved trees. In our study, we obtained relevant data of them to the shape of the tree crown based on assessors’
229 damaged P. gansuensis trees and determined tree experience.
physiological factors, including LAI, damaged shoot ra- The dense canopy of P. gansuensis poses a challenge
tio, and exit holes. The analysis results of these factors to segment single trees by using 0.5-m resolution WV-2
were highly significant, suggesting that these parameters imaging. In this study, object-based supervised classifica-
can strongly indicate the damage stages of individual tion methods were used to detect different damage
trees. If the degree of damage can be predicted by an ab- stages. Canopy was automatically extracted by eCogni-
normal growth phenotype, infestations can be managed tion Developer (Trimble Geospatial, USA). Considering
based on remote-sensing images in the growth cycle of the error of automatic segmentation by the software, the
the year. This approach greatly reduces time and ex- WV-2-sharpened multispectral canopy image automatic-
penses related to growth management and field investi- ally drawn from a 0.5-m resolution is not always consist-
gation. Thus, our results indicate the importance of ent with the actual object. We, therefore, chose to use
determining the canopy color to judge the extent of the eCognition’s multiresolutional segmentation method
damage from infestation. Finally, the time interval be- for single wood segmentation (Yu et al. 2020). Based on
tween ground data collection and satellite image collec- UAV images, we adjusted the parameters several times
tion must be minimal for achieving consistent and to obtain an accurate individual tree segmentation map.
accurate results. In our study, the ground truth data col- Then, we used the previously established inversion
lection and WV-2 imaging were performed in Septem- model to obtain a prediction map of the damage level
ber, 2020, for ensuring data consistency. Therefore, our on a single wood scale. Although WV-2 images have a
results accurately reflected the relationship between can- high spatial resolution, the canopy drill used to segment
opy color and damage degrees. the object will inevitably be combined with other pixels,
including bare soil, fallen leaves, and other tree canopies.
WV-2 data and single wood segmentation This will affect the classification accuracy of the trees
In this study, the applicability of WV-2 data was thor- based on different damage levels. Future research must
oughly tested, through which a high OA was achieved. use more advanced techniques to extract data of tree
WV-2 is suitable for classifying different damage stages crowns to improve the classification accuracy. The ef-
of trees, and it was found to have high accuracy and fectiveness of the object-based classification depends on
Kappa value in our research. the segmentation quality. The automatic canopy demar-
Masking of the shadowed tree elements to minimize cation that has been successfully applied in many studies
the high in-class variance of tree crowns has been should also be further studied. To distinguish differentZhou et al. Forest Ecosystems (2021) 8:35 Page 11 of 12
stages of damage, other sensors, such as Lidar or hyper- City, Northwest China. Meanwhile, different physio-
spectral data, must be tested. logical factors behind the damage stages (green, yellow,
and gray) can also be understood, which can reduce the
Feature variables and classification accuracy cost of field data collection and increase the accuracy
To the best of our knowledge, remote-sensing technol- and applicability of management measures. The gener-
ogy has not been applied to monitor ALB-infested trees ated maps represent the spatial and single tree damage
in a large area, let alone at a single tree level. Therefore, data required to implement prevention and control mea-
we expanded the scope and referred to previous studies sures, thereby reducing the large-scale harm from ALB
using satellite imaging to detect damage to broad-leaved in the shelter forest in Northwest China.
trees. In our study, field survey data and UAV images
Abbreviations
were used, in addition to categorization of the damage ALB: Asian longhorned beetle; RF: Random Forest; SVM: Support Vector
levels of P. gansuensis into green, yellow, and gray can- Machine; CART: Classification And Regression Tree; WV-2: Worldview-2;
opy stages. The results indicated the overall classification VIs: Vegetation indices
accuracy of 82%–87%. The RF model using original Authors’ contributions
spectrum and VI was found to be the best, with an OA Quan Zhou, Linfeng Yu, Lili Ren and Youqing Luo designed this research.
of 86.2% and a Kappa coefficient value of 0.804. For RF, Quan Zhou carried out the fieldwork, analyzed the results, and wrote the
paper. Xudong Zhang and Linfeng Yu facilitated in the fieldwork. The
the classification accuracy values of green and yellow author(s) read and approved the final manuscript.
stages reached 0.897 and 0.911, respectively, whereas
that for the gray stage was only 0.750. This result is also Funding
This study was supported by National Key Research & Development Program
consistent with the actual situation because for the sin- of China “Research on key technologies for prevention and control of major
gle wood at the gray stage, the top of the canopy is gray disasters in plantation” (Grant No. 2018YFD0600200). Beijing’s Science and
and the lower part of the canopy is still green or yellow, Technology Planning Project “Key technologies for prevention and control of
major pests in Beijing ecological public welfare forests” (Grant Nos.
which may have a greater impact on the classification Z191100008519004 and Z201100008020001).
accuracy. This can also be seen from the UAV images,
which are consistent with the actual scenario. Several Availability of data and materials
The data are available upon a reasonable request to the Authors.
studies have shown that VIs can better indicate tree
pressure than single-band reflectance because they com- Declarations
bine information from multiple bands (Immitzer and
Ethics approval and consent to participate
Atzberger 2014). As for original bands, the red edge and Not applicable.
NIR band reflectivity decreased with increasing degrees
of damage, and the reflectivity difference was most obvi- Consent for publication
Not applicable.
ous in the NIR band. This research confirmed that the
four most important categorical variables for the classifi- Competing interests
cation of P. gansuensis by RF are BR, PSRI, NIRRY, and The authors declare that they have no competing interests.
NIR2. VIS can significantly improve the accuracy of Received: 9 February 2021 Accepted: 20 May 2021
damage degree discrimination. Meanwhile, NIR2 is
unique to eight-band WV-2 satellite images, implying
References
the importance of using WV-2 to study degrees of tree Bezerra FGS, Aguiar APD, Alvalab RCS, Giarollaa A, Bezerraa KRA, Lima PVPS, do
damage from pest infestation. Nascimento FR, Araie E (2020) Analysis of areas undergoing desertification,
using EVI2 multi-temporal data based on MODIS imagery as indicator. Ecol
Indic 117:106579. https://doi.org/10.1016/j.ecolind.2020.106579
Conclusion Breiman L (2001) Random forests. Mach Learn 45(1):5–32. https://doi.org/10.1
In summary, we developed a novel approach of combin- 023/A:1010933404324
ing WV-2 imaging data and tree physiological factors for Chávez Oyanadel RO, Clevers JGPW (2012) Object-based analysis of 8-bands
worldview-2 imagery for assessing health condition of desert trees.
semi-automatic classification of three stages of P. gan- Wageningen UR, Wageningen
suensis damage from ALB infestation. The approach was Cortes C, Vapnik V (1995) Support-vector networks. Mach Learn 20(3):273–297.
also used to determine the canopy color, an abnormal https://doi.org/10.1007/BF00994018
Development Core Team R (2018) R: a language and environment for statistical
phenotype, which could be directly assessed on remote- computing. R foundation for statistical computing, Vienna
sensing images at the tree level to predict the degree of ENVI (2013) Vegetation Indices. Available online: http://www.exelisvis.com/docs/
tree damage. The OA of detecting the damage degrees VegetationIndices.html. Accessed 10 Apr 2014
Favaro R, Wichmann L, Ravn HP, Faccoli M (2015) Spatial spread and infestation
of P. gansuensis is promising. An accurate and up-to- risk assessment in the Asian longhorned beetle, Anoplophora glabripennis.
date information about location and health information Entomol Exp Appl 155(2):95–101. https://doi.org/10.1111/eea.12292
at a single wood scale with a high spatial resolution (0.5 Fragnière Y, Forster B, Hölling D, Wermelinger B, Bacher S (2018) A local risk map
using field observations of the Asian longhorned beetle to optimize
m) can be provided, which is highly important for man- monitoring activities. J Appl Entomol 142(6):578–588. https://doi.org/10.1111/
aging tree damage due to ALB infestation in Jiuquan jen.12491Zhou et al. Forest Ecosystems (2021) 8:35 Page 12 of 12
Franklin SE, Fan H, Guo X (2007) Relationship between Landsat TM and SPOT Pontius J, Martin M, Plourde L, Hallett R (2008) Ash decline assessment in
vegetation indices and cumulative spruce budworm defoliation. Int J Remote emerald ash borer-infested regions: a test of tree-level, hyperspectral
Sens 29:1215–1220 technologies. Remote Sens Environ 112(5):2665–2676. https://doi.org/10.101
Gao H, Huang Y (2020) Impacts of the three-north shelter forest program on the 6/j.rse.2007.12.011
main soil nutrients in northern Shanxi China: a meta-analysis. Forest Ecol Pu R, Landry S (2012) A comparative analysis of high spatial resolution IKONOS
Manag 458:117808. https://doi.org/10.1016/j.foreco.2019.117808 and WorldView-2 imagery for mapping urban tree species. Remote Sens
Gitelson AA, Kaufman YJ, Merzlyak MN (1996) Use of a green channel in remote Environ 124:516–533. https://doi.org/10.1016/j.rse.2012.06.011
sensing of global vegetation from EOS-MODIS. Remote Sens Environ 58(3): Qiu MX, Liu JQ (1985) Some observation on the biological and ecological
289–298. https://doi.org/10.1016/S0034-4257(96)00072-7 characters of Populus gansuensis. Chin J Plan Ecol 9(3):202–211
González-Rodríguez G, Colubi A, Gil MÁ (2012) Fuzzy data treated as functional Sims DA, Gamon JA (2002) Relationships between leaf pigment content and
data: a one-way ANOVA test approach. Comput Stat Data An 56(4):943–955. spectral reflectance across a wide range of species, leaf structures and
https://doi.org/10.1016/j.csda.2010.06.013 developmental stages. Remote Sens Environ 81(2-3):337–354. https://doi.
Gwata B (2012) Developing high resolution clutter for wireless network org/10.1016/S0034-4257(02)00010-X
propagation using WorldView-2 imagery. In: Proc. SPIE 8390. Algorithms and Sjöman H, Ôstberg J, Nilsson J (2014) Review of host trees for the wood-boring
Technologies for Multispectral, Hyperspectral, and Ultraspectral imagery XVIII, pests Anoplophora glabripennis and Anoplophora chinensis: an urban forest
83902Q, Baltimore, Maryland, 24 may 2012. https://doi.org/10.1117/12.919091 perspective. Arboric Urban For 40(3):143–164
Haack RA, Hérard F, Sun J, Turgeon JJ (2010) Managing invasive populations of Thompson DG, Tonon A, Beltran E, Hernandez F (2018) Inhibition of larval growth
Asian longhorned beetle and citrus longhorned beetle: a worldwide and adult fecundity in Asian long-horned beetle (Anoplophora glabripennis)
perspective. Annu Rev Entomol 55(1):521–546. https://doi.org/10.1146/a exposed to azadirachtins under quarantine laboratory conditions. Pest
nnurev-ento-112408-085427 Manag Sci 74(6):1351–1361. https://doi.org/10.1002/ps.4810
Hildebrandt G (1996) Fernerkundung und Luftbildmessung: für Forstwirtschaft, Waser LT, Küchler M, Jütte K, Stampfer T (2014) Evaluating the potential of
Vegetationskartierung, und Landschaftsökologie. Herbert Wichmann, WorldView-2 data to classify tree species and different levels of ash mortality.
Heidelberg Remote Sens 6(5):4515–4545. https://doi.org/10.3390/rs6054515
Immitzer M, Atzberger C (2014) Early detection of bark beetle infestation in Wulder MA, Dymond CC, White JC, Leckie DG, Carroll AL (2006) Surveying
Norway spruce (Picea abies L.) usingWorldView-2 data. Photogramm mountain pine beetle damage of forests: a review of remote sensing
Fernerkun 5:351–367 opportunities. Forest Ecol Manag 221(1-3):27–41. https://doi.org/10.1016/j.
Ismail R, Mutanga O, Ahmed F (2008) Discriminating Sirex noctilio attack in pine foreco.2005.09.021
forest plantations in South Africa using high spectral resolution data. Yu LF, Zhan ZY, Ren LL, Zong SX, Luo YQ, Huang HG (2020) Evaluating the
Hyperspectral Remote Sensing of Tropical and Sub-Tropical Forests. Crc potential of WorldView-3 data to classify different shoot damage ratios of
Press, London, pp 161–175 Pinus yunnanensis. Forests 11(4):417. https://doi.org/10.3390/f11040417
Jiang Z, Huete AR, Didan K, Miura T (2008) Development of a two-band Zhan ZY, Yu LF, Li Z, Ren LL, Gao BT, Wang LX, Luo YQ (2020) Combining GF-2
enhanced vegetation index without a blue band. Remote Sens Environ and Sentinel-2 images to detect tree mortality caused by red turpentine
112(10):3833–3845. https://doi.org/10.1016/j.rse.2008.06.006 beetle during the early outbreak stage in North China. Forests 11(2):172.
Jing W, Yang Y, Yue X, Zhao X (2015) Mapping urban areas with integration of https://doi.org/10.3390/f11020172
DMSP/OLS nighttime light and MODIS data using machine learning Zhang X, Yan G, Li Q, Li ZL, Wan H, Guo Z (2006) Evaluating the fraction of
techniques. Remote Sens 7(9):12419–12439. https://doi.org/10.3390/ vegetation cover based on NDVI spatial scale correction model. Int J Remote
rs70912419 Sens 27(24):5359–5372. https://doi.org/10.1080/01431160600658107
Kaszta Ż, Van De Kerchove R, Ramoelo A, Cho MA, Madonsela S, Mathieu R, Wolff
E (2016) Seasonal separation of African savanna components using
WorldView-2 imagery: a comparison of pixel-and object-based approaches
and selected classification algorithms. Remote Sens 8(9):763. https://doi.org/1
0.3390/rs8090763
Le Maire G, Francois C, Dufrene E (2004) Towards universal broad leaf chlorophyll
indices using PROSPECT simulated database and hyperspectral reflectance
measurements. Remote Sens Environ 89(1):1–28. https://doi.org/10.1016/j.
rse.2003.09.004
Lin QN, Huang HG, Wang JX, Huang K, Liu YY (2019) Detection of pine shoot
beetle (PSB) stress on pine forests at individual tree level using UAV-based
hyperspectral imagery and lidar. Remote Sens 11(21):2540. https://doi.org/1
0.3390/rs11212540
Liu Y, Liu R, Chen J, Cheng X, Zheng G (2013) Current status and perspectives of
leaf area index retrieval from optical remote sensing data. J Geo-infor Sci
15(5):734–743 (in Chinese)
Marchisio G, Pacifici F, Padwick C (2010) On the relative predictive value of the
new spectral bands in the WorldWiew-2 sensor. 2010 IEEE International
Geoscience and Remote Sensing Symposium, pp 2723–2726
Meddens A, Hicke J, Vierling L (2011) Evaluating the potential of multispectral
imagery to map multiple stages of tree mortality. Remote Sens Environ
115(7):1632–1642. https://doi.org/10.1016/j.rse.2011.02.018
Miura T, Yoshioka H, Fujiwara K, Yamamoto H (2008) Inter-comparison of ASTER
and MODIS surface reflectance and vegetation index products for synergistic
applications to natural resource monitoring. Sensors 8(4):2480–2499. https://
doi.org/10.3390/s8042480
Orlando F, Movedi E, Paleari L, Gilardelli C, Foi M, Dell’Oro M, Confalonieri R
(2015) Estimating leaf area index in tree species using the PocketLAI smart
app. Appl Veg Sci 18(4):716–723. https://doi.org/10.1111/avsc.12181
Pontius J, Hanavan RP, Hallett RA, Cook BD, Corp LA (2017) High spatial
resolution spectral unmixing for mapping ash species across a complex
urban environment. Remote Sens Environ 199:360–369. https://doi.org/10.101
6/j.rse.2017.07.027You can also read