Climate, land cover and topography: essential ingredients in predicting wetland permanence
←
→
Page content transcription
If your browser does not render page correctly, please read the page content below

Research article
Biogeosciences, 19, 1547–1570, 2022
https://doi.org/10.5194/bg-19-1547-2022
© Author(s) 2022. This work is distributed under
the Creative Commons Attribution 4.0 License.

Climate, land cover and topography: essential ingredients
in predicting wetland permanence
Jody Daniel1 , Rebecca C. Rooney1 , and Derek T. Robinson2
1 Department   of Biology, University of Waterloo, Waterloo, Ontario, N2L 3G1, Canada
2 Department   of Geography and Environmental Management, University of Waterloo, Waterloo, Ontario, N2L 3G1, Canada

Correspondence: Rebecca C. Rooney (rrooney@uwaterloo.ca)

Received: 28 July 2021 – Discussion started: 17 August 2021
Revised: 24 January 2022 – Accepted: 25 January 2022 – Published: 17 March 2022

Abstract. Wetlands in the Prairie Pothole Region (PPR) are         1   Introduction
forecast to retract in their ranges due to climate change,
and potholes that typically contain ponded water year-round,
which support a larger proportion of biological communities,       Wetlands provide a habitat for diverse communities of flora
are most sensitive to climate change. In addition to climate,      and fauna (Gibbs, 1993; Loesch et al., 2012; Sundberg et
land use activities and topography also influence ponded wa-       al., 2016) and deliver ecosystem services of disproportion-
ter amounts in PPR wetlands. However, topography is not            ate importance relative to the area they occupy (Mitsch and
typically included in models forecasting the impacts of cli-       Gosselink, 2015). The diversity and abundance of flora and
mate change on PPR wetlands. Using a combination of vari-          fauna in these wetland ecosystems (Daniel et al., 2019; Glea-
ables representing climate, land cover/land use and topogra-       son and Rooney, 2018) are a function of the consistency with
phy, we predicted wetland permanence class in the south-           which ponded water is available (i.e., pond permanence),
ern Boreal Forest, Parkland and Grassland natural regions          which is forecast to decline in amount and duration of pres-
of the Alberta PPR (N = 40 000 wetlands). We show that             ence (i.e., hydroperiod) across the Prairie Pothole Region of
while climate and land cover/land use were strong predictors       North America due to climate change (Euliss et al., 2004;
of wetland permanence class, topography was as important,          Fay et al., 2016; Steen et al., 2014, 2016). In this region, most
especially in the southern Boreal Forest and Parkland natu-        wetlands are ponded non-permanently, and they support resi-
ral regions. Our misclassification error rates for the gradient    dent biological communities (Daniel et al., 2019; Stewart and
boosting models for each natural region were relatively high       Kantrud, 1971) that are sensitive to climate change (Fay et
(43–60) though our learning rates were low (< 0.1) and our         al., 2016; Johnson et al., 2010). Therefore, understanding the
maximum tree depths shallow (5–7) to balance bias and over-        relative influence of climate on wetland water levels is crit-
fitting. Clearly, factors in addition to climate, topography and   ical to improving our understanding of how biological com-
land cover/land use influence wetland permanence class (i.e.,      munities in the Prairie Pothole Region (PPR) will respond to
basin size, depth, ground water connectivity, etc.). Despite       climate change.
classification errors, our results indicate that climate was the      Alberta lies at the western edge of the Prairie Pothole Re-
strongest predictor of wetland permanence class in the Park-       gion, which encompasses the province’s Grassland and Park-
land and Grassland natural regions, whereas topography was         land natural regions, as well as the southern edge of the
most important in the southern Boreal Forest Natural Region        Boreal Forest Natural Region (Schneider, 2013). Given the
among the three domains we considered.                             PPR’s semi-arid climate, a decline in wetland hydroperiod
                                                                   is expected because of increases in wetland water deficits
                                                                   (Schneider, 2013; Werner et al., 2013). Simulations for the
                                                                   PPR suggest that the magnitude of change in climatic condi-
                                                                   tions between 1946 and 2005 was vast enough to drive de-
                                                                   clines in pond permanence (Werner et al., 2013). Modelling

Published by Copernicus Publications on behalf of the European Geosciences Union.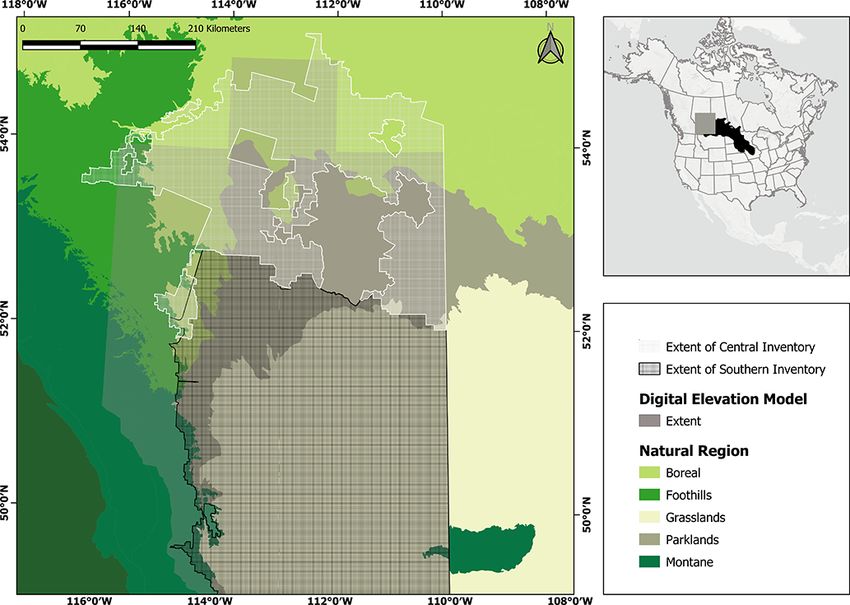
1548                                                                      J. Daniel et al.: Climate, land cover and topography

suggests that these wetlands may experience up to a 20 %           understanding of how wetland biota are affected by climate
decline in precipitation due to climate change, which could        change.
reduce hydroperiods (Fay et al., 2016). Furthermore, fore-            Incorporating the influence of topography individually and
casts suggest that many of the wetlands in the southern and        in combination with climate and land cover/land use effects
western PPR may lose their ponded water completely, driven         on wetland permanence is a gap we must fill to improve wet-
by drier climate conditions in these areas (Johnson et al.,        land and waterfowl population management across the PPR
2005, 2010; Reese and Skagen, 2017). Wetlands that contain         (Fay et al., 2016). We analyse data collected across multiple
ponded water year-round will be most sensitive to climate          field projects and use spatial data, comprising thousands of
change because they contain water in late summer when they         wetlands across the PPR in Alberta, Canada. Only four per-
will be subjected to greater evapotranspiration-driven losses      manence classes (of seven) are represented in this study (Ta-
(Fay et al., 2016). They are also relatively rare (Ridge et al.,   ble 1), and which permanence class a wetland belongs to is
2021). In addition to climate, topography can also affect hy-      determined by the vegetation zone in the deepest part of the
droperiods in PPR wetlands (Johnson et al., 2010; McCauley         wetland – and this is dictated by its typical hydroperiod/pond
et al., 2015; Tsai et al., 2012). The potholes, in which these     permanence over several years (Stewart and Kantrud, 1971).
wetlands are located, form a relic of the land’s glaciated his-    Using these data, we quantify the relative contribution of cli-
tory, and larger catchments contribute more water, resulting       mate, land cover/land use and topography in predicting dif-
in larger water budgets and longer hydroperiods for some           ferent wetland permanence classes of marshes in Alberta’s
pothole wetlands than others (Hayashi et al., 2016; Shaw           PPR.
et al., 2013). Contemporary land use practices (e.g., filling
and ditching) can alter natural topography, affecting flows
of surface and groundwater and subsequently the wetland            2     Methods
hydroperiod. This phenomenon, referred to as consolidation
drainage, fully or partially drains upper-watershed wetlands       2.1    Study area
and directs their water to areas lower in the watershed (Mc-
Cauley et al., 2015). Consolidation drainage is typically done     The wetlands in our study are in the Albertan extent of the
to lower the probability that neighbouring croplands will          Prairie Pothole Region (PPR) (Fig. 1). Wetlands in this re-
flood (Schindler and Donahue, 2006; Verhoeven and Setter,          gion are mainly depressions filled with ponded water, each
2010), which increases farming efficiency (Wiltermuth and          formed in the last glacial period (Wright, 1972). Spring snow
Anteau, 2016).                                                     melt is the largest contributor to ponded water amounts, ei-
   Changes in land use can influence wetland hydroperiods          ther from direct precipitation into the wetland or as runoff
by more than associated terrain modification. For example,         over frozen ground from upland areas (Hayashi et al., 1998).
landscapes with a higher proportion of agricultural activities     Potholes can differ in the length of time they contain ponded
can have longer hydroperiods due to the combination of in-         water, which can range from a few weeks after snowmelt to
creased surface runoff and decreased soil infiltration (van der    the entire year (Stewart and Kantrud, 1971).
Kamp et al., 2003; Voldseth et al., 2007). Many studies as-           The provincial merged wetland inventory (Alberta Merged
sessing the impacts of climate change on PPR wetlands in-          Wetland Inventory, published by Alberta Environment and
corporate land use (Anteau et al., 2016; Vodseth et al., 2009),    Parks) and the Canadian national wetland inventory (Cana-
and there is resounding evidence that wetlands exposed to the      dian Wetlands Inventory, published by Environment and Cli-
same climate regime, but situated among different land use         mate Change Canada) do not assign permanence classes or
activities, differ in their sensitivity to climate change (Mc-     provide measurements (e.g., water volume, depth) that could
Cauley et al., 2015; Wiltermuth and Anteau, 2016).                 be used to classify the wetlands in our study region by per-
   While topography is an important predictor of pond per-         manence class. We acquired permanence class data from two
manence (Hayashi et al., 2016; Neff and Rosenberry, 2017;          smaller wetland inventories (Government of Alberta, 2014)
Shaw et al., 2013; Wiltermuth and Anteau, 2016), it is rarely      that delineate the location, boundary and permanence class
included in studies assessing the impacts of climate change        of PPR wetlands based on Stewart and Kantrud’s classifica-
on PPR wetlands and/or biota (Wolfe et al., 2019). Even            tion (Stewart and Kantrud, 1971) (Table 1). The two wet-
well-established models (e.g., WETSIM, Poiani and John-            land inventories differ in their accuracy (Evans et al., 2017)
son, 1993, WETLANDSCAPE, Johnson et al., 2010), ap-                and include wetlands from the Grassland, Parkland and the
plied to the PPR, predict pond permanence in response to           southern edge of the Boreal Forest natural regions of Al-
climate but omit topography. However, differences in topog-        berta. The Grassland Natural Region comprises mixed-grass
raphy may cause wetlands belonging to the same perma-              prairie, and the Parkland Natural Region comprises decidu-
nence class to differ in their sensitivity to climate change.      ous trees and grasses. Both are semi-arid regions with po-
Consequently, our failure to incorporate topography when           tential evapotranspiration rates that are greater than annual
predicting pond permanence leaves us with an incomplete            precipitation (Downing and Pettapiece, 2006). The Park-
                                                                   land Natural Region, however, experiences more precipita-

Biogeosciences, 19, 1547–1570, 2022                                                    https://doi.org/10.5194/bg-19-1547-2022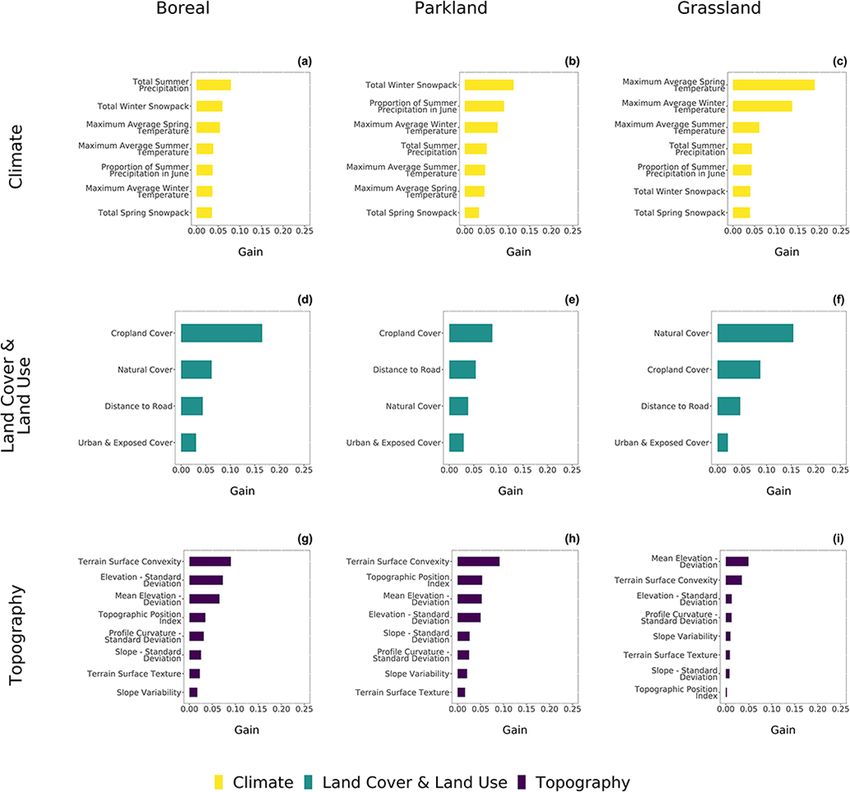
J. Daniel et al.: Climate, land cover and topography                                                                                    1549

Table 1. Descriptions of the four permanence classes included in our study. We describe the typical length of time that these prairie pothole
wetlands will contain ponded water, their associated vegetation zones, as described by Stewart and Kantrud (Stewart and Kantrud, 1971), and
the number of wetlands belonging to each class in the Alberta Merged Wetland Inventory (Government of Alberta, 2014) that were within
the extent of our 25 m digital elevation model.

  Permanence class    Typical hydroperiod           Vegetation zones                                             Natural region
                                                                                                      Boreal Forest   Parkland    Grassland
  Temporary           Until mid-spring, typically   Wet meadow (includes wet-meadow emergent),              40 461     51 062      153 872
                      for 4 weeks                   low prairie, high seepage
  Seasonal            Late spring to early          Shallow marsh (vegetation zones from shallow            30 890     43 836      108 924
                      summer for approximately      to deep: emergent plants, submerged aquatic
                      2 months                      plants), wet meadow, low prairie
  Semi-permanent      Dries fully in drought        Deep marsh (vegetation zones from shallow               39 375     47 075       12 240
                      years only                    to deep: emergent vegetation, open-water with
                                                    bare-soil), shallow marsh, wet meadow,
                                                    low prairie
  Permanent           Open water year-round         Open water, deep marsh, shallow marsh,                    5704     10 785         4952
                                                    wet meadow, low prairie

tion than the Grassland Natural Region (Downing and Petta-               the Grassland Natural Region, the largest wetlands tended
piece, 2006). While most of the Boreal Forest Natural Region             to be permanently ponded, whereas the largest wetlands in
is dominated by coniferous trees and annual precipitation                the Boreal Forest and Parkland natural regions tended to be
amounts typically exceed evapotranspiration rates (Downing               seasonally ponded (Appendix A). The combination of wet-
and Pettapiece, 2006), the southern margin of the Boreal For-            land size and our digital elevation model (DEM) resolution
est Natural Region in Alberta contains pothole wetlands and              of 25 m suggests that our median wetland sizes would oc-
more semi-arid to subhumid climate conditions (Brown et                  cupy 36, 25 and 9 cells for the Boreal Forest, Parkland and
al., 2010; Devito et al., 2005). Our study of the Boreal For-            Grassland natural regions, respectively, defining our ability
est Natural Region considers only on this southern margin                to capture variability among wetland sizes and shape.
sometimes called the boreal transition zone.
                                                                         2.3     Selecting variables
2.2   Wetland locations and extents
                                                                         To select variables representative of climate, land cover/land
                                                                         use and topography that would be useful in testing the rel-
For our analysis, we selected a subset of wetlands from the              ative contribution of these three factors in predicting prairie
Alberta Merged Wetland Inventory within each natural re-                 pothole wetland permanence class, we conducted a literature
gion (Fig. 1). To ensure wetland conditions were indicative              review using the Web of Science. We limited the search to
of the natural regions within which they resided, we excluded            papers published between 1950 and 2018 with the follow-
those within 500 m of a natural region boundary. Then, we                ing key words: (1) Prairie Pothole Region – PPR, Northern
randomly selected 12 000 wetlands in the southern Boreal                 Great Plains, Alberta, Saskatchewan, Manitoba and Dakota;
Forest and Parkland natural regions (3000 per permanence                 (2) weather – climate, temperature and precipitation; (3) dis-
class) and 16 000 in the Grassland Natural Region (4000 per              turbance – land use, agriculture, disturbance, oil and gas,
permanence class). To ensure spatial independence among                  grazing, and roads; and (4) pond permanence – watershed,
sampled wetlands and their relationship to land cover as well            hydroperiod, permanence class, catchment and wetland. We
as coincide with previous analysis of open-water wetlands                used “OR” operators between key words under the same
(Ridge et al., 2017), topography (Branton et al., 2020) and              class and “AND” operators between each key word class. To
land cover (Evans et al., 2017), we did not select wetlands              characterize topography, we selected variables that are com-
that were within 1000 m of another selected wetland.                     monly used to describe topographic variations, based on a
   The distribution of wetland sizes was strongly right-                 previous review (Branton and Robinson, 2019). Details and
skewed across the three natural regions of interest (Ap-                 results from this review are reported in Table 2.
pendix A). Wetlands were typically small, with Boreal For-
est Natural Region wetlands possessing the largest median                2.3.1    Climate
size (2.26 ha), followed by Parkland Natural Region wetlands
(1.54 ha) and Grassland Natural Region wetlands (0.58 ha),               We acquired 2013–2014 daily weather data from the Agro-
though size varies with permanence class (Appendix A). In                Climatic Information Service of Alberta to calculate cli-

https://doi.org/10.5194/bg-19-1547-2022                                                             Biogeosciences, 19, 1547–1570, 2022
1550                                                                           J. Daniel et al.: Climate, land cover and topography

Table 2. List of annual data on climate, land cover and land use, and terrain metrics used to predict wetland permanence class. In this table,
we include a description of the significance of each metric for the wetland hydroperiod and the proxy metrics we selected. For our analysis,
winter months range from November to February, spring from April to May, and summer from June to August. We used Web of Science
to conduct this review, limiting the search to papers published between 1950 and 2018, as well as key words for (1) the PPR – Prairie
Pothole Region, Northern Great Plains, Alberta, Saskatchewan, Manitoba and Dakota; (2) weather – climate, temperature and precipitation;
(3) disturbance – land use, agriculture, disturbance, oil and gas, grazing, and roads; and (4) pond permanence – watershed, hydroperiod,
permanence class, catchment and wetland. We used “OR” operators between key words under the same class and “AND” operators between
each key word class. For the terrain metrics, we used selected metrics that are commonly used to describe topographic variations, based on a
previous review (Branton and Robinson, 2019). Notably, Branton and Robinson (2019) employed controls on collinearity, including principal
component analysis (PCA).

  Category                    Variable                  Significance for wetland hydroperiod/formula               Proxy/class∗
  Climate                     Snowpack/winter pre-      Snowpack accounts for 30 %–60 % of ponded water            Total spring
                              cipitation                amounts (Hayashi et al., 1998; Tangen and Finocchiaro,     precipitation.
                                                        2017).                                                     Total winter
                                                        Longer hydroperiods with higher winter precipitation       precipitation.
                                                        (Collins et al., 2014).                                    Total precipitation
                                                                                                                   in winter and spring.
                                                                                                                   Total spring snowpack.
                                                                                                                   Total winter
                                                                                                                   snowpack.
                                                                                                                   Total snowpack
                                                                                                                   in winter and spring.
                              Summer precipitation      Longer hydroperiods from increased summer precipita-       Total summer
                                                        tion (Clare and Creed, 2014; Eisenlohr, 1972; Euliss et    precipitation.
                                                        al., 2014; Leibowitz and Vining, 2003).
                              Summer temperature        Evapotranspiration rates/water losses higher in summer     Average maximum
                                                        (from June) (Heagle et al., 2007).                         temperature in June.
                                                                                                                   Average maximum
                                                                                                                   temperature in July.
                                                                                                                   Average maximum
                                                                                                                   temperature
                                                                                                                   in summer.
                              Winter/spring/summer      Snowpack may melt too fast with warmer conditions          Average maximum
                              temperature               (Crosbie et al., 2013).                                    temperature in spring.
                                                                                                                   Average maximum
                                                                                                                   temperature in winter.
                                                                                                                   Average maximum
                                                                                                                   temperature in
                                                                                                                   spring and winter
                              Precipitation timing      Fewer wetlands dry up when summer precipitation            Proportion of summer
                                                        is earlier in the summer (Meyers, 2018; Vinet and          precipitation in June
                                                        Zhedanov, 2011).
  Land use and land cover     Natural vegetation        Loss of natural cover increases surface runoff             % Natural cover
                                                        (Wiltermuth and Anteau, 2016)
                              Cropland cover            Because soil is less porous (more compacted), much         % Cropland cover
                                                        of the accumulated water, either from the snowpack or
                                                        spring/summer precipitation, flows into the wetland –
                                                        this increases water levels (van der Kamp et al., 2003;
                                                        Voldseth et al., 2007).
                              Urban cover               Longer hydroperiods in urban landscapes, mostly be-        % Urban cover and bare
                                                        cause of higher runoff (when compared to those in crop-    ground
                                                        lands) (Fossey and Rousseau, 2016).
                              Grazing                   Grazing lowers snow accumulation (Willms                   % Pastureland
                                                        and Chanasyk, 2013), which can increase runoff and hy-
                                                        droperiod (Collins et al., 2014; Niemuth et al., 2010).

Biogeosciences, 19, 1547–1570, 2022                                                           https://doi.org/10.5194/bg-19-1547-2022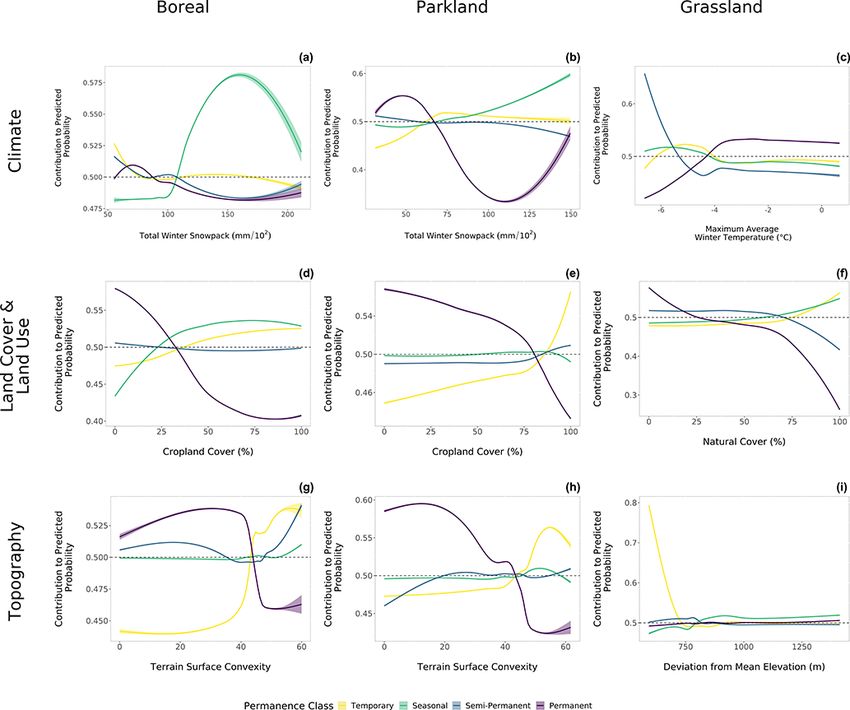
J. Daniel et al.: Climate, land cover and topography                                                                                                                    1551

Table 2. Continued.

  Category                          Variable                        Significance for wetland hydroperiod/formula                              Proxy/class∗
  Land use and land cover           Culverts/roads                  Lowers hydroperiods by blocking surface runoff                            Distance to road
                                                                    (Shaw et al., 2012).
                                    Tilling                         Can lower pond area/depth, and by extension hydrope-                      % Cropland cover
                                                                    riod, as increases in sedimentation can in fill ponds (Sk-
                                                                    agen et al., 2016).
  Terrain metrics                   Mean elevation                  |Elevation−Elevationmean |2                                               Local
                                    (DEM) – deviation
                                                                    qP
                                                                          (Elevation−Elevationmean )
                                    Elevation (DEM) –                                n                                                        Local
                                    standard deviation
                                                                    qP
                                                                          (Profile Curvature−Profile Curvaturemean )
                                    Profile curvature                                        n                                                Local
                                    (PC) – standard
                                    deviation
                                                                    qP
                                                                          (Slope−Slopemean )
                                    Slope – standard                             n                                                            Local
                                    deviation
                                    Terrain surface                 Percentage of upwardly convex cells within the moving                     Global
                                    convexity                       window (Iwahashi and Pike, 2007).
                                    Terrain surface                 Relative frequency of pits and peaks in a 100 × 100 m                     Global
                                    texture                         moving window (Iwahashi and Pike, 2007).
                                                                     Elevationmean −Elevationmin
                                    Topographic position             Elevationmax −Elevationmin                                               Local
                                    index
                                    Slope variability               Slopemax −Slopemin                                                        Local
This differentiates terrain metrics by global (estimated using a 100 × 100 m moving window and mean value within 500 m buffer recorded) and local (estimated within a 500 m
buffer of the wetland).

mate variables. These data include precipitation and temper-                              Appendix B). Importantly, the influence of climate variables
ature measurements from 7914 weather stations across the                                  on wetland permanence classes will exhibit time lags depen-
province, observed from October 2013 to August 2014. We                                   dent on site-specific factors, such as soil storage, ground wa-
calculated seasonal precipitation totals and temperature av-                              ter movement and vegetation succession within catchments.
erages from a compilation of proxy variables (Table 2) at                                 Consequently, the temporal window of relevant weather
each station. Then, using a simple inverse distance weight-                               would also be site-specific, and we lack a defensible justifica-
ing (Tarroso et al., 2019), we interpolated climate variables                             tion on which to base a threshold for including or excluding
at the center of each wetland in R (R Core Team, 2019).                                   annual data on climate variables. Coupled with the typical
   We used annual data on climate variables in this anal-                                 nature of 2014’s annual data on climate variables, we elected
ysis because it was available at a fine spatial resolution                                to use the single year as representative of average conditions
and corresponded with the 2014 land cover and topogra-                                    in our study area and maximize comparability to our 2014 to-
phy data we used. Additionally, 2014 was a typical year                                   pography and land use data. We suggest future research could
in terms of climate variables. For example, we found no                                   seek to elucidate how legacy effects of climate and land use
significant difference in mean annual precipitation between                               may influence wetland permanence classes.
the 1981–2010 climate normal and the annual data from
2013–2014 (paired t tests for the Grassland Natural Re-                                   2.3.2      Land cover and land use
gion: t9 = 1.833, p value = 0.652; and for the Parkland Nat-
ural Region: t9 = 1.833, p value = 0.344) or from 2014–                                   Prior research in the PPR identified a strong concordance
2015 (paired t tests for the Grassland Natural Region: t9 =                               between land cover within 500 m of wetlands and wet-
1.833, p value = 0.878; and for the Parkland Natural Re-                                  land physicochemical conditions (Kraft et al., 2019). Using
gion: t9 = 1.833, p value = 0.315) in either the Grassland or                             land cover data from Agriculture and Agri-Food Canada’s
Parkland Natural Region (cumulative precipitation plots in                                (AAFC) Annual Crop Inventory for 2014 (Agriculture and
                                                                                          Agri-Food Canada, 2014), we calculated the proportion of

https://doi.org/10.5194/bg-19-1547-2022                                                                                  Biogeosciences, 19, 1547–1570, 2022
1552                                                                        J. Daniel et al.: Climate, land cover and topography

Figure 1. Extents of the Central and Southern wetland inventories (Government of Alberta, 2014) used to delineate wetlands in our study.
We selected wetlands from three natural regions – Boreal Forest (12 0000), Parkland (12 0000) and Grassland (16 0000); natural region
boundaries are sourced from the Government of Alberta (Government Alberta, 2016). These wetlands are within the southern Alberta Prairie
Pothole Region. There are 356 246 wetlands delineated in the Southern Inventory and 253 873 in the Central Inventory. DEM data provided
by AltaLIS (2015).

each land cover class within a 500 m buffer of each wetland           eas only within 500 m of the wetland boundary. With global
(Table 2). In addition to land cover characteristics, we also         variables, we applied a 100 × 100 m moving window and
measured the distance of each wetland centroid to the near-           computed the mean value within the 500 m buffers (Table 2).
est road using the National Road Network from the Gov-
ernment of Canada (Statistics Canada, 2010). The landscape            2.4   Data analysis
fragmentation created by road networks has been shown to
alter hydrological flow and divert surface runoff (Shaw et al.,       We aimed to quantify the relative contribution of annual data
2012) such that wetlands in proximity to roads typically have         on climate variables, land cover/land use, and topography
shorter hydroperiods. We estimated these land cover and land          for different wetland permanence classes and determine the
use variables in ArcMap 10.4.1 (ESRI, 2012).                          ability of these drivers to predict wetland permanence class.
                                                                      Achieving these two outcomes involved four steps: reducing
                                                                      the number of variables to an orthogonal and parsimonious
2.3.3   Topography
                                                                      set for application, visualizing if wetlands could be parti-
                                                                      tioned based on their permanence class, parametrizing and
We quantified topographic characteristics of the landscape
                                                                      calibrating a predictive model, and then predicting perma-
surrounding each wetland using a 25 m digital elevation
                                                                      nence class and assessing model fit. These analyses were per-
model (DEM) for southern and central Alberta (AltaLIS,
                                                                      formed in R (R Core Team, 2019), and while they quantify a
2015) (Fig. 1). We estimated eight terrain variables (Table 2)
                                                                      relationship among our independent variables with wetland
using ArcMap 10.4.1 (ESRI, 2012) and SAGA 2.3.2 (Conrad
                                                                      permanence, they do not infer causation.
et al., 2015). These variables may be grouped as those with
local (e.g., standard deviation of slope) versus global (e.g.,
terrain surface convexity) application (Branton and Robin-
son, 2019). For local variables, we applied the formula to ar-

Biogeosciences, 19, 1547–1570, 2022                                                       https://doi.org/10.5194/bg-19-1547-2022
J. Daniel et al.: Climate, land cover and topography 1553
2.4.1 Predicting wetland permanence class within their metric class. Based on a maximum allowable
correlation Pearson correlation of 0.9, we reduced our 30
We used an extreme gradient boosting model to predict wet- metrics to 19 that reflected climate (7), land cover/land
land permanence class for each natural region based on use (4) and topography (8) (Table 2). Next, we incorporated
a combination of annual data on climate variables, land these 19 variables into a PCA to explore partitioning of per-
cover/land use and topography variables (Appendix C). Ex- manence classes in accordance with the annual data on cli-
treme gradient boosting is considered a more robust predic- mate, land cover, and topography variables and to facilitate
tive tool than random forest (Sheridan et al., 2016). Like comparison among the three natural regions. Wetlands in the
random forest, extreme gradient boosting creates an ensem- Grassland Natural Region appeared to be better aligned with
ble of decision trees that partition data based on a specified all three domains than the wetlands in the southern Boreal
grouping (Hastie et al., 2009; McCune et al., 2002), which Forest and Parkland natural regions (Fig. 2).
in our case is wetland permanence class. In the first deci-
sion tree, all observations are equally weighted (Cutler et al., 3.2 Model performance
2007). The second decision tree attempts to correct for mis-
classifications derived from the first tree, assigning a higher We built an extreme gradient boosting model for each natu-
weight to observations that were difficult to classify. Each ral region (southern Boreal Forest, Parkland and Grassland)
subsequent tree attempts to minimize model error by classi- in our study area. Our models had moderate to high er-
fying these error-prone observations (Cutler et al., 2007). The ror rates for both the training (43 %–50 %) and test datasets
use of the minimum error to build a model ensemble makes (48 %–61 %; Appendix D), which indicates a balance be-
extreme gradient boosting models prone to overfitting (Cut- tween bias and overfitting. Clearly, annual data on climate,
ler et al., 2007). To correct for overfitting, extreme gradient land use/cover and topography alone are not sufficient to per-
boosting models include a regularized object that penalizes fectly predict wetland permanence class. We conclude that
more complex trees (Chen and Guestrin, 2016). We used rel- while our models are useful in ranking the relative impor-
atively low learning rates (< 0.1) and restricted tree depths tance of climate, land cover/land use and topography vari-
(5–7) to balance overfitting and bias in our model ensembles ables in predicting wetland permanence class, they are not
(Appendix D). a comprehensive overview of the factors determining perma-
After parametrizing the model, we predicted wetland per- nence class of a given wetland (see Sect. 4.5). Notably, we fo-
manence class in the (1) southern Boreal Forest, (2) Parkland cus on the context of each wetland (surrounding topography,
and (3) Grassland natural regions. For each model, we also land cover/land use and climate) rather than wetland-specific
assessed its performance using test data (70 : 30 training to properties that would influence permanence class (e.g., basin
test ratio) to determine the misclassification error rate, com- morphology).
paring results between training and test data. Importantly,
misclassification error rates reflect the proportion of sites 3.3 Relative importance of variables in predicting
classified as a permanence class by the models that differs wetland permanence class among natural regions
from the permanence class assigned it in the wetland inven-
tory and thus assumes that the inventory accurately classi- In the Parkland and Grassland natural regions, annual data on
fies each wetland. It also does not differentiate between the climate explained the greatest amount of variance in wetland
misclassification of a temporary wetland as seasonal (per- permanence class, based on relative gain values (Fig. 3a–
haps a minor error) and the misclassification of a tempo- c). As anticipated, our results suggest that climate condi-
rary wetland as permanent (a major error). Consequently, we tions vary systematically among the natural regions (Fig. 4a–
also broke misclassification rates down by inventory class d). Among the climate variables included in our analyses,
for each model. We also evaluated the relative importance of spring temperature (Boreal Forest Natural Region: 6.87 ◦ C
each variable in predicting permanence class by comparing [0.425 SD]; Parkland Natural Region: 6.85 ◦ C [0.206 SD];
gain values and assessed under which ranges of each variable Grassland Natural Region: 8.14 ◦ C [0.892 SD]) explained
a permanence class was more likely to occur with waterfall the highest magnitude of variance in predicting permanence
plots. class in the Grassland Natural Region (Figs. 3a, 2c) but
was less important in the southern Boreal Forest and Park-
land natural regions where values are less extreme (Fig. 4a).
3 Results Winter snowpack (Boreal Forest Natural Region: 92.15 cm
[20 SD]; Parkland Natural Region: 67.65 cm [14.99 SD];
3.1 Selecting variables Grassland Natural Region: 42.14 cm [15.06 SD]) explained
the highest magnitude of variance in predicting permanence
Before predicting wetland permanence class based on land class in the southern Boreal Forest and Parkland natural re-
use and land cover, topography, and annual data on climate gions, and these amounts were distinctly lower in the warmer
variables, we first determined which metrics were collinear Grassland Natural Region (Fig. 4c).
https://doi.org/10.5194/bg-19-1547-2022 Biogeosciences, 19, 1547–1570, 20221554 J. Daniel et al.: Climate, land cover and topography Figure 2. Principal components analysis for wetlands delineated in the (1) Boreal Forest (totalling 12 000 wetlands), (2) Parkland (totalling 12 000 wetlands) and (3) Grassland (totalling 16 000 wetlands) natural regions. PCAs apply an orthogonal transformation to summarize the data into axes that explain the variance between two correlation matrices. Our data were scaled before implementing the PCA. Vectors on climate (a–c), land use and land cover (d–f), and terrain roughness (g–i) show correlations with both axes. Axis 2, for all datasets, represents a hydroperiod gradient, and terrain roughness is represented on axis 1. Land cover/land use was the second most important cat- land natural regions (Fig. 5d–e), but wetlands surrounded by egory of drivers of wetland permanence class, following natural vegetation had shorter hydroperiods in the Grassland annual data on climate in the Grassland Natural Region Natural Region (Fig. 5f). (Fig. 3f), but not in the southern Boreal Forest or Parkland Topography was the most important category of drivers of Natural Region (Fig. 3). Yet, unlike climate, land cover/land wetland permanence class in the southern Boreal Forest and use did not vary systematically among the three natural re- second most important in the Parkland Natural Region, and gions (Fig. 4e–h). Wetlands surrounded by cropland had the order of importance for the terrain metrics was nearly the shorter hydroperiods in the southern Boreal Forest and Park- same in both natural regions (Fig. 3g–i). Though topography Biogeosciences, 19, 1547–1570, 2022 https://doi.org/10.5194/bg-19-1547-2022
J. Daniel et al.: Climate, land cover and topography                                                                                      1555

Figure 3. Variables ranked by their importance in the extreme gradient boosting models for wetlands delineated in the (1) Boreal Forest
(totalling 12 000 wetlands), (2) Parkland (totalling 12 000 wetlands) and (3) Grassland (totalling 16 000 wetlands) natural regions. These
variables were proxies for climate (a–c), land cover and land use (d–f), and topography (g–i). The gains illustrate the relative contribution of
each variable in the model – the higher the value, the greater the importance.

metrics were the least important category in the Grassland                cover/land use. Generally, across the three natural regions,
Natural Region (Fig. 3i), apart from deviation from mean el-              wetlands with shorter hydroperiods (e.g., temporary and sea-
evation (Fig. 4i), variables associated with topography did               sonal) were typically situated in landscapes with higher
not systematically vary among natural regions (Fig. 4j–l).                spring snowpack amounts (Fig. 3a–c) and spring tempera-
                                                                          tures (e.g., Fig. 5a). Longer hydroperiod wetlands were typi-
3.4   Wetland permanence class in the Boreal Forest,                      cally situated in landscapes with more summer precipitation
      Parkland and Grassland natural regions                              and lower spring temperatures (e.g., Fig. 5c), occupying rel-
                                                                          atively low topographic positions with low terrain convexity
Our findings suggest that wetland permanence class in the                 (e.g., Fig. 5g, h), and, in the Grassland Natural Region, were
Prairie Pothole Region of Alberta correlates with climate,                sometimes surrounded by less natural cover (Fig. 5f), though
topography and, to a lesser extent, to surrounding land

https://doi.org/10.5194/bg-19-1547-2022                                                             Biogeosciences, 19, 1547–1570, 2022
1556 J. Daniel et al.: Climate, land cover and topography
Figure 4. Frequency distribution of the top four climate, land cover and land use, and topography variables by natural region.
in the southern Boreal Forest Natural Region they were more the only element correlated with wetland permanence class in
common where cropland was less than 25 % cover (Fig. 5d) Alberta’s PPR – our analysis used a relatively coarse DEM
and less than 75 % in the Parkland Natural Region (Fig. 5e). (25 m), and we nonetheless found that topography was im-
Interestingly, the relative importance of variables in predict- portant in predicting permanence class. Consequently, failure
ing the occurrence of both shorter- and longer-hydroperiod to consider topography limits our understanding about the
wetlands was shared, and this agreement was strongest be- extent to which hydroperiod, and therefore wetland perma-
tween the southern Boreal Forest and Grassland natural re- nence class, may change in response to climate change. We
gions (Appendices F and H). speculate that the use of finer-scale elevation models derived
from high-resolution lidar (e.g., 1 m) or remotely piloted air-
craft (e.g., 2–5 cm) will reveal even greater importance of to-
4 Discussion pography in surface runoff and wetland hydroperiod, partic-
ularly in the Grassland Natural Region, where wetlands were
Our findings support the assertion of other published studies typically smaller and topographic variation relatively subtle.
(e.,g., Fay et al., 2016; Johnson et al., 2010, 2005; Johnson
and Poiani, 2016; Reese and Skagen, 2017; Werner et al., 4.1 Importance of climate
2013; McKenna et al., 2019), which conclude that climate
change will affect wetland hydroperiod or permanence class. The sensitivity of wetland hydroperiods to annual climate
We anticipate that reduced winter snowpack will dry out data is corroborated in existing literature, which emphasizes
temporarily and seasonally ponded wetlands, while warmer that the semi-arid climate drives the region’s sensitivity to cli-
spring temperatures will reduce the hydroperiod of more per- mate change (Fay et al., 2016; Johnson et al., 2004; Schnei-
manently ponded wetlands. Yet, annual data on climate is not der, 2013). In the southern Boreal Forest and Grassland nat-
Biogeosciences, 19, 1547–1570, 2022 https://doi.org/10.5194/bg-19-1547-2022J. Daniel et al.: Climate, land cover and topography 1557 Figure 5. Partial dependence plots for the four wetland classes – temporary, seasonal, semi-permanent and permanent based on top metrics. Predicted probabilities below 0.5 suggest that at this measured value of the metric observing that permanence class is unlikely. We show 95 % confidence intervals and used a generalized additive model-based trend line. Probabilities were derived from extreme gradient boosting models for wetlands delineated in the (1) Boreal Forest (totalling 12 000 wetlands), (2) Parkland (totalling 12 000 wetlands) and (3) Grassland (totalling 16 000 wetlands) natural regions. ural regions, regions with warmer spring temperatures are snowpack amounts (Fig. 5b). Because climate forecasts sug- likely to experience an earlier onset of spring snowmelt, gest that warmer springs and changes in precipitation tim- higher water deficits (Schneider, 2013; Zhang et al., 2011) ing are likely (Zhang et al., 2011), our finding that climate and lower pond permanence classes for wetlands, whereas was the most important domain of variables in predicting cooler peak spring temperatures favour greater pond perma- permanence class supports previous studies that suggest PPR nence in these natural regions. In the southern Boreal For- wetlands are sensitive climate change (Johnson et al., 2010; est and Parkland natural regions, winter snowpack depth was Paimazumder et al., 2013; Schneider, 2013; Viglizzo et al., the most important climate variable, and this we attribute 2015; Zhang et al., 2011). to temporarily and seasonally ponded wetlands requiring a minimum threshold of winter snowpack amount to persist, whereas permanently ponded wetlands also benefit from pre- cipitation in other seasons and so can exist at lower winter https://doi.org/10.5194/bg-19-1547-2022 Biogeosciences, 19, 1547–1570, 2022
1558                                                                    J. Daniel et al.: Climate, land cover and topography

4.2    Importance of topography                                   tion intercepts snow-sourced surface runoff (Anteau, 2012;
                                                                  van der Kamp et al., 2003; Voldseth et al., 2007), which can
Despite recognition that topography is a useful proxy in          account for up 27 % of ponded water amounts (van der Kamp
wetland mapping (Branton and Robinson, 2019; Los Huer-            et al., 2003).
tos and Smith, 2013) and that topography must influence              Because some landscapes in the PPR are flatter than others
surface-runoff-generating processes that are essential to wet-    (Schneider, 2013), and land use activities can modify the ter-
land function (Hayashi et al., 2016; Mushet et al., 2018),        rain (Anteau, 2012; Wiltermuth and Anteau, 2016; Anteau et
the relative importance of topography in hydrological pro-        al., 2016), our findings do highlight the importance of consid-
cesses is somewhat debated (Devito et al., 2005). Simula-         ering land use in forecasting the impacts of climate change
tions predicting the influence of climate change on the size      on PPR wetlands. The Boreal Forest and Parkland Natural
and isolation of prairie pothole wetlands have focused on cli-    Region wetlands have stronger overlaps in topography met-
mate and land cover/land use (Anteau et al., 2016; Chasmer        rics and annual data on climate, and, as a result, differences
et al., 2012; Conly et al., 2001; Johnson and Poiani, 2016;       in land use within these regions may be integral in deter-
McCauley et al., 2015; Steen et al., 2016; Voldseth et al.,       mining future shifts in the frequency distribution of perma-
2007). Consequently, (1) there is a lack of research quanti-      nence classes. Forecasts for the province of Alberta suggest
fying topographic characteristics of wetlands and the land-       there will be expansions in the agricultural industry within
scapes within which they occur; (2) links between topog-          the next decade (Government of Alberta, 2015), and this sug-
raphy, vegetation and wetland condition have not been rig-        gests that climate impacts on Albertan PPR wetlands will be
orously studied; and (3) policy and guidelines on wetland         compounded by land use activities.
mitigation and compensation prescribe width-to-length ra-
tios and slopes that are characteristic of permanently ponded     4.4   Topographic position of wetlands by permanence
wetlands (Environmental Partnerships and Education Branch               class
Alberta, 2007), which are less abundant in all three natural
regions (Table 1). Despite remaining numerically more abun-       Semi-permanent and permanently ponded wetlands typically
dant, small and more temporarily ponded wetlands are being        occur in regional or spatial neighbourhood topographic lows
preferentially lost in Alberta’s Prairie Pothole Region (Serran   (as opposed to simply local depressions, e.g., perched wet-
et al., 2017). If we had a better understanding of how topo-      lands), likely because they (1) can hold larger volumes of
graphic structure determines wetland hydrology/function, we       ponded water (i.e., larger pond size/volume, Novikmec et al.,
could revise policy and regulations governing wetland man-        2016) and (2) receive higher volumes of water inputs from
agement to ensure we better match natural landscapes in their     the surrounding landscape (e.g., surface runoff, groundwa-
frequency and distribution of wetland permanence classes.         ter, Euliss et al., 2004, 2014; LaBaugh et al., 1998; Toth,
                                                                  1963). We are unable to partition the natural hydrogeolog-
4.3    Importance of land cover/land use                          ical effects of topographic position on wetland permanence
                                                                  class from the effects of human alteration of the surrounding
Existing literature identified land cover/land use as the sec-    landscape, yet the importance of topographic position to wet-
ond greatest driver of wetland conditions following climate       land permanence class is likely reinforced by consolidation
(Anteau et al., 2016). In the Grassland Natural Region, the       drainage when wetlands situated higher in the landscape are
terrain is relatively flat compared to the southern Boreal For-   drained and the water is redirected to wetlands positioned
est and Parkland natural regions (Alberta Tourism Parks and       lower in the landscape (McCauley et al., 2015; Wiltermuth
Recreation, 2015). Consequently, after the important role of      and Anteau, 2016). Because of consolidation drainage, we
annual data on climate in the more arid Grassland Natu-           may observe increases in the hydroperiod of wetlands in to-
ral Region (Government et al., 2014), land cover/land use         pographic lows of the wetlandscape (e.g., sites with low topo-
might be a stronger driver of permanence class than topog-        graphic position index values). In the arid but heavily farmed
raphy. Importantly, the percent cover of natural vegetation is    Grassland Natural Region, consolidation drainage can elim-
typically low in the Grassland Natural Region, where most         inate temporary and seasonally ponded wetlands from areas
land has been converted to cropland or pastureland (Alberta       with limited remaining natural cover (Serran et al., 2017).
Tourism Parks and Recreation, 2015). Combined with the            This aligns with our model results: although the probability
process of consolidation drainage, which shunts water from        of observing a permanent or semi-permanent class wetland
scattered low hydroperiod wetlands, concentrating it in larger    was greatest at the lower end of the range of crop cover in
more permanently ponded wetlands downstream (McCauley             our landscapes, the threshold of crop cover above which wet-
et al., 2015), this leads to Grassland Natural Region land-       lands were most probably seasonal or temporary in class was
scapes with more natural cover being more likely to con-          higher in the Grassland Natural Region, lower in the Park-
tain temporary and seasonal wetlands. Thus, wetlands sur-         land Natural Region and lowest in the Boreal Forest Natural
rounded by natural vegetation may have shorter hydroperi-         Region. Thus, we recommend that future research investigate
ods because cropland resists infiltration and natural vegeta-     the role of topographic position on permanence class, in the

Biogeosciences, 19, 1547–1570, 2022                                                 https://doi.org/10.5194/bg-19-1547-2022
J. Daniel et al.: Climate, land cover and topography 1559
absence of human disturbance to control for the influence of contribution will not change the qualitative outcome of the
consolidation drainage. presented analysis; (2) previous research found that physio-
chemical conditions in a wetland are quite congruent with
4.5 Model error surrounding land cover of the same year with only minor
differences when catchments were defined with 10 m versus
Our model misclassification error rates were relatively 25 m resolution DEMs (Kraft et al., 2019); and (3) there was
high (Appendix D), indicating imperfect matching between no detectible difference in wetland catchment size when they
model-predicted permanence class and inventory-reported were derived from DEMs of low (10 m) versus high (3 m)
permanence class for our study wetlands. One key source resolution (McCauley and Anteau, 2014).
of uncertainty in our analysis is that the accuracy of the in- Lastly, wetland permanence classes are ordinal, and con-
ventory in assigning wetlands a given permanence class is sequently not all misclassifications are equal. From an eco-
not validated, and in interpreting our model error we must hydrological perspective, a discrepancy between model-
assume that the permanence classes we derived from the in- predicted and inventory-reported permanence class can be
ventories are correct, though we know the two inventories minor (e.g., temporary vs. seasonal) or major (e.g., tempo-
differ in their mapping accuracy (Evans et al., 2017). Yet, rary vs. permanent), and this is not accounted for in the
we hypothesize that our inability to account for soil char- overall misclassification error rate. When we investigate the
acteristics (Schneider, 2013) and bathymetry (Huertos and class-based misclassification error rates, it is apparent that
Smith, 2013) likely contributes to misclassification by our all models were most successful in classifying wetlands at
models (Appendix D). Schneider (2013) stated that within the extreme ends of the permanence class spectrum, and mis-
natural regions, both elevation (which we did account for) classification error rates were higher for seasonal and semi-
and soil characteristics can vary across the landscape. As permanent wetlands (Appendix D). Interestingly, the Grass-
such, wetlands situated similarly in the landscape may not land Natural Region model tended to misclassify seasonal
have the same soil characteristics, and soil characteristics are wetlands as temporary and semi-permanent wetlands as per-
understood to influence wetland hydrology by dictating the manent (i.e., misclassified into adjoining classes), whereas
proportion of incident precipitation that is converted to sur- the Parkland Natural Region model tended to misclassify
face run of Hayashi et al. (2016). Though Schneider (2013) seasonal and semi-permanent wetlands more evenly across
also mentioned an influence of disturbance history on ecosys- the three other permanence classes. Overall, these extreme
tems, prior work in our study region reported no temporal lag gradient boosting models are valuable for comparing the rel-
in wetland environmental conditions and surrounding land ative importance of the climate, topographic and landscape
cover (Kraft et al., 2019). domains of predictor variables, despite misclassification er-
The lack of extensive data on basin morphology identi- ror rates.
fies a gap that would enrich the presented research by en-
abling direct classification of wetland permanence from raw
bathymetric data. Such data would likely reduce the mis- 5 Conclusions
classification error rates of our ensemble models, which rely
Because some landscapes in the PPR are flatter than others
only on annual data on climate, land use and topography
(Schneider, 2013) and land use activities can modify topog-
in predicting wetland permanence. Furthermore, these data
raphy (Anteau, 2012; Anteau et al., 2016; Wiltermuth and
would provide added value to those conducting research on
Anteau, 2016), our findings also highlight the importance of
above- and below-ground hydrologic connectivity and con-
considering land use in forecasting the impacts of climate
tributing areas (e.g., Chen et al., 2020), as well as those eval-
change on PPR wetlands. The southern Boreal Forest and
uating the impacts of climate change on wetland permanence
Parkland Natural Region wetlands are most congruent in the
and subsequently flora and fauna health and resilience (e.g.,
relative importance of climate and topography variables, and,
LaBaugh et al., 2018). As new technologies for mapping wet-
as a result, differences in land use within these regions may
land bathymetry become more widely available (e.g., bathy-
be integral in determining future shifts in the frequency dis-
metric lidar; Paine et al., 2015; Wang and Philpot, 2007), an
tribution of permanence classes. Forecasts for the province
opportunity will exist to better understand the link between
of Alberta suggest expansion in the agricultural industry over
wetland pattern and process.
the next decade (Government of Alberta, 2015), which sug-
Potentially some proportion of model error can be at-
gests that climate impacts on Alberta’s PPR wetlands will be
tributed to the use of a single year of climate and land use
compounded by changes in land use activities.
data as well as our relatively coarse (25 m) digital eleva-
tion model. However, it is likely that the contributions of
these factors are minimal given that (1) the climate data used
(year 2014) is representative of average conditions, coincides
with fieldwork, and yielded the strongest among the vari-
ables interrogated, and therefore improving the quality of its
https://doi.org/10.5194/bg-19-1547-2022 Biogeosciences, 19, 1547–1570, 20221560 J. Daniel et al.: Climate, land cover and topography Appendix A Table A1. Frequency distribution of wetland sizes in the Boreal Forest, Grassland and Parkland natural regions. Data on wetland sizes were acquired from the Alberta Merged Wetland Inventory (Government of Alberta, 2014). Biogeosciences, 19, 1547–1570, 2022 https://doi.org/10.5194/bg-19-1547-2022
J. Daniel et al.: Climate, land cover and topography                                                                              1561

Appendix B

Figure B1. Comparison of cumulative precipitation in the (a) Grassland and (b) Parkland natural regions between 2013–2015 to the climate
normal. Note that data were not available for the southern portion of the Boreal Forest Natural Region of interest in our study.

https://doi.org/10.5194/bg-19-1547-2022                                                       Biogeosciences, 19, 1547–1570, 2022
1562                                                                           J. Daniel et al.: Climate, land cover and topography

Appendix C

Table C1. List of parameters tuned for the extreme gradient boosting model, a description of these parameters, their ranges and the ranges
evaluated in our cross validation.

                      Parameter                  Description                                  Range
                      Learning rate              Used to control the contribution of each     Typical: 0–1
                                                 tree to model. Lower values result in the    Model: 0–0.3
                                                 model being more robust to overfitting.      Boreal Forest (0.01);
                                                                                              Parkland (0.1); Grass-
                                                                                              land (0.05)
                      Gamma                      This controls the complexity of the          Typical: 0–20
                                                 model. It determines how much loss           Model: 0–10
                                                 (difference between prediction and ob-       Boreal Forest (8);
                                                 servation) is allowable for the formation    Parkland (4); Grassland
                                                 of a new node.                               (10)
                      Maximum depth of           This sets the maximum number of              Typical: 1–7
                      a tree                     nodes that can exists between the tree       Model: 1–7
                                                 root and leaves. The larger the value, the   Boreal Forest (5);
                                                 more likely a tree is to overfit.            Parkland (7); Grassland
                                                                                              (7)
                      Minimum sum of             This sets a minimum weight/purity of         Typical: 1–7
                      instance weight            data (e.g., number belonging to a given      Model: 1–7
                      needed in a child          group) for spiting to create a new node      Boreal Forest (5);
                                                 in a tree. The higher this number is, the    Parkland (3); Grassland
                                                 more conservative the algorithm will         (7)
                                                 be.
                      Subsample ratio of the     This sets the number of rows (frac-          Typical: 0–1
                      training instance          tional) that should be included in build-    Model: 0.6–1
                                                 ing a tree.                                  Boreal Forest (0.8);
                                                                                              Parkland (0.65); Grass-
                                                                                              land (0.7)
                      Subsample ratio of         This sets the number of predictors (frac-    Typical: 0–1
                      columns when               tional) that should be considered in each    Model: 0.6–1
                      constructing each tree     tree.                                        Boreal Forest (0.8);
                                                                                              Parkland (1); Grassland
                                                                                              (0.9)

Biogeosciences, 19, 1547–1570, 2022                                                           https://doi.org/10.5194/bg-19-1547-2022
J. Daniel et al.: Climate, land cover and topography 1563
Appendix D
Table D1. Value of parameters used in extreme gradient boosting models for our three datasets, the misclassification error rates and number
of trees for our models.
Parameter Natural region
Boreal Forest Parkland Grassland
Learning rate 0.01 0.1 0.05
Gamma 4 6 8
Maximum depth of a tree 6 5 7
Minimum sum of instance weight needed in a child 1 5 7
Subsample ratio of the training instance 0.8 0.90 0.70
Subsample ratio of columns when constructing each tree 1.0 1.0 0.90
Misclassification error rate 49.6 (training) 50.1 (training) 42.9 (training)
60.6 (test) 59.7 (test) 47.8 (test)
Number of trees 37 52 46
Table D2. Breakdown of misclassification error by permanence class. Data reflect the percent of wetlands classified as a given permanence
class by the inventory (row) that the model classified as each permanence class (column). In general, models fared better at classifying
temporary and permanent wetlands and exhibited more misclassification errors in classifying wetlands that the inventory categorized as
seasonal or semi-permanent. Semi-permanent wetlands, in particular, tended to be under-predicted by the models.
Temporary (n = 3577) Seasonal (n = 3084) Semi-permanent (n = 1770) Permanent (n = 3569)
Boreal Forest Temporary (n = 3000) 52 24 10 13
Seasonal (n = 3000) 26 46 11 17
Semi-permanent (n = 3000) 26 18 28 27
Permanent (n = 3000) 14 15 9 62
Temporary (n = 3309) Seasonal (n = 2144) Semi-permanent (n = 1976) Permanent (n = 4571)
Parkland Temporary (n = 3000) 54 14 12 20
Seasonal (n = 3000) 24 34 14 28
Semi-permanent (n = 3000) 23 15 29 34
Permanent (n = 3000) 10 8 11 71
Temporary (n = 4208) Seasonal (n = 4025) Semi-permanent (n = 2981) Permanent (n = 4786)
Grassland Temporary (n = 4000) 60 19 8 14
Seasonal (n = 4000) 23 53 9 15
Semi-permanent (n = 4000) 12 16 45 27
Permanent (n = 4000) 11 13 12 64
https://doi.org/10.5194/bg-19-1547-2022 Biogeosciences, 19, 1547–1570, 20221564 J. Daniel et al.: Climate, land cover and topography Appendix E Figure E1. Variables ranked by their importance in the extreme gradient boosting models for wetlands delineated in the Boreal Forest (to- talling 12 000 wetlands) by permanence class. These variables were proxies for climate (a–d), land cover and land use (e–h), and topography roughness (i–l). The gains illustrate the relative contribution of each variable in the model – the higher the value, the greater the importance. Biogeosciences, 19, 1547–1570, 2022 https://doi.org/10.5194/bg-19-1547-2022
J. Daniel et al.: Climate, land cover and topography                                                                                      1565

Appendix F

Figure F1. Variables ranked by their importance in the extreme gradient boosting models for wetlands delineated in the Parkland Natural
Region (totalling 12 000 wetlands) by permanence class. These variables were proxies for climate (a–d), land cover and land use (e–h), and
topography roughness (i–l). The gains illustrate the relative contribution of each variable in the model – the higher the value, the greater the
importance.

https://doi.org/10.5194/bg-19-1547-2022                                                             Biogeosciences, 19, 1547–1570, 2022
1566                                                                             J. Daniel et al.: Climate, land cover and topography

Appendix G

Figure G1. Variables ranked by their importance in the extreme gradient boosting models for wetlands delineated in the Grassland Natural
Region (totalling 12 000 wetlands) by permanence class. These variables were proxies for climate (a–d), land cover and land use (e–h), and
topography roughness (i–l). The gains illustrate the relative contribution of each variable in the model – the higher the value, the greater the
importance.

                                                                          Disclaimer. Publisher’s note: Copernicus Publications remains
Code and data availability. The      data    and     code     for         neutral with regard to jurisdictional claims in published maps and
this     paper     are   published    online    with    Figshare:         institutional affiliations.
https://doi.org/10.6084/m9.figshare.18945248.v1     (Daniel    et
al., 2022).
                                                                          Acknowledgements. We thank Michael Anteau, Marcel Pinheiro
                                                                          and Roland Hall for their comments on an earlier draft of this pa-
Author contributions. RCR conceptualized the study, acquired              per and two anonymous reviewers for extremely helpful feedback.
funding and resources, supervised, and curated the data; DTR and          We are also grateful to Collin Branton for assistance in short-listing
JD gathered the data; JD analysed and visualized the data and wrote       topography variables, based on a prior review of the literature.
the original draft; all authors contributed to the investigation and
review and editing.
                                                                          Financial support. This research has been supported by Alberta In-
                                                                          novates (grant no. AI 2335) and the Ontario Trillium Foundation.
Competing interests. The contact author has declared that neither
they nor their co-authors have any competing interests.

Biogeosciences, 19, 1547–1570, 2022                                                            https://doi.org/10.5194/bg-19-1547-2022
You can also read