Climate Data for the City of Peterborough - Prepared for: City of Peterborough Prepared by: ICLEI Canada August 2018
←
→
Page content transcription
If your browser does not render page correctly, please read the page content below

Climate Data for the City of Peterborough

                      Prepared for: City of Peterborough
                              Prepared by: ICLEI Canada
                                           August 2018
2

Table of Contents
Glossary of Terms.......................................................................................................................................... 3
   Climate Indices .......................................................................................................................................... 5
Introduction .................................................................................................................................................. 7
Data Collection .............................................................................................................................................. 7
Climate Change Modelling and Downscaling................................................................................................ 7
Greenhouse Gas Emissions Scenarios ........................................................................................................... 8
   1) SRES Scenarios - IPCC Fourth Assessment Report (AR4) ...................................................................... 8
   2) RCP Scenarios - IPCC Fifth Assessment Report (AR5) ........................................................................... 8
   Time Periods ........................................................................................................................................... 10
Uncertainty ................................................................................................................................................. 10
Temperature ............................................................................................................................................... 10
   Ontario .................................................................................................................................................... 10
   City of Peterborough............................................................................................................................... 11
   Hot and Cold Days ................................................................................................................................... 12
   Freeze-Thaw ............................................................................................................................................ 14
   Growing Season Length .......................................................................................................................... 14
Precipitation................................................................................................................................................ 14
   Ontario .................................................................................................................................................... 14
   City of Peterborough............................................................................................................................... 15
Extreme Weather Events ............................................................................................................................ 16
   Heavy or Extreme Rain............................................................................................................................ 16
Water Levels ............................................................................................................................................... 19
   Lake Ontario ............................................................................................................................................ 19
   Water Temperatures............................................................................................................................... 21
Conclusion ................................................................................................................................................... 21
References .................................................................................................................................................. 22

3

Tables and Figures
Table 1: Climate Indices Definitions.............................................................................................................. 6
Table 2: IPCC Fifth Assessment Report Climate Change Scenario Characteristics ....................................... 9
Table 3: Seasonal timeframes ..................................................................................................................... 10
Table 4: Seasonal Temperature Change in Ontario for RCP 8.5 ................................................................. 11
Table 5: Baseline Mean Temperatures (1976-2005) for City of Peterborough .......................................... 11
Table 6: Projected Seasonal Temperature for City of Peterborough under RCP 8.5 .................................. 11
Table 7: Projected Hot and Cold Days for City of Peterborough under RCP8.5 ......................................... 13
Table 8: Growing Season Length for City of Peterborough under RCP8.5 ................................................. 14
Table 9: Seasonal Precipitation Change (%) in Ontario - RCP8.5 (Baseline 1986-2005) ............................. 14
Table 10: Baseline Mean Precipitation (1976-2005) for City of Peterborough .......................................... 15
Table 11: Projected Seasonal Precipitation for City of Peterborough under RCP 8.5 ................................ 15
Table 12: Baseline Precipitation Intensity Rates (mm/h) (1965-1992) for Station Peterborough STP ...... 17
Table 13: Projected Precipitation Intensity Rates (mm/h) for Station Peterborough STP. ........................ 18
Table 14: Mean surface temperature projections for Lake Ontario Basin ................................................. 21

Figure 1: Projected Global Warming for CMIP5 RCP Scenarios .................................................................... 9
Figure 2: Projected Seasonal Temperature Increase for City of Peterborough under RCP 8.5 .................. 12
Figure 3: Projected Hot and Cold Days for City of Peterborough under RCP8.5 ........................................ 13
Figure 4: Projected Seasonal Precipitation for City of Peterborough under RCP 8.5 ................................. 16
Figure 5: Baseline Precipitation Intensity Rates (mm/h) (1965-1992) for Station Peterborough STP. ...... 18
Figure 6: Projected Precipitation Intensity Rates (mm/h) for Station Peterborough STP. ......................... 19
Figure 7: Projected changes in Great Lakes Water Levels based on a 50-year average ............................. 20

Glossary of Terms
Definitions have been taken from the Intergovernmental Panel on Climate Change (IPCC)
(http://www.ipcc.ch/pdf/assessment-report/ar4/syr/ar4_syr_appendix.pdf), and Environment Canada
(http://www.ec.gc.ca/ges-ghg/default.asp?lang=En&n=B710AE51-1).

Baseline
A climatological baseline is a reference period, typically three decades (or 30 years), that is used to
compare fluctuations of climate between one period and another. Baselines can also be called references
or reference periods.
Computerized Tool for the Development of Intensity-Duration-Frequency Curves Under Climate Change
Version 3.0
The IDF_CC tool is designed as a simple and generic decision support system to generate local IDF curve
information that accounts for the possible impacts of climate change. It applies a user-friendly GIS
interface and provides precipitation accumulation depths for a variety of return periods and durations

4

and allows users to generate IDF curve information based on historical data, as well as future climate
conditions that can inform infrastructure decisions.
Climate Change
Climate change refers to changes in long-term weather patterns caused by natural phenomena and
human activities that alter the chemical composition of the atmosphere through the build-up of
greenhouse gases which trap heat and reflect it back to the earth’s surface.
Climate Change Atlas of Canada
The Climate Atlas of Canada is an interactive tool that combines climate science, mapping, and story telling
to depict expect climatic changes across Canada to the end of the century. The 250-layer map is based on
data from 12 global climate models. Users are shown a baseline period of warming trends by region that
spans from 1950 to 2005 and can toggle between two future projection periods, 2021 to 2050 and 2051
to 2080.
Climate Change Data and Scenarios Tool
The Canadian Climate Data and Scenarios (CCDS) site was originally launched in February 2005 with
support from Environment and Climate Change Canada the Climate Change Adaptation Fund (CCAF) and
the University of Regina. The CCDS supports climate change impact and adaptation research in Canada
through the provision of climate model and observational data.
Climate Projections
Climate projections are a projection of the response of the climate system to emissions or concentration
scenarios of greenhouse gases and aerosols. These projections depend upon the climate change (or
emission) scenario used, which are based on assumptions concerning future socioeconomic and
technological developments that may or may not be realized and are therefore subject to uncertainty.
Climate Change Scenario
A climate change scenario is the difference between a future climate scenario and the current climate. It
is a simplified representation of future climate based on comprehensive scientific analyses of the potential
consequences of anthropogenic climate change. It is meant to be a plausible representation of the future
emission amounts based on a coherent and consistent set of assumptions about driving forces (such as
demographic and socioeconomic development, technological change) and their key relationships.
Ensemble Approach
An ensemble approach uses the average of all global climate models (GCMs) for temperature and
precipitation. Research has shown that running many models provides the most realistic projection of
annual and seasonal temperature and precipitation than using a single model.
Extreme Weather Event
A meteorological event that is rare at a place and time of year, such as an intense storm, tornado, hail
storm, flood or heat wave, and is beyond the normal range of activity. An extreme weather event would
normally occur very rarely or fall into the tenth percentile of probability.
General Circulation Models (GCM)
General Circulation Models are based on physical laws and physically-based empirical relationships and
are mathematical representations of the atmosphere, ocean, ice caps and land surface processes. They

5

are therefore the only tools that estimate changes in climate due to increased greenhouse gases for a
large number of climate variables in a physically-consistent manner.
Greenhouse Gas (GHG) Emissions
Greenhouse gases are those gaseous constituents of the atmosphere, both natural and anthropogenic,
that absorb and emit radiation at specific wavelengths within the spectrum of thermal infrared radiation,
emitted by the Earth’s surface, the atmosphere itself, and by clouds. Water vapour (H2O), carbon dioxide
(CO2), methane (CH4), nitrous oxide (N2O), ozone (O3), and chlorofluorocarbons (CFCs) are the six primary
greenhouse gases in the Earth’s atmosphere in order of abundance.
Heavy Rainfall
Heavy rainfall is defined as rainfall that is greater or equal to 50mm an hour, or is greater than or equal to
75mm of rain in three hours.
Hot Days
A hot day occurs when temperatures meet or exceed 30°C.
Intensity-duration-frequency curve
An Intensity-Duration-Frequency curve (IDF Curve) is a graphical representation of the probability that a
given average rainfall intensity will occur. Rainfall Intensity (mm/hr), Rainfall Duration (how many hours
it rained at that intensity) and Rainfall Frequency/Return Period (how often that rain storm repeats itself)
are the parameters that make up the axes of the graph of IDF curve. An IDF curve is created with long
term rainfall records collected at a rainfall monitoring station.
Radiative forcing
The change in the value of the net radiative flux (i.e. the incoming flux minus the outgoing flux) at the top
of the atmosphere in response to some perturbation, in this case, the presence of greenhouse gases.
Representative Concentration Pathways
Representative Concentration Pathways (RCPs) are four greenhouse gas concentration (not emissions)
trajectories adopted by the IPCC for its fifth Assessment Report (AR5) in 2014. It supersedes Special Report
on Emissions Scenarios (SRES) projections published in 2000.
Temperature anomaly

A departure from a reference value or long-term average. A positive anomaly indicates that the
observed temperature was warmer than the reference value, while a negative anomaly indicates that the
observed temperature was cooler than the reference value.

Climate Indices
The climate indices included in this study are listed and defined in the table below. The indices represent
a broad range of important climate variables that impact daily life in the City of Peterborough.
6

Table 1: Climate Indices Definitions

 Climatic        Climate Indicator       Description                                                   Units
 Driver

 Temperature     Mean Temperature        The average temperature for a given season (or annually)      °C

                 Mean Monthly            The average monthly maximum temperature                       °C
                 Maximum Temperature

                 Mean Monthly            The average monthly minimum temperature                       °C
                 Minimum Temperature

                 Hot Days                The number of days where the daily maximum                    Days
                                         temperature (Tmax) is > 30°C

                 Cold Days               The number of days where the daily minimum                    Days
                                         temperature (Tmin) is < 5°C, 3°C, 1.7°C, 0°C, -2°C, -5°C, -
                                         10°C, or -15°C

                 Freeze-Thaw Cycles      The number of days with a Tmin < 0°C and a Tmax > 0°C         Days

                 Growing Season Start    The first day of the year when Tmin > 0°C (last frost)        Date of
                 Date                                                                                  Year

                 Growing Season End      The last day of the year when Tmin > 0°C (first frost)        Date of
                 Date                                                                                  Year

                 Growing Season Length   The number of days between the growing season start           Days
                                         and end days (frost-free period)

 Precipitation   Total Precipitation     Total accumulated precipitation                               mm

                 Mean Precipitation      The average precipitation for a given season (or annually)    mm
7
Introduction
Climate change is an increasingly critical issue at the national and local level. Recent events in the
Greater Peterborough Area, including flooding, ice storms, and other occurrences of extreme weather
over the past several decades, have highlighted the need to be prepared for ongoing challenges. The
Adaptation Changemakers project is designed to assist municipalities in understanding community
climate impacts and developing plans to address priority risks. This report will primarily focus on
changes in temperature and precipitation patterns, which will affect the social, natural, built, and
economic systems in the City of Peterborough at the community level. The localized projections will
allow for exploration of climate change impacts in the City and will illuminate the realities of Canadian
climate change more generally.
Data Collection
Data for this report was collected through several platforms. Primarily, localized climate change data
was collected from three online, publicly available tools. These include:
• Climate Change Data and Scenarios Tool - http://climate-scenarios.canada.ca
• Climate Atlas of Canada Tool - https://climateatlas.ca/
• Computerized Tool for the Development of Intensity-Duration-Frequency Curves under Climate
Change Version 3.0 - http://www.idf-cc-uwo.ca/home
More information concerning these online tools are provided in the Glossary. Other information
pertaining to expected climatic changes in Ontario were taken from various academic or government
reports. These are identified and cited where applicable.
Climate Change Modelling and Downscaling
The data presented in this report is based on global climate models (GCM’s) and emission scenarios
defined by the Intergovernmental Panel on Climate Change (IPCC), drawing from both the Fourth
Assessment Report (AR4) and Fifth Assessment Report (AR5) publications. Data projecting temperature
and precipitation changes have been constructed using Environment Canada’s Canadian Climate Data
and Scenarios (CCDS) tool, the Climate Atlas, and the Institute for Catastrophic Loss Reduction's
Intensity-Duration-Frequency Climate Change Tool.
Many different methods exist to construct climate change scenarios, however global climate models are
the most conclusive tools available for simulating responses to increasing greenhouse gas
concentrations, as they are based on mathematical representations of atmosphere, ocean, ice cap, and
land surface processes.i
Wherever possible, this report uses an ensemble approach, which refers to a system that runs multiple
climate models at once. Research has shown that this provides a more accurate projection of annual and
seasonal temperatures and precipitation than a single model would on its own. In cases where an
ensemble approach was unavailable, this report uses the CGCM3T47 model, which is the third version of8
the Canadian Centre for Climate Modelling and Analysis' (CCCma) Coupled Global Climate Model. This
model has a well-established track record for simulating current and future climates, and has been used
in all IPCC exercises pertaining to GCMs.ii
Greenhouse Gas Emissions Scenarios
Climate change scenarios are based on models developed by a series of international climate modeling
centers. They are socioeconomic storylines used by analysts to make projections about future
greenhouse gas emissions and to assess future vulnerability to climate change. Producing scenarios
requires estimates of future population levels, economic activity, the structure of governance, social
values, and patterns of technological change. In this report, climate change scenarios from both the
Fourth and the Fifth IPCC Assessments are considered.
1) SRES Scenarios - IPCC Fourth Assessment Report (AR4)
Climate change scenarios from the Fourth Assessment report are referred to as Special Report on
Emissions Scenarios (SRES) and use ensembles of more than 20 GCM’s to construct a complex storyline
of environmental and socioeconomic conditions that follow from predetermined emissions levels over
the coming decades.iii Four different narrative storylines were developed to describe the relationships
between emission driving forces and their evolution, adding context for scenario quantification. Each
storyline represents different demographic, social, economic, technological, and environmental
developments.iv
❖ The A2 storyline and scenario family describes a very heterogeneous world. The underlying
theme is self-reliance and preservation of local identities.v Fertility patterns across regions
converge very slowly, which results in a continuously increasing global population. Economic
development is regionally oriented and per capita economic growth and technological change
are more fragmented and slower than other storylines. In addition, this scenario sees relatively
slow end-use and supply-side energy efficiency improvements and delayed development of
renewable energy, with no barrier to the use of nuclear energy.vi
2) RCP Scenarios - IPCC Fifth Assessment Report (AR5)
Representative Concentration Pathways (RCPs) are the newest set of climate change scenarios that
provide the basis for the Fifth Assessment report from the IPCC.vii The new RCPs have replaced the
Special Report on Emissions Scenarios (SRES) in order to be more consistent with new data, new models,
and updated climate research from around the world. The RCPs contain information regarding emission
concentrations and land-use trajectories, and are meant to be representative of the current literature
on emissions and concentration of greenhouse gases. The premise is that every radiative forcing
pathway (see Glossary) can result from a diverse range of socioeconomic and technological
development scenarios.viii They are identified by their approximate total radiative forcing in the year
2100 relative to 1750, and are labeled as RCP 2.6, 4.5, 6.0 and 8.5. These four RCPs include one
mitigation scenario leading to a very low forcing level (RCP2.6), two stabilization scenarios (RCP4.5 and
RCP6.0), and one scenario with continued rising greenhouse gas concentrations (RCP8.5).ix The RCPs also9
consider the presence of 21st century climate policies, as compared with the no-climate policy
assumption of the SRESs in the Third and Fourth Assessment Reports.x
For this report, projections will use RCP 8.5, as it represents a ‘business as usual’ pathway with
emissions continuing to increase. If current emissions trends continue, the higher emissions scenarios
and associated temperature increases will likely apply. Additionally, it is important that municipalities
are aware of some of the most potentially dramatic effects of climate change should global emissions
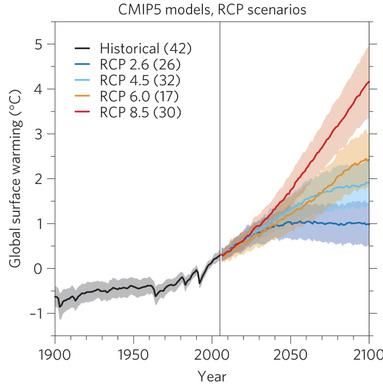
persist. Table 1 provides a description of each RCP scenario, while Figure 1 illustrates the projected
global warming associated with the four scenarios.
Table 2: IPCC Fifth Assessment Report Climate Change Scenario Characteristics
Scenario Description
RCP 2.6 Lowest projected GHG concentrations, resulting from dramatic climate change mitigation
measures implemented globally. It represents an increase of 2.6 W/m2 in radiative forcing
to the climate system.
RCP 4.5 Moderate projected GHG concentrations, resulting from substantial climate change
mitigation measures. It represents an increase of 4.5 W/m2 in radiative forcing to the
climate system.
RCP 6.0 Moderate projected GHG concentrations, resulting from some climate change mitigation
measures. It represents an increase of 6.0 W/m2 in radiative forcing to the climate system.
RCP 8.5 Highest projected GHG concentrations, resulting from business-as-usual emissions. It
represents an increase of 8.5 W/m2 in radiative forcing to the climate system.
Figure 1: Projected Global Warming for CMIP5 RCP Scenarios
Note: Due to the recentness of the IPCC Fifth Assessment Report (2014), data from the IPCC Fourth
Assessment Report (2007) was substituted in cases where localized AR5 data was unavailable.10 Time Periods Climatic projections are typically provided within time periods of 20-30 years. Additionally, a consistent baseline period is established so that projections can be accurately compared with historical trends. In this report, the time periods of 2021-2050 and 2051-2080 are used most frequently. In some cases, timeframes are divided into three: “2020s” (2016-2035); “2050s” (2046-2065); and “2080s” (2081- 2100). Many climate indices are also divided into seasonal periods, defined below. Table 3: Seasonal timeframes Season Months Winter December, January, February Spring March, April, May Summer June, July, August Fall September, October, November Uncertainty It is important to note that uncertainty is an integral part of the study of climate change. Uncertainty is factored into climate change scenarios, models, and data, and reflects the complex reality of environmental change and the evolving relationship between humans and the planet. Climate change cannot be predicted with absolute certainty in any given case, and all data must be considered with this in mind. While it is not possible to anticipate future climactic changes with absolute certainty, climate change scenarios help to create plausible representations of future climate conditions. These conditions are based on assumptions of future atmospheric composition and on an understanding of the effects of increased atmospheric concentrations of greenhouse gases (GHG), particulates, and other pollutants. Temperature Ontario Over the last six decades, Canada has become warmer, with average temperatures over land increasing by 1.5°C between 1950 and 2010.xi This rate of warming is almost double the global average reported over the same period.xii Assuming emissions continue at the current rate of global output, the Province of Ontario is projected to experience an average annual temperature rise of approximately 7.7°C by the end of the century. Table 4 displays the expected seasonal temperature change in Ontario based on the IPCC Fifth Assessment Report (AR5). An ensemble of global climate models was used, and the high emissions scenario was selected because if current emissions trends continue, RCP8.5 and associated temperature increases will likely apply.xiii The degrees in the table are the not actual temperatures, but the degrees by which temperature is projected to change from the baseline under the business as usual climate scenario RCP8.5.
11

Table 4: Seasonal Temperature Change in Ontario for RCP 8.5
Baseline: 1986-2005

                                                       RCP 8.5
                            2016-2035                 2046-2065                 2081-2100
                       Median      Range        Median       Range         Median      Range
         Winter         1.9°C     1.2-2.2°C      4.4°C      3.4-5.4°C       8.1°C     6.9-9.7°C

          Spring        1.2°C      0.8-1.7°C     3.0°C      2.3-3.4°C       5.2°C     4.5-6.3°C

        Summer          1.3°C      1.0-1.6°C     3.1°C      2.6-3.9°C        6°C      4.7-6.9°C

         Autumn         1.4°C      1.1-1.8°C     3.3°C      2.8-4.0°C       5.8°C     4.9-7.0°C

         Annual         1.4°C      1.1-1.9°C     3.5°C      2.8-3.9°C       6.3°C     5.3-6.9°C

City of Peterborough
Temperatures in the City of Peterborough are expected to rise in congruence with the provincial
changes observed in the data above. The Climate Atlas of Canada tool was used to collect downscaled
climate projections, using a baseline of 1976-2005. In Peterborough, there is a projected temperature
increase between 1.7°C and 4.8°C from the baseline mean, depending upon the selected scenario and
timeframe. Table 6 depicts the projected temperatures using an ensemble of global climate models and
applying the RCP 8.5 (business as usual) scenario.
Table 5: Baseline Mean Temperatures (1976-2005) for City of Peterborough

            Annual              Winter (DJF)      Spring (MAM)       Summer (JJA)    Autumn (SON)
 °C             6.4°C                -7°C              5.3°C            18.8°C           8.3°C

Table 6: Projected Seasonal Temperature for City of Peterborough under RCP 8.5

                                   2021-2050                                 2051-2080
                      Mean              Range               Mean                   Range
 Winter               -4.9°C            -7.3-(-1.7) °C      -2.0°C                 -5.6-1.4°C
 Spring               7.0°C             4.7-9.4°C           8.9°C                  6.3-11.3°C
 Summer               20.8°C            19.0-22.8°C         23.0°C                 20.4-25.5°C
 Autumn               10.4°C            8.4-12.4°C          12.3°C                 10.1-14.9°C
 Annual               8.5°C             7.0-10.1°C          10.6°C                 8.6-12.7°C
12
Figure 2: Projected Annual Temperature Increase for City of Peterborough under RCP 8.5
Hot and Cold Days
Temperature extremes can pose significant threats to communities across the country. From health
impacts to increasing energy demands, “hot days” (days where the temperature exceeds 30°C) can be
particularly concerning for communities. Outdoor workers can experience health risks and delays due to
inhospitable temperatures. Vulnerable populations such as low income or elderly residents without
access to air conditioning can also be susceptible to sickness and injury in such high temperatures.
Extreme cold days, where the temperature is below -30°C, can also pose a wide range of risks to the
community. Power outages can leave homes without warmth and can cause stress on critical systems
and services across the City.
Table 7 shows extreme heat and cold day projections for the City of Peterborough, using an ensemble
climate model and applying the high emissions RCP8.5 scenario. The figures are based on the baseline
average from 1976-2005. The City can expect an increase in the number of hot days (days where the
temperature exceeds 30°C), and a decreasing amount of cold days (days where the temperature is
below -30°C).13
Table 7: Projected Hot and Cold Days for City of Peterborough under RCP8.5
RCP8.5
Days with Maximum Days with Maximum
Temperature >30°C Temperature14
Freeze-Thaw
A freeze-thaw cycle is any day where the minimum temperature is below 0˚C and the maximum
temperature is above 0˚C. The RCP 8.5 ensembles project that freeze-thaw cycles will decrease due to
overall warmer temperatures. The baseline freeze-thaw cycles are approximately 76.9 days per year. In
the immediate future (2021-2050) there are projected 68.7 freeze-thaw days, and in the near future
(2051-2080) there are 62.4 days freeze-thaw days projected.
Growing Season Length
Agricultural indices include the start and end of the growing season, as respectively defined by the last
and first frosts, as well as the total length of the growing season. The RCP 8.5 ensembles project earlier
start dates and later end dates to the growing season in the City of Peterborough, as shown in Table 8.
The baseline start date is typically around May 10 (130th day of the year), while the end date is typically
October 2 (275th day of the year), resulting in a growing season of approximately 145 days. According to
the RCP 8.5 ensemble, by the end of the 21st century, the start date is projected to occur approximately
20 days earlier, while the end date will likely occur approximately 25 days later. This means the growing
season will likely increase by one or two months, following the high emissions scenario.
Table 8: Growing Season Length for City of Peterborough under RCP8.5
RCP8.5
Start date End date Mean frost-free days
1976-2005 May 10 Oct 2 145
2021-2050 April 28 Oct 12 168
2051-2080 April 20 Oct 27 190
Precipitation
Ontario
Canada has, on average, become wetter during the past half century, with average precipitation across
the country increasing by approximately 13%. Although other parts of the country can expect to see a
significant percentage increase in precipitation, particularly Northern Canada, projections for Ontario
show less dramatic changes to precipitation patterns. Below are the projected precipitation changes for
the province of Ontario under the RCP8.5 scenario.
Table 9: Seasonal Precipitation Change (%) in Ontario - RCP8.5 (Baseline 1986-2005)
RCP8.5
2020s 2050s 2080s
Median Range Median Range Median Range
Winter 4.00% 1.6-12.1% 13.10% 10.9-23.9% 24.20% 21.6-21.7%
Spring 1.30% (-)0.8-9.7% 3.10% 5.3-21.5% 6.00% 14.1-36.9%
Summer 0.70% (-)3.5-12.1% 1.30% (-)3.8-23.0% (-)0.5% (-)8.2-41.7%
Autumn 3.1% (-)1.1-7.9% 7.7% 1.7-13.6% 13.6% 6.3-19.9%15
City of Peterborough
Precipitation in Peterborough is expected to rise in congruence with the provincial changes observed in
the AR5 data above, with some decreases in precipitation during the summer months. The Climate Atlas
provides information from a weather station located within the City of Peterborough. The data uses a
baseline of 1976-2005 and depicts projected precipitation for the high emissions scenario.
Projections are based on increases from the precipitation baseline, which is the average amount of
precipitation from 1976-2005. For Peterborough, the average annual precipitation over this period was
846 mm. The projections to 2050 and 2080 reflect the projected amount of precipitation, in millimetres,
from the annual and seasonal baselines.
In a high emission scenario, Peterborough can expect to experience an average annual precipitation
increase of 40 mm during 2021-2050 and 78 mm during 2051-2080.
Table 10: Baseline Mean Precipitation (1976-2005) for City of Peterborough
Annual Winter (DJF) Spring (MAM) Summer (JJA) Autumn (SON)
mm 846 mm 193 mm 205 mm 214 mm 231 mm
Table 11: Projected Seasonal Precipitation for City of Peterborough under RCP 8.5
2021-2050 2051-2080
Mean Range Mean Range
Winter 215 mm 147-297 mm 232 mm 162-313 mm
Spring 222 mm 148-306 mm 236 mm 160-329 mm
Summer 218 mm 139-303 mm 212 mm 126-325 mm
Autumn 231 mm 140-336 mm 244 mm 155-388 mm
Annual 886 mm 722-1060mm 924 mm 754-1115 mm16 Figure 4: Projected Annual Precipitation for City of Peterborough under RCP 8.5 Extreme Weather Events Canada has seen more frequent and intense extreme events over the last 50-60 years than ever before. These events come in the form of extreme heat days, more instances of extreme precipitation and flooding, wind storms, and ice storms. In Canada, models show shorter return periods of extreme events – that is, the estimated interval of time between occurrences – in the future.xiv Heavy or Extreme Precipitation Extreme and heavy rain events are expected to become more intense and more frequent.xv As Southern Ontario is the most intensely urbanized area of the province, the magnitude and costs associated with flooding is significantly higher than elsewhere in the province. The City of Peterborough has recently experienced severe flooding, notably in 2002 and 2004 when, 78.8 mm of rain fell between 3:30- 4:30am.xvi
17

Intensity-duration-frequency (IDF) curves represent one way to analyze and predict heavy precipitation
under a changing climate. They provide a graphical representation of the probability that a given
average rainfall intensity will occur. Rainfall Intensity (mm/hr), Rainfall Duration (how many hours it
rained at that intensity) and Rainfall Frequency/Return Period (how often that rain storm repeats itself)
are the parameters that make up the axes of the graph of IDF curvexvii.

The Institute for Catastrophic Loss Reduction (ICLR) has developed a tool that assists users in developing
and updating IDF curves using precipitation data from existing Environment Canada hydro-
meteorological stations. Available precipitation data is integrated with predictions obtained from Global
Climate Models to assess the impacts of climate change on IDF curves. Global climate models and
scenarios developed for the IPCC Fifth Assessment Report (AR5) are used to provide future climate
projections.

The station selected to produce localized IDF curves for Peterborough was the PETERBOROUGH STP.
Projections are based on increases from the precipitation rate baseline, which is the average amount of
precipitation in the years the station was active. For the Peterborough station, this baseline was
calculated between 1965 and 1992. Table 12 and Figure 5 depict baseline precipitation intensity for
Peterborough.

Table 12: Baseline Precipitation Intensity Rates (mm/h) (1965-1992) for Station Peterborough STP.

     T (years)          2              5              10              25              50             100
     5 min            84.68         120.76          146.72          182.09         210.31          240.13
     10 min           66.57         92.81           111.70          137.48         158.07          179.84
     15 min           55.94         74.91           87.98           105.10         118.25          131.70
     30 min           36.16         48.52           57.15           68.58          77.46           86.62
       1h             22.67         29.79           34.54           40.60          45.13           49.65
       2h             13.97         18.35           21.20           24.75          27.34           29.88
       6h             6.16           8.16            9.41           10.90          11.95           12.94
      12 h            3.39           4.47            5.10            5.81           6.29            6.72
      24 h            1.80           2.44            2.90            3.53           4.04            4.57
18
Figure 5: Baseline Precipitation Intensity Rates (mm/h) (1965-1992) for Station Peterborough STP.
Table 13 and Figure 6 below represent the change in IDF curves under a high emissions scenario. The
projections cover a 59-year range from 2021-2080. As seen in the graphs, the intensity of rainfall is
projected to increase. While longer, more frequent rainfall events (e.g. a typical rainy day) will bring
slightly higher amounts of rain, the intensity of rainfall during more infrequent, extreme storms (i.e. 1 in
100-year storms) is projected to significantly increase.
Table 13: Projected Precipitation Intensity Rates (mm/h) for Station Peterborough STP.
T (years) 2 5 10 25 50 100
5 min 104.88 147.29 183.23 216.81 255.21 302.77
10 min 82.43 113.33 139.67 163.71 192.02 227.53
15 min 69.24 91.32 110.22 125.87 143.36 166.12
30 min 44.75 59.21 71.59 82.02 94.01 109.51
1h 28.06 36.25 43.30 48.79 54.61 62.43
2h 17.29 22.29 26.58 29.83 32.99 37.34
6h 7.60 9.93 11.80 13.25 14.32 15.96
12 h 4.19 5.45 6.40 7.11 7.70 8.59
24 h 2.22 2.98 3.63 4.21 4.91 5.8119 Figure 6: Projected Precipitation Intensity Rates (mm/h) for Station Peterborough STP. The projected IDF curves above demonstrate that the intensity (mm/h) of rainfall will increase, with more rain falling in shorter time periods. Storms that occur less frequently (e.g. 100-year storms) are projected to see the greatest increase in intensity. Furthermore, such heavy precipitation events are projected to become more common than they once were. The Climate Atlas provides projections for the number of heavy precipitation days (over 10mm). For RCP8.5, heavy precipitation days will increase in the City of Peterborough. The average annual baseline (1976-2005) is 23.6 heavy precipitation days per year. In a high emissions scenario, this is projected to increase to 26.2 days per year between 2021- 2050, and 27.9 days per year in 2051-2080. Water Levels Lake Ontario Due to recent increases in the volume of glacial melt water, precipitation changes, and increased evaporation, water resources across much of Canada have been altered. In the Great Lakes, a 1°C change in mean annual air temperature has been associated with a 7-8% increase in the actual evapotranspiration (AET) rates, resulting in lower water availability.xviii Lake Ontario is expected to see its water levels decrease by 0.5 meters by 2050.xix
20

Changing water levels in the Great Lakes are strongly influenced by climate and will have significant
impacts for all of Southern Ontario. Analysis of long-term regional climate data suggests that
precipitation accounts for 55% and temperature accounts for 30% of the variability in lake levels.xx

Water shortages have been documented in regions of Southern Ontario and projections indicate that
shortages will occur more frequently as summer temperatures and evaporations rates increase.xxi Ice
cover break-up dates are expected to advance in the range of 1 to 3-1/2 weeks, while freeze-up dates
are expected to be delayed by up to 2 weeksxxii. The resulting ice cover duration is expected to decrease
by up to a month depending on the depth of the lake, with greater reductions found for deeper lakes.xxiii
Projected warming in the region, particularly in winter months, is expected to further change the
duration and extent of ice cover on the lakes. Less ice cover results in great loss of water through
evaporation and enhanced shoreline erosion during winter storms.xxiv

Figure 7: Projected changes in Great Lakes Water Levels based on a 50-year average
21

Water Temperatures
Increases in nearshore temperatures have been recorded at several locations around the Great Lakes
since the 1920s. They are most pronounced in the spring and fall and are positively correlated with
trends in global mean air temperature.xxv

With changing climatic conditions in Ontario, wetlands in Southern Ontario are particularly vulnerable to
drying. Animals and plants that require wetland habitat will be threatened, and the ecosystem services
provided by wetlands will be diminished.

Stream temperatures in Lake Ontario are also expected to increase by up to 1.4°C.xxvi In Lake Ontario
under a high emissions scenario, 23% of the streams may warm from coldwater to coolwater habitat.xxvii
This change can cause decreased presence of coldwater fish while increasing coolwater habitat, altering
species makeup and possibly leading to increased spread of invasives. Furthermore, warmer
temperatures will affect walleye (coolwater species) biomass, causing a decline of ~10-15% in the Lake
Ontario basin.xxviii

Table 14 below depicts the predicted maximum surface temperatures in the Lake Ontario basin. The
predicted temperatures were developed using ensemble climate projections of air temperature under
the IPCC Fourth Assessment scenarios. The high emissions scenario (A2) projections are displayed
below. The time periods for the projections include the 2020s, 2050s, and 2080s.
Table 14: Maximum surface temperature projections for Lake Ontario Basin

 Basin             # of main stem lakes     Current (2014)      2020s           2050s        2080s
 Ontario           893                      23.9⁰C              25.6⁰C          27.1⁰C       28.9⁰C

Conclusion
The information provided in this report provides a clear indication that climate change is affecting Canada,
and specifically the City of Peterborough. Rising annual temperatures as well as increases in precipitation
and extreme events are major climate impacts that can have tremendous ecological, infrastructural,
economic, and sociological effects for the community. This report is meant to act as a background and an
introduction to climate change in this area, and additional research should be conducted to retrieve more
precise downscaled climate projections where available.
22

References
i
   IPCC-TGCIA. (1999). Guidelines on the Use of Scenario Data for Climate Impact and Adaptation Assessment.
Version 1. Prepared by Carter, T.R., Hulme, M. and M. Lal, Intergovernmental Panel on Climate Change, Task Group
on Scenarios for Climate Impact Assessment. 69 pp. (Available from: http://ipcc-ddc.cru.uea.ac.uk)
ii
    Flato, G. M. (2005). The third generation coupled global climate model (CGCM3). Retrieved from:
http://www.ec.gc.ca/ccmac-cccma/default.asp?n=1299529F-1
iii
     IPCC. (2007). Summary for policymakers. In: Climate change 2007: The physical science basis. Contribution of
Working Group I to the Fourth Assessment Report of the Intergovernmental Panel on Climate Change [Solomon, S.,
D. Qin, M. Manning, Z. Chen, M. Marquis, K.B. Averyt, M.Tignor and H.L. Miller (eds.)]. Cambridge University Press,
Cambridge, United Kingdom and New York, NY, USA. https://www.ipcc.ch/pdf/assessment-report/ar4/wg1/ar4-
wg1-spm.pdf p.8
iv
     IBID p. 8
v
    IBID p. 4
vi
     IBID p. 4
vii
      Charron, I. (2014). A guidebook on climate scenarios: Using climate information to guide adaptation research and
decisions. Ouranos, p.63
viii
       IBID p. 63
ix
     IPCC. (2007). Summary for policymakers. In: Climate change 2007: The physical science basis. Contribution of
Working Group I to the Fourth Assessment Report of the Intergovernmental Panel on Climate Change [Solomon, S.,
D. Qin, M. Manning, Z. Chen, M. Marquis, K.B. Averyt, M.Tignor and H.L. Miller (eds.)]. Cambridge University Press,
Cambridge, United Kingdom and New York, NY, USA. https://www.ipcc.ch/pdf/assessment-report/ar4/wg1/ar4-
wg1-spm.pdf p. 29
x
    IBID p. 29
xi
     Warren, F.J. and Egginton, P.A. (2008). Background Information; in From Impacts to Adaptation: Canada in a
Changing Climate, 2007, edited by D.S. Lemmen, F.J. Warren, J. Lacroix and E. Bush; Government of Canada,
Ottawa, ON, p. 27-56
xii
      IBID.
xiii
       Chiotti, Q. and Lavender, B. (2008): Ontario; in From Impacts to Adaptation: Canada in a Changing Climate, 2007,
edited by D.S. Lemmen, F.J. Warren, J. Lacroix and E. Bush; Government of Canada, Ottawa, ON, p. 227-274.
xiv
       McBean, G. and Henstra, D. (2009). Background Report: Climate Change and Extreme Weather: Designing
Adaptation Policy.
xv
      Chiotti, Q. and Lavender, B. (2008): Ontario; in From Impacts to Adaptation: Canada in a Changing Climate, 2007,
edited by D.S. Lemmen, F.J. Warren, J. Lacroix and E. Bush; Government of Canada, Ottawa, ON, p. 227-274.
xvi
       City of Peterborough. (2004). City of Peterborough Flood 2004 Fact Sheet. Retrieved from:
http://www.peterborough.ca/Assets/City+Assets/Emergency+Management/Documents/2004+Peterborough+Floo
d+Fact+Sheet.pdf
xvii
        IDF Curve. The Climate Workspace. Accessed from: http://www.glisaclimate.org/node/2341
xviii
         Warren, F.J. and Egginton, P.A. (2008). Background Information; in From Impacts to Adaptation: Canada in a
Changing Climate, 2007, edited by D.S. Lemmen, F.J. Warren, J. Lacroix and E. Bush; Government of Canada,
Ottawa, ON, p. 27-56
xix
       Bruce, J.P., Egener, M., and Noble, D. (2006) Adapting to Climate Change: A Risk Based Guide for Ontario
Municipalities.
xx
    Chiotti, Q. and Lavender, B. (2008): Ontario; in From Impacts to Adaptation: Canada in a Changing Climate, 2007,
edited by D.S. Lemmen, F.J. Warren, J. Lacroix and E. Bush; Government of Canada, Ottawa, ON, p. 227-274.
xxi
     Expert Panel on Climate Change Adaptation. (2009) Adapting to Climate Change in Ontario.
xxii
      Warren, F.J. and Lemmen, D.S., editors (2014): Canada in a Changing Climate: Sector Perspectives on Impacts
and Adaptation; Government of Canada, Ottawa, ON, p.40
xxiii
      Warren, F.J. and Lemmen, D.S., editors (2014): Canada in a Changing Climate: Sector Perspectives on Impacts
and Adaptation; Government of Canada, Ottawa, ON, p. 41
xxiv
      Chiotti, Q. and Lavender, B. (2008): Ontario; in From Impacts to Adaptation: Canada in a Changing Climate,
2007, edited by D.S. Lemmen, F.J. Warren, J. Lacroix and E. Bush; Government of Canada, Ottawa, ON, p. 227-274.
23
xxv
Chiotti, Q. and Lavender, B. (2008): Ontario; in From Impacts to Adaptation: Canada in a Changing Climate,
2007, edited by D.S. Lemmen, F.J. Warren, J. Lacroix and E. Bush; Government of Canada, Ottawa, ON, p. 227-274.
xxvi
Chu, Cindy. (2105). Climate Change Vulnerability Assessment for Inland Aquatic Ecosystems in the Great Lakes
Basin, Ontario. Retrieved from: http://www.climateontario.ca/MNR_Publications/CCRR-43.pdf
xxvii
Ibid.
xxviii
Ibid.You can also read