Circular RNA circPHKA2 Relieves OGD-Induced Human Brain Microvascular Endothelial Cell Injuries through Competitively Binding miR-574-5p to ...
←
→
Page content transcription
If your browser does not render page correctly, please read the page content below
Hindawi
Oxidative Medicine and Cellular Longevity
Volume 2021, Article ID 3823122, 17 pages
https://doi.org/10.1155/2021/3823122

Research Article
Circular RNA circPHKA2 Relieves OGD-Induced Human Brain
Microvascular Endothelial Cell Injuries through Competitively
Binding miR-574-5p to Modulate SOD2

 Xiaobo Yang ,1,2,3,4 Xiuying Li,5 Chuanhong Zhong,1,2,3,4 Jianhua Peng,1,2,3,4
 Jinwei Pang,1,2,3,4 Tangming Peng,1,2,3,4 Weifeng Wan,1,2,3,4 and Xianglong Li 1,2,3,4

 1
 Department of Neurosurgery, The Affiliated Hospital of Southwest Medical University, China
 2
 Sichuan Clinical Research Center for Neurosurgery, China
 3
 Academician (Expert) Workstation of Sichuan Province, China
 4
 Laboratory of Neurological Diseases and Brain Function, China
 5
 Department of Pharmacy, The Affiliated Hospital of Southwest Medical University, China

 Correspondence should be addressed to Xianglong Li; lixianglongys@163.com

 Received 15 June 2021; Revised 28 July 2021; Accepted 14 August 2021; Published 8 November 2021

 Academic Editor: Wen-Jun Tu

 Copyright © 2021 Xiaobo Yang et al. This is an open access article distributed under the Creative Commons Attribution License,
 which permits unrestricted use, distribution, and reproduction in any medium, provided the original work is properly cited.

 Background. Circular RNA phosphorylase kinase regulatory subunit alpha 2 (circPHKA2; hsa_circ_0090002) has a significantly,
 specifically different expression in acute ischemic stroke (AIS) patients’ blood. Here, we intended to investigate the role and
 mechanism of circPHKA2 in oxygen-glucose deprivation- (OGD-) induced stoke model in human brain microvascular
 endothelial cells (HBMEC). Methods. Expression of circPHKA2, microRNA- (miR-) 574-5p, and superoxide dismutase-2
 (SOD2) was detected by quantitative PCR and western blotting. Cell injury was measured by detecting cell proliferation (EdU
 assay and CCK-8 assay), migration (transwell assay), neovascularization (tube formation assay), apoptosis (flow cytometry and
 western blotting), endoplasmic reticulum stress (western blotting), and oxidative stress (assay kits). Direct intermolecular
 interaction was determined by bioinformatics algorithms, dual-luciferase reporter assay, biotin-labelled miRNA capture, and
 argonaute 2 RNA immunoprecipitation. Results. circPHKA2 was downregulated in AIS patients’ blood in SOD2-correlated
 manner. Reexpressing circPHKA2 rescued EdU incorporation, cell viability and migration, tube formation, B cell lymphoma-2
 (Bcl-2) expression, and SOD activity of OGD-induced HBMEC and alleviate apoptotic rate and levels of Bcl-2-associated protein
 (Bax), glucose-regulated protein 78 kD (GRP78), C/EBP-homologous protein (CHOP), caspase-12, reactive oxygen species (ROS),
 and malondialdehyde (MDA). Additionally, blocking SOD2 partially attenuated these roles of circPHKA2 overexpression.
 Molecularly, circPHKA2 upregulated SOD2 expression via interacting with miR-574-5p, and miR-574-5p could target SOD2.
 Similarly, allied to neurovascular protection of circPHKA2 was the downregulation of miR-574-5p. Conclusion. circPHKA2 could
 protect HBMEC against OGD-induced cerebral stroke model via the miR-574-5p/SOD2 axis, suggesting circPHKA2 as a novel
 and promising candidate in ischemic brain injury.

1. Introduction cerebral ischemia causes a sequence of detrimental events,
 including inflammation, oxidative stress, endoplasmic reticu-
Acute ischemic stroke (AIS), accounting for approximately lum (ER) stress, and apoptosis [3], as well as alteration of epi-
85% of all strokes, occurs due to the obstruction of cerebral genetics [4, 5]. New pharmacological interventions, including
blood flow and the deficiency of oxygen and nutrients [1]. noncoding RNA- (ncRNA-) based strategies, have shown
The China Stroke Prevention Project Committee (CSPPC) promise for treatment of AIS.
established in 2011 intends to promote stroke prevention and Circular RNAs (circRNAs) are an evolutionarily conserved
control and improve stroke care [2]. Pathophysiologically, class of ncRNAs that are formed in a circular conformation via

2 Oxidative Medicine and Cellular Longevity

 Table 1: Clinical features of AIS patients and control subjects.

 AIS (n = 32) Control (n = 21) P value
Males/females 10/11 17/15 0.695
Age (years) 66:35 ± 2:91 64:23 ± 2:42 0.150
Body mass index (kg/m2) 25:12 ± 0:71 25:51 ± 0:82 0.072
Smokers % (n) 43.75 (14) 38.10 (8) 0.683
Hypertension % (n) 59.37 (19) 33.33 (7) 0.064
Diabetes mellitus % (n) 28.13 (9) 19.05 (4) 0.453
Total cholesterol (mmol/L) 4:25 ± 0:51 4:12 ± 0:25 0.284
Triglyceride (mmol/L) 1:55 ± 0:82 1:43 ± 0:71 0.927
HDL-C (mmol/L) 1:02 ± 0:48 1:15 ± 0:30 0.274
LDL-C (mmol/L) 2:51 ± 0:94 2:11 ± 0:85 0.122
Note: AIS: acute ischemic stroke; HDL-C: high-density lipoprotein cholesterol; LDL-C: low-density lipoprotein cholesterol. Data were represented as mean
± standard deviation or percentage (number) for category variables. P: AIS vs. control.

 Table 2: The list of qPCR primers.

Name Sequence (5 ′ -3 ′ )
circPHKA2 divergent primers TCCTCCAAGTCTGCGAATCC AGATGTTATCCCGCACCCAG (82 bp)
circPHKA2 convergent primers GTGCCTGAACTCTACGCTGT GTACAAGGATTGGCCCCACA (117 bp)
PHKA2 primers CTCCAAGTCTGCGAGGTCC TGATGTCCTCCCGAGTCTGA (72 bp)
miR-574-5p primers GAGTGTGTGTGTGTGAG GAACATGTCTGCGTATCTC (75 nt)
SOD2 primers AAAGGGGAGTTGCTGGAAGC TGAGCCTTGGACACCAACAG (96 bp)
GAPDH convergent primers GACAGTCAGCCGCATCTTCT GCGCCCAATACGACCAAATC (104 bp)
GAPDH divergent primers CCAAGGAGTAAATGGGGAAGG ACCAGAGTTAAAAGCAGCCC (89 bp)
U6 primers CTCGCTTCGGCAGCACATATACTA ACGAATTTGCGTGTCATCCTTGC (78 nt)

noncanonical splicing or backsplicing events [6]. Global In this study, we attempted to explore the association
expression of circRNAs is differentially altered in ischemic between circPHKA2 and SOD2 in cerebral IS, and its cell
lesion tissue, peripheral blood, and peripheral blood mononu- model was established in human brain microvascular endo-
clear cell from AIS patients [4, 7, 8]. Circular RNAs are thelial cells (HBMEC) induced by oxygen-glucose depriva-
broadly involved in stroke-related neurovascular damages tion (OGD). Eventually, a circPHKA2-microRNA (miR-
[9], and thus, circRNAs are proposed as novel diagnostic 574-5p)-SOD2 axis was highlighted, and miR-574-5p is rec-
and prognostic biomarkers for AIS [7, 10]. Recently, circRNA ommended as one of the markers for stroke diagnosis by
phosphorylase kinase regulatory subunit alpha 2 (circPHKA2; interacting with multiple messenger RNAs (mRNAs) of
hsa_circ_0090002) and circBBS2 (hsa_circ_0039457) are stroke candidate genes [17].
found to show significantly and specifically different expres-
sion in blood of AIS patients through the regulation of target 2. Materials and Methods
genes in ischemic brain [10]. Existing literatures indicate that
the two circRNAs seemed unstudied until now, and we chose 2.1. Blood Samples and OGD-Induced Cerebral Stroke Cell
circPHKA2 as one candidate for further functional analysis to Model. 32 patients with AIS and 21 healthy people were
decode the repertoires of circPHKA2 in IS-induced cerebral selected in the Affiliated Hospital of Southwest Medical Uni-
injury. versity. The venous blood from AIS patients was obtained
 Superoxide dismutase-2 (SOD2) is a mitochondrial- before recanalization therapy, and control bloods were col-
specific antioxidant enzyme that specializes in scavenging lected from subjects during physical examinations. The AIS
oxygen free radicals and then eliminating oxidative stress patients were diagnosed according to the Guidelines for the
[11]. In stroke, SOD2 genetic variant may alternatively Diagnosis and Treatment of AIS in China and MRI/CT
predict the risk of stroke in patients with sickle cell ane- results. Baseline characteristics of AIS patients and control
mia [12], and SOD2 mutation exacerbates ischemic brain subjects are shown in Table 1. This study was approved by
damage under hyperglycemic condition [13]. SOD2 has the Ethical Committee of the Affiliated Hospital of South-
been shown to be a vital enzyme in the maintenance of west Medical University.
vascular function [14, 15], and inducing/activating SOD2 Immortalized HBMEC were supplied by BNCC
is a novel strategy for neurovascular protection after ische- (BNCC337728, Beijing, China) and cultured in DMEM
mia/reperfusion [16]. medium (Gibco, Rockville, MD, USA) supplemented with
Oxidative Medicine and Cellular Longevity 3

 2.0 ⁎ 1.5 HBMEC

 Relative circPHKA2

 Relative circPHKA2
 1.5

 expression

 expression
 1.0
 1.0
 ⁎
 0.5 0.5

 0.0 0.0
 Control Cerebral stroke
 Control OGD
 (a) (b)
 chrX (p22.13)
 30 25 20 15 10 5
 PHKA2

 Back-splicing site

 circPHKA2
 3303 nt

 chrX: 18917290-18972530[–]
 (c)
 circPHKA2 GAPDH 1.5 HBMEC
 Relative RNA expression

 cDNA gDNA cDNA gDNA
 Marker

 1.0

 300 bp
 0.5
 ⁎
 100 bp 0.0
 PHKA2 mRNA circPHKA2

 Random hexamer primers
 Oligo (dT)18 primers
 (d) (e)

 1.5 HBMEC 120 HBMEC
 Relative RNA expression

 Relative RNA expression

 100 ⁎
 1.0 80
 60
 0.5 40
 ⁎ ⁎ ⁎
 20
 0.0 0
 PHKA2 mRNA circPHKA2 circPHKA2 GAPDH U6

 Mock Cytoplasm
 RNase R+ Nucleus
 (f) (g)

Figure 1: Exon-derived circPHKA2 was decreased in cerebral IS samples. (a, b) qPCR detected relative circPHKA2 expression in blood samples
of AIS patients (n = 32) and healthy controls (n = 32) and cell samples of OGD-treated HBMEC and control HBMEC. (c) CircView software
annotates the backsplicing of PHKA2 exons 2-29 according to the UCSC database, and Sanger sequencing confirmed the backsplicing site.
(d) RT-PCR detected circPHKA2 and GAPDH levels using divergent primers and convergent primers in cDNA and gDNA from HBMEC.
qPCR detected expression of circPHKA2 and PHKA2 mRNA in (e) HBMEC using random hexamer primers and oligo (dT)18 primers and
in (f) RNase R-treated (RNase R+) and mock-treated total RNAs from HBMEC. (g) qPCR detected expression of circPHKA2, GAPDH, and
U6 in the cytoplasm and nucleus of HBMEC. ∗ P < 0:05.
4 Oxidative Medicine and Cellular Longevity

 10 HBMEC
 ⁎

 Relative circPHKA2
 8

 expression
 6
 4
 2
 0
 NC oe-circPHKA2
 (a)

 HBMEC EdU
 80 ⁎
 ⁎
 EdU+ cell (%)

 60

 40
 DAPI
 20

 0
 OGD+NC

 OGD+oe-circPHKA2
 NC

 Merge

 NC OGD+NC OGD+oe-circPHKA2

 (b)
 HBMEC
 150
 ⁎
 Cell viability (%)

 ⁎
 100

 50

 0
 OGD+NC

 OGD+oe-circPHKA2
 NC

 (c)
 HBMEC
 150
 Migratory cells per f ield

 ⁎
 ⁎
 100

 50

 0
 NC OGD+NC OGD+oe-circPHKA2
 OGD+NC

 OGD+oe-circPHKA2
 NC

 (d)

 Figure 2: Continued.
Oxidative Medicine and Cellular Longevity 5

 HBMEC
 150
 ⁎
 Tube formation (%)
 ⁎
 100

 50

 0

 OGD+NC

 OGD+oe-circPHKA2
 NC

 NC OGD+NC OGD+oe-circPHKA2

 (e)

Figure 2: circPHKA2 prompted proliferation, migration, and neovascularization of HBMEC after OGD. (a) qPCR detected relative
circPHKA2 expression in HBMEC administrated with oe-circPHKA2 or NC. (b–e) OGD-induced HBMEC were pretransfected with oe-
circPHKA2 or NC, compared with control HBMEC transfected with NC. (b) EdU assay determined percentage of EdU+ cells. (c) CCK-8
assay measured percentage of cell viability. (d) Transwell assay confirmed number of migratory cells per field (×100). (e) Tube formation
assay determined percentage of tube formation. ∗ P < 0:05.

5% fetal bovine serum (Gibco), 1% endothelial cell growth Genomic DNA (gDNA) from HBMEC was isolated
supplement (ECGS) (ScienCell), and 1x penicillin- using Mammalian Cell Genomic DNA Isolation Kit (BioVi-
streptomycin solution (Procell, Wuhan, China) in an incu- sion), and circPHKA2 and GAPDH were amplified in cDNA
bator containing 95% sterile air/5% CO2 at 37°C. In the and gDNA from HBMEC using divergent primers and con-
OGD model group, the medium was replaced with vergent primers. And an aliquot of RT-PCR products was
glucose-free DMEM for 6 h in a hypoxic incubator (Plas- visualized by agarose gel electrophoresis, and other RT-
Labs, Lansing, MI, USA) containing 95% N2/5% CO2. The PCR products were subjected to qPCR. By the way, the
control HBMEC were in normal medium harboring 4.5 g/L PCR product in divergent primers/cDNA group was con-
glucose under normal 95% sterile air/5% CO2 for 6 h. The firmed by Sanger sequencing. The primers are summarized
cell supernatant and extract were collected after OGD for in Table 1.
subsequent experiments. 4 U/μg RNA RNase R (GENESEED, Guangzhou, China)
 was added into total RNA from HBMEC to digest linear
 RNA for 30 min at 37°C, and equal volume of 1x reaction
2.2. Reverse Transcription PCR (RT-PCR) and Quantitative buffer provided in this kit was added as the mock group.
PCR (qPCR). Total RNA was extracted from bloods, cells, The resulting RNAs were subsequently purified using RNeasy
and subcellular fractions using TRIzol LS reagent (Invitro- MinElute Cleaning Kit (Qiagen) for RT-PCR and qPCR.
gen, Carlsbad, CA, USA) according to the manufacturer’s
instructions. Nuclear/Cytosol Fractionation Kit (BioVision,
 2.4. Cell Transfection. The pCD5-ciR vector (GENESEED)
San Francisco, CA, USA) was used to isolate the cytoplasm
 was used to overexpress circPHKA2, and empty vector was
and nucleus of HBMEC. RT-PCR was performed to generate
 its negative control (NC). The micrON™ miR-574-5p and
complementary DNA (cDNA) using RevertAid First Strand
 SOD2 siRNA (si-SOD2) were purchased from RIBOBIO
cDNA kit (Thermo Scientific, Waltham, MA, USA). Then,
 (Guangzhou, China), as well as the negative controls miR-
qPCR amplification was conducted using PowerTrack SYBR
 NC and si-NC. HBMEC and OGD-subjected HBMEC were
Green Master Mix (Thermo Scientific) and relevant primers
 administrated with these vectors/oligos using Lipofectamine
for circPHKA2, PHKA2, miR-574-5p, SOD2, GAPDH, and
 2000 (Invitrogen) as recommended by the manufacturer.
U6. The primers are summarized in Table 2. The cycle
threshold (Ct) values were obtained according to three bio-
 2.5. EdU Assay and Cell Counting Kit- (CCK-) 8 Assay. Cell-
logical duplications, normalized to the level of GAPDH or
 Light EdU DNA Cell Proliferation Kit (RIBOBIO) and
U6, and compared with the control group. RNA expression
 CCK-8 (Dojindo, Kumamoto, Japan) were adopted to detect
level was calculated using the 2−△△Ct method [18].
 cell proliferation of HBMEC according to 5 × 10⁴ cells/well
 in a 96-well plate. Fluorescence density was analyzed under
2.3. Identification of Circular Structure and circRNA an inverted fluorescence microscope (ZEISS, Shanghai,
Stability. First-strand cDNA of HBMEC was synthesized China), and the percentage of EdU-positive (EdU+) cells
from total RNA with random hexamer primer (for all was calculated normalized to DAPI+ cells. The absorption
RNAs) or oligo (dT)18 primer (for only RNAs containing at 450 nm was examined using a microplate reader, and rel-
poly (A) tails), which were provided in RevertAid First ative cell viability was determined comparing to a value of
Strand cDNA kit (Thermo Scientific). 100% in the control group.

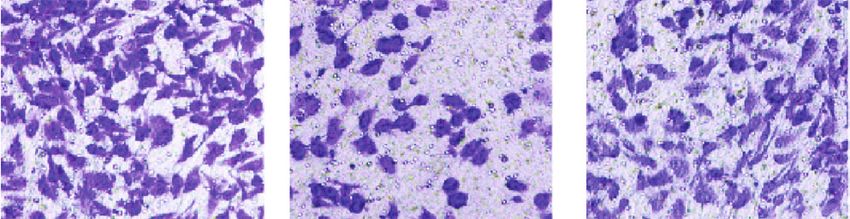
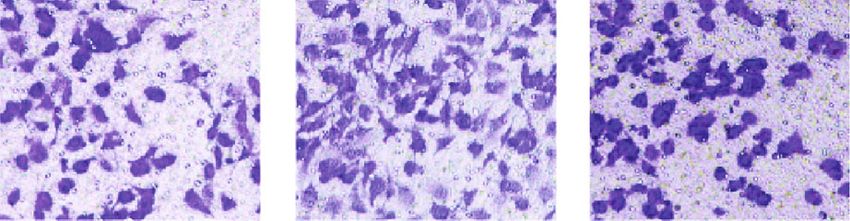
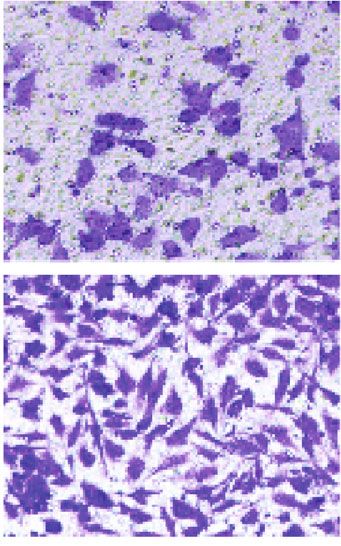
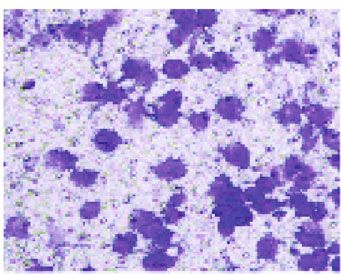
6 Oxidative Medicine and Cellular Longevity

 HBMEC Q1-UL Q1-UR Q1-UL Q1-UR Q1-UL Q1-UR
 ⁎ ⁎
 30
 Apoptotic cells (%)

 20

 PI

 PI
 PI
 10

 Q1-LL Q1-LR Q1-LL Q1-LR Q1-LL Q1-LR
 0
 OGD+NC

 OGD+oe-circPHKA2
 NC

 Annexin V-FITC Annexin V-FITC Annexin V-FITC
 NC OGD+NC OGD+oe-circPHKA2

 (a)
 HBMEC
 3 ⁎ ⁎ 4
 HBMEC
 ⁎ ⁎ GRP78
 ⁎ ⁎ ⁎ ⁎
 Relative protein

 Relative protein
 Bcl-2
 expression

 2 3 CHOP

 expression
 ⁎ ⁎ Bax 2
 1 Caspase-12
 1
 -Actin -Actin
 0 0
 Bcl-2 Bax OGD – + + OGD – + +
 GRP78 CHOP Caspase-12
 NC + + – NC + + –
 NC oe-circPHKA2 – – + NC oe-circPHKA2 – – +
 OGD+NC OGD+NC
 OGD+oe-circPHKA2 OGD+oe-circPHKA2

 (b) (c)

 SOD2

 -Actin
 Relative SOD activity (%)
 Relative MDA level (%)
Relative ROS level (%)

 400 HBMEC 400 HBMEC 150 HBMEC 1.5 HBMEC

 protein expression
 ⁎ ⁎ ⁎ ⁎ ⁎ ⁎
 ⁎ Relative SOD2
 300 300 ⁎
 100 1.0
 200 200
 100 50 0.5
 100
 0 0 0 0.0
 OGD+NC

 OGD+oe-circPHKA2
 NC

 OGD+NC

 OGD+oe-circPHKA2
 NC

 OGD+NC

 OGD+oe-circPHKA2
 NC
 OGD+NC

 OGD+oe-circPHKA2
 NC

 (d) (e) (f) (g)

Figure 3: circPHKA2 inhibited apoptosis, ER stress, and oxidative stress of HBMEC after OGD. OGD-induced HBMEC were
pretransfected with oe-circPHKA2 or NC, compared with control HBMEC transfected with NC. (a) FCM identified percentage of
apoptotic cells. (b, c) Western blotting detected relative protein expression of Bcl-2, Bax, GRP78, CHOP, caspase-12, and β-actin.
(d–f) Assay kits of ROS, MDA, and SOD examined relative ROS level, MDA level, and SOD activity, respectively. (g) Western
blotting detected relative SOD2 protein expression, normalized to β-actin. ∗ P < 0:05.

2.6. Transwell Migration Assay. An 8 μm pore transwell lowing crystal violet staining. Migratory cells per field were
chamber (Becton-Dickinson, San Jose, CA, USA) and 24- counted according to five fields (at ×100) of interest.
well plate were together employed to measure cell migration.
5 × 10⁵ cells were inoculated in the upper chamber without 2.7. Tube Formation Assay. 50 μL Growth Factor Reduced
serum and normal medium was in the lower chamber. After Matrigel (Becton-Dickinson) was planted onto 96-well
48 h of incubation, cells that transferred onto the bottom plates at 37°C for 30 min, and 1 × 10⁴ cells were planted in
face of the chamber were analyzed under a microscope fol- each well for 3 days. Ten random fields of interest were

Oxidative Medicine and Cellular Longevity 7

 1.0
 2.0 ⁎

 mRNA expression
 0.8

 mRNA expression

 Relative SOD2
 Relative SOD2
 1.5 0.6
 1.0 0.4
 0.5 0.2 P < 0.05
 R2 = 0.53
 0.0 0.0
 Control Cerebral stroke 0.0 0.2 0.4 0.6 0.8 1.0
 Relative circPHKA2
 expression
 (a) (b)
 HBMEC
 HBMEC ⁎ ⁎
 1.5 50
 protein expression

 40

 EdU+ cell (%)
 Relative SOD2

 1.0 30
 20
 0.5 ⁎
 10
 0.0 0
 si-NC si-SOD2 OGD + + +
 NC + – –
 SOD2 oe+circPHKA2 – + +
 -Actin si-NC + + –
 si-SOD2 – – +
 (c) (d)
 HBMEC
 250 ⁎ ⁎
 Cell viability (%)

 200
 150
 100
 50
 0
 OGD + + +
 NC + – –
 oe+circPHKA2 – + +
 si-NC + + –
 si-SOD2 – – +
 (e)
 HBMEC
 Migratory cells per field

 150
 ⁎ ⁎
 100

 50

 0
 OGD + + + OGD+ OGD+ OGD+
 NC + – – NC+si-NC oe−circPHKA2 oe−circPHKA2
 +si-NC +si-SOD2
 oe+circPHKA2 – + +
 si-NC + + –
 si-SOD2 – – +
 (f)

 Figure 4: Continued.
8 Oxidative Medicine and Cellular Longevity

 HBMEC
 250 ⁎ ⁎
 Tube formation (%) 200
 150
 100
 50
 OGD+ OGD+ OGD+
 0
 NC+si-NC oe−circPHKA2 oe−circPHKA2
 OGD + + +
 +si-NC +si-SOD2
 NC + – –
 oe−circPHKA2 – + +
 si-NC + + –
 si-SOD2 – – +
 (g)

Figure 4: circPHKA2 prompted proliferation, migration, and neovascularization of HBMEC after OGD by modulating SOD2. (a) qPCR
detected relative SOD2 mRNA expression in blood samples of AIS patients and healthy controls. (b) Pearson’s correlation analysis
analyzed the correlation between SOD2 mRNA and circPHKA2 expression in cerebral stroke patients. (c) qPCR detected relative SOD2
protein expression in HBMEC administrated with si-NC or si-SOD2. (d–g) OGD-induced HBMEC were pretransfected with oe-
circPHKA2, NC, or oe-circPHKA2 combined with si-NC or si-SOD2. (d) EdU assay determined percentage of EdU+ cells. (e) CCK-8
assay measured percentage of cell viability. (f) Transwell assay confirmed number of migratory cells per field (×100). (g) Tube formation
assay determined percentage of tube formation. ∗ P < 0:05.

selected for imaging, and tube formation rate was analyzed containing serum culture medium, and fluorescence inten-
on Quantity One software (Bio-Rad, Hercules, CA, USA). sity of the transformed DCF was measured on fluorescence
 microplate at 488 nm excitation wavelength/530 nm emis-
2.8. Flow Cytometry (FCM). Cell death of HBMEC with and sion wavelength.
without OGD treatment was determined by an Annexin V
Apoptosis Detection Kit FITC (eBioscience, San Diego, 2.11. Bioinformatics Algorithms and Dual-Luciferase Reporter
CA, USA) and a flow cytometer (Becton-Dickinson). Apo- Assay. CircInteractome, circBank, and starBase databases were
ptosis analysis was performed using Cell Quest Research used to predict the complementary sites of miRNAs in cir-
Software (Becton-Dickinson) by determining the percentage cPHKA2 and SOD2. The retrieval results of above databases
of early apoptotic cells and late apoptotic/necrotic cells [19]. were cross-screened using Venn diagram to find the overlap-
 ping miRNAs. These potential binding sites were examined
2.9. Western Blotting. The western blot analysis was per-
 using dual-luciferase reporter assay via pGL4 Luciferase
formed as previous study described [20] using 25 μg total pro-
 Reporter Vectors (Promega, Madison, WI, USA).
tein per lane. The primary antibodies (B cell lymphoma-2
 To construct a report vector for wild-type (WT) of cir-
(Bcl-2; A0208, 1 : 500, ABclonal), Bcl-2-associated X (Bax;
 cPHKA2, gDNA from HBMEC was used to amplify the
A7626, 1 : 1000, ABclonal), glucose-regulated protein 78 kD
 fragments (139-345 and 1519-1725) of circPHKA2 contain-
(GRP78; A4908, 1 : 10,000, ABclonal), C/EBP-homologous
 ing miR-574-5p response elements. The corresponding
protein (CHOP; A0854, 1 : 1000, ABclonal), caspase-12
 mutant-type (MUT) of circPHKA2 was generated by site-
(A0217, 1 : 1000, ABclonal), SOD2 (A19576, 1 : 1000, ABclo-
 directed mutagenesis using Hieff Mut™ Site-Directed Muta-
nal), and β-actin (AC038, 1 : 50,000, ABclonal)) were used.
 genesis Kit (YEASEN, Shanghai, China). Then, PCR prod-
HRP Goat Anti-Rabbit IgG (H+L) (AS014, 1 : 10,000, ABclo-
 ucts of WT-circPHKA2 and MUT-circPHKA2 were cloned
nal) was used for secondary antibody. The protein bands were
 into pGL4 vectors (Promega). Similarly, the fragment (308-
exposed by ChemiDoc™ XRS Imaging System (Bio-Rad), and
band density was quantified using Quantity One software 517) of SOD2 3 ′ UTR was chosen to generate WT-SOD3
(Bio-Rad). β-Actin was used to correct levels of special 3 ′ UTR vector and MUT-SOD3 3 ′ UTR vector. These recom-
proteins. binant vectors were cotransfected into HBMEC with com-
 mercial miR-574-5p or miR-NC for 48 h, and luciferase
2.10. Assay Kits for Reactive Oxygen Species (ROS), activities of luc2 (Photinus pyralis) and hRluc (Renilla reni-
Malondialdehyde (MDA), and SOD. SOD activity and levels formis) genes were examined using Dual-Glo® Luciferase
of ROS and MDA were separately measured using commer- Assay System (Promega) in differently transfected HBMEC.
cially assay kits (Beyotime, Shanghai, China) for total SOD,
ROS, and lipid peroxidation MDA. Cell lysates of HBMEC 2.12. Biotin-Labelled miRNA Capture and Argonaute 2
were prepared in cold PBS, and protein concentration was (Ago2) RNA Immunoprecipitation (RIP). Biotin was used to
quantified using Enhanced BCA Protein Assay Kit (Beyo- label WT and MUT of miR-574-5p (WT/MUT-bio-miR-
time, Shanghai, China). SOD activity and MDA level were 574-5p), which was provided by Genepharm (Shanghai,
calibrated by protein content. ROS level in HBMEC was China), as well as the biotin-coupled miR-NC (bio-miR-
evaluated by incubating in fluorescence probe DCFH-DA- NC). All of these bio-miRNAs were administrated in
Oxidative Medicine and Cellular Longevity 9

 107 Q1-UL Q1-UR
 107 Q1-UL Q1-UR
 107 Q1-UL Q1-UR
 40 HBMEC
 ⁎ 106 106 106
 Apoptotic cells (%)

 30 ⁎
 105 105 105

 PI

 PI

 PI
 20 4 4
 10 10 104
 10 103 103 103
 Q1-LL Q1-LR Q1-LL Q1-LR Q1-LL Q1-LR
 0 0 0 0
 3 4 5 6 7 3 4 5 6 7
 OGD + + + 0 10 10 10 10 10 0 10 10 10 10 10 0 10 10 10 106
 3 4 5
 107
 NC + – – Annexin V-FITC Annexin V-FITC Annexin V-FITC
 oe−circPHKA2 – + + OGD+ OGD+ OGD+
 si−NC + + – NC+si-NC oe-circPHKA2 oe-circPHKA2
 +si-NC +si-SOD2
 si−SOD2 – – +
 (a)
 HBMEC
 3
 ⁎ ⁎
 Relative protein

 Bcl-2
 expression

 2
 ⁎ ⁎ Bax
 1
 -Actin
 0 OGD + + +
 Bcl-2 Bax NC + – –
 OGD+NC+si-NC oe−circPHKA2 – + +
 OGD+oe-circPHKA2+si-NC si−NC + + –
 si−SOD2 – – +
 OGD+oe-circPHKA2+si-SOD2

 (b)

 HBMEC GRP78
 1.5 HBMEC
 150
 Relative ROS level (%)

 ⁎ ⁎ ⁎ ⁎ ⁎ ⁎
 ⁎ CHOP
 Relative protein

 ⁎
 expression

 1.0 100
 Caspase-12
 0.5 50
 -Actin
 0.0 OGD + + + 0
 GRP78 CHOP Caspase-12 NC + – – OGD + + +
 oe−circPHKA2 – + + NC + – –
 OGD+NC+si-NC
 si−NC + + – oe–circPHKA2 – + +
 OGD+oe-circPHKA2+si-NC
 si−SOD2 – – + si–NC + + –
 OGD+oe-circPHKA2+si-SOD2 si–SOD2 – – +
 (c) (d)
 HBMEC
 ⁎ ⁎
 Relative SOD activity (%)

 HBMEC
 Relative MDA level (%)

 150 250
 ⁎
 ⁎ 200
 100
 150
 100
 50
 50
 0 0
 OGD + + + OGD + + +
 NC + – – NC + – –
 oe–circPHKA2 – + + oe–circPHKA2 – + +
 si–NC + + – si–NC + + –
 si–SOD2 – – + si–SOD2 – – +
 (e) (f)

 Figure 5: Continued.

10 Oxidative Medicine and Cellular Longevity

 SOD2

 -Actin
 HBMEC
 2.5 ⁎ ⁎

 protein expression
 2.0

 Relative SOD2
 1.5
 1.0
 0.5
 0.0
 OGD + + +
 NC + – –
 oe–circPHKA2 – + +
 si–NC + + –
 si–SOD2 – – +
 (g)

Figure 5: circPHKA2 inhibited apoptosis, ER stress, and oxidative stress of HBMEC after OGD by modulating SOD2. OGD-induced
HBMEC were pretransfected with oe-circPHKA2, NC, or oe-circPHKA2 combined with si-NC or si-SOD2. (a) FCM identified
percentage of apoptotic cells. (b, c) Western blotting detected relative protein expression of Bcl-2, Bax, GRP78, CHOP, caspase-12, and
β-actin. (d–f) Assay kits of ROS, MDA, and SOD examined relative ROS level, MDA level, and SOD activity, respectively. (g) Western
blotting detected relative SOD2 protein expression, normalized to β-actin. ∗ P < 0:05.

HBMEC for 48 h, and cell lysate was obtained for incubation circPHKA2 was only amplified by divergent primers in
in streptomycin-magnetic beads (NEB, England, UK). The cDNA from HBMEC, while linear GAPDH was amplified by
pull-down RNAs were restored in TRIzol LS reagent (Invi- convergent primers in both cDNA and gDNA (Figure 1(d));
trogen) for qPCR. besides, linear PHKA2 mRNA could be amplified by random
 RIP-Assay Kit (MBL, Woburn, MA, USA) was used to hexamer primers and oligo (dT)18 primers, whereas cir-
perform IgG RIP in HBMEC using the normal rabbit IgG cPHKA2 expression was markedly decreased using the oligo
(negative control) or anti-IgG (RN003M, MBL). Protein (dT)18 primers (Figure 1(e)). On the other hand, PHKA2
A/G Agarose beads (YEASEN) were immobilized with mRNA expression was significantly descended after RNase R
15 μg antibodies at 4°C for 1 h with gentle rotation and then treatment, and circPHKA2 was resistant to that (Figure 1(f
incubated in the precleared cell lysate of HBMEC at 4°C for )). Furthermore, subcellular localization of circPPHKA2 was
4 h. Then, antibody-immobilized bead-ribonucleoprotein determined in nucleoplasmic separation, and the result was
(RNP) complex was used to restore total RNA as recom- that circPHKA2, like GAPDH, was dominantly found in the
mended by the manufacturer. cytoplasm (Figure 1(g)). These results indicated that cir-
 cPHKA2 was a circular and stable transcript that was mainly
2.13. Statistical Analysis. GraphPad Prism7 (GraphPad, La located in the cytoplasm of HBMEC and was downregulated
Jolla, CA, USA) was used to analyze the results of our exper- in AIS patients’ blood.
iments, which were shown as means ± standard deviations
(SD) of three independent samples. Difference comparisons
were analyzed by Student’s two-tailed t-test or one-way 3.2. circPHKA2 Prompted Proliferation, Migration, and
analysis of variance followed by the Bonferroni post hoc test. Neovascularization of HBMEC after OGD. Gain-of-function
Statistical significance was accepted at P < 0:05. experiments were carried out to measure role of circPHKA2 in
 dysfunction of HBMEC, and oe-circPHKA2 vector was used
3. Results to overexpress circPHKA2 via transfection (Figure 2(a)). Cell
 proliferation of HBMEC was suppressed after OGD, as evi-
3.1. Exon-Derived circPHKA2 Was Decreased in AIS Patients denced by the loss of EdU+ cells and cell viability
and OGD-Induced HBMEC. According to this cohort of (Figures 2(b) and 2(c)), whereas introducing oe-circPHKA2
cerebral stroke patients, blood circPHKA2 expression was vector could attenuate OGD-induced inhibition of cell prolif-
0.46-fold of controls (Figure 1(a)). Besides, level of cir- eration (Figures 2(b) and 2(c)). Transwell assay depicted that
cPHKA2 was lower in HBMEC after OGD (Figure 1(b)). OGD treatment decreased transwell migratory cells, and oe-
Thus, this circRNA was subjected to in-depth study. The circPHKA2-induced circPHKA2 overexpression could elevate
UCSC database showed that circPHKA2 was produced from migration of HBMEC (Figure 2(d)). Ectopic expression of cir-
exons 2-29 of host gene PHKA2 located on chromosome X, cPHKA2 could also rescue neovascularization of HBMEC
and Sanger sequencing confirmed the backsplicing site of after OGD, as described by the improvement of tube forma-
circPHKA2 (Figure 1(c)). Next, the circular structure of cir- tion rate in OGD-induced HBMEC with oe-circPHKA2
cPHKA2 was validated using special primers and RNase R administration than NC administration (Figure 2(e)). These
treatment. Gel electrophoresis after RT-PCR indicated that results demonstrated that reexpressing circPHKA2 might
Oxidative Medicine and Cellular Longevity 11

 circPHKA2
 circbank
 HBMEC
 258 ⁎

 Relative RNA enrichment
 circinteractome 25
 Starbase 20 ⁎
 67 18
 15 ⁎
 20 38
 2 2 10
 5
 0 1 2
 4 0
 7 circPHKA2 SOD2 miR−574-5p
 2
 Anti-lgG
 164 5
 Anti-lAgo2

 SOD1 starbase miR-574-5p
 (a) (b)
 HBMEC Position 1602-1609 of circPHKA2
 Relative RNA enrichment

 12
 ⁎
 ⁎ WT-circPHKA2 5′- -3′
 8
 miR-574-5p 3′- -5′

 4 MUT-circPHKA2 -3′
 5′-

 0
 circPHKA2 SOD2 Position 232-239 of circPHKA2
 WT-circPHKA2 5′- -3′
 bio-miR-NC
 WT-bio-miR-574-5p miR-574-5p 3′- -5′
 MUT-bio-miR-574-5p
 MUT-circPHKA2 5′- -3′
 (c) (d)
 HBMEC HBMEC
 Relative luciferase activiy

 15 1.5
 ⁎
 Relative miR-574-5p
 expression

 10 1.0 ⁎

 5 0.5

 0 0.0
 miR-NC miR-574-5p WT MUT
 Position 232-239 of circPHKA2

 miR-NC
 miR-574-5p
 (e) (f)
 Relative luciferase activity

 1.5 HBMEC

 1.0
 ⁎ Binding site: chr6:160103115-160103120[–]

 0.5 WT-SOD2 3′UTR 5′- -3′

 0.0 miR-574-5p 3′- -5′
 WT MUT
 Position 1602-1609 of circPHKA2 MUT-SOD2 3′UTR 5′- -3′

 miR-NC
 miR-574-5p
 (g) (h)

 Figure 6: Continued.
12 Oxidative Medicine and Cellular Longevity

 SOD2

 -Actin

 HBMEC
 Relative luciferase activiy

 1.5 1.5 HBMEC 1.5 HBMEC

 protein expression
 mRNA expression

 Relative SOD2
 Relative SOD2
 1.0 1.0 1.0
 ⁎ ⁎
 0.5 0.5 ⁎ 0.5

 0.0 0.0 0.0
 WT- MUT- miR-NC miR-574-5p miR-NC miR-574-5p
 SOD2 3′UTR SOD2 3′UTR

 miR-NC
 miR-574-5p
 (i) (j) (k)

 SOD2

 -Actin

 HBMEC HBMEC
 ⁎ ⁎ 2.5 ⁎ ⁎
 4
 protein expression
 mRNA expression

 2.0
 Relative SOD2
 Relative SOD2

 3
 1.5
 2
 1.0
 1 0.5
 0 0.0
 NC+miR-NC

 oe-circPHKA2+miR-574-5p
 NC+miR-NC

 oe-circPHKA2+miR-574-5p

 oe-circPHKA2+miR-NC
 oe-circPHKA2+miR-NC

 (l) (m)

Figure 6: circPHKA2 mediated the regulation of SOD2 via serving as sponge for miR-574-5p. (a) Venn diagram showed the computational
miRNAs that could target circPHKA2 and SOD2 according to CircInteractome, circBank, and starBase databases. (b) RIP and qPCR
detected relative RNA enrichment of circPHKA2, SOD2, and miR-574-5p by anti-Ago2 in HBMEC, normalized to anti-IgG-mediated
RIP. (c) Biotin-labelled miRNA capture examined relative RNA enrichment of circPHKA2 and SOD2 by probes of bio-miR-NC, WT-
bio-miR-74-5p, and MUT-bio-miR-574-5p. (d) Schematic drawing showed the predicted binding sites between miR-574-5p and WT-
circPHKA2 or MUT-circPHKA2 according to two positions of circPHKA2. (e) qPCR detected relative miR-574-5p expression in
HBMEC administrated with commercial miR-574-5p or miR-NC. (f, g) Dual-luciferase reporter assay measured relative luciferase
activity of WT-circPHKA2 vectors and MUT-circPHKA2 vectors in HBMEC administrated with commercial miR-574-5p or miR-NC.
(h) Schematic drawing showed the predicted binding sites between miR-574-5p and WT-SOD2 3 ′ UTR or MUT-SOD2 3 ′ UTR. (i) Dual-
luciferase reporter assay measured relative luciferase activity of WT-SOD2 3 ′ UTR vector and MUT-SOD2 3 ′ UTR vector in HBMEC
administrated with commercial miR-574-5p or miR-NC. qPCR and western blotting examined relative SOD2 mRNA and protein
expression in HBMEC administrated with (j, k) commercial miR-574-5p or miR-NC and (l, m) oe-circPHKA2 along with commercial
miR-574-5p or miR-NC and NC along with miR-NC. ∗ P < 0:05.

prompt proliferation, migration, and neovascularization of OGD-induced HBMEC accompanying with higher Bcl-2
HBMEC after OGD. and lower Bax (Figures 3(a) and 3(b)). Western blotting also
 showed the upregulation of ER-related proteins GRP78,
3.3. circPHKA2 Inhibited Apoptosis, ER Stress, and Oxidative CHOP, and caspase-12 in response to OGD treatment, and
Stress of HBMEC after OGD. OGD induced high apoptosis administrating oe-circPHKA2 could overall downregulate
in HBMEC (Figures 3(a) and 3(b)), and circPHKA2 overex- expression of those proteins (Figure 3(c)). Assay kits
pression via transfection diminished apoptotic cell rate of revealed that oxidative stress-associated factors ROS and
Oxidative Medicine and Cellular Longevity 13

 3 ⁎ 3 HBMEC
 ⁎

 Relative miR-574-5p

 Relative miR-574-5p
 2

 expression
 2

 expression
 1 1

 0 0
 Control Cerebral stroke Control OGD
 (a) (b)
 HBMEC HBMEC
 ⁎ ⁎ ⁎ ⁎
 50 250
 40 200

 Cell viability (%)
 EdU+ cell (%)

 30 150
 20 100
 10 50
 0 0
 OGD + + + OGD + + +
 NC + – – NC + – –
 oe-circPHKA2 – + + oe-circPHKA2 – + +
 miR-NC + + – miR-NC + + –
 miR-574-5p – – + miR-574-5p – – +
 (c) (d)

 OGD+
 NC+miR-NC
 150 HBMEC
 ⁎ ⁎
 Migratory cells per f ield

 100
 OGD+
 oe-circPHKA2
 50 +miR-NC

 0
 OGD + + +
 NC + – – OGD+
 oe-circPHKA2 – + + oe-circPHKA2
 miR-NC + + – +miR-574-5p
 miR-574-5p – – +

 (e)

 Figure 7: Continued.
14 Oxidative Medicine and Cellular Longevity

 OGD+
 NC+miR-NC
 HBMEC
 250 ⁎ ⁎

 Tube formation (%)
 200

 150
 OGD+
 100 oe-circPHKA2
 +miR-NC
 50

 0
 OGD + + +
 NC + – – OGD+
 oe-circPHKA2 – + + oe-circPHKA2
 miR-NC + + – +miR-574-5p
 miR-574-5p – – +

 (f)

Figure 7: circPHKA2 regulated proliferation, migration, and neovascularization of HBMEC after OGD by controlling miR-574-5p. (a) qPCR
detected relative miR-574-5p expression in blood samples of AIS patients and healthy controls. (b) qPCR detected relative miR-574-5p
expression in control HBMEC and HBMEC treated with OGD. (c–f) OGD-induced HBMEC were pretransfected with oe-circPHKA2, NC,
or oe-circPHKA2 combined with commercial miR-574-5p or miR-NC. (c) EdU assay determined percentage of EdU+ cells. (d) CCK-8 assay
measured percentage of cell viability. (e) Transwell assay confirmed number of migratory cells per field (×100). (f) Tube formation assay
determined percentage of tube formation. ∗ P < 0:05.

MDA were highly induced whereas SOD activity was inhib- 3.5. circPHKA2 Mediated the Regulation of SOD2 via Serving
ited in OGD-induced HBMEC (Figures 3(d)–3(g)), which as a Sponge for miR-574-5p. Furthermore, the link between
was salvaged with ectopic expression of circPHKA2 circPHKA2 and SOD2 was further explored, and bioinfor-
(Figures 3(d)–3(g)). These data demonstrated that reexpres- matics algorithms put forward that miR-574-5p was comple-
sing circPHKA2 might inhibit apoptosis, ER stress, and oxi- mentary to the primary sequences of both circPHKA2 and
dative stress of HBMEC after OGD. SOD2 (Figure 6(a)). Ago2 RIP assay showed a coenrichment
 of circPHKA2, SOD2, and miR-574-5p in cell lysate of HBMEC
3.4. circPHKA2 Relieved OGD-Induced Injuries in HBMEC (Figure 6(b)), and RNA pull-down assay revealed that cir-
by Modulating SOD2. We noticed that SOD2 mRNA expres- cPHKA2 and SOD2 were coenriched by WT-bio-miR-574-5p
sion was downregulated in the bloods from 32 AIS patients rather than MUT-bio-miR-574-5p (Figure 6(c)). According to
(Figure 4(a)), and this expression was positively and linearly CircInteractome, there were two predicted miR-574-5p-binding
correlated with circPHKA2 (Figure 4(b)). Functionally, positions of circPHKA2, and the potential response elements
SOD2 silencing in HBMEC via si-SOD2 administration were mutated (Figure 6(d)). Commercial miR-574-5p was
could counteract the promoting roles of circPHKA2 in administrated into HBMEC to overexpress miR-574-5p
EdU incorporation and cell viability of OGD-induced (Figure 6(e)), and this overexpression significantly reduced rel-
HBMEC (Figures 4(c)–4(e)). Moreover, transwell migration ative luciferase activities of WT-circPHKA2 report vectors,
and tube formation of HBMEC after OGD were rescued by leaving alone the MUT vectors (Figures 6(f) and 6(g)). Likewise,
overexpressing circPHKA2, and this rescue was weakened starBase-predicted miR-574-5p response elements in SOD2 3′
when si-SOD2 was introduced (Figures 4(f) and 4(g)). UTR were site-mutated (Figure 6(h)), and miR-574-5p trans-
OGD-induced high apoptotic rate and Bax expression in fection could descend the luciferase activity of WT-SOD2 3 ′
HBMEC were decreased by upregulating circPHKA2, which UTR vector (Figure 6(i)). Ectopic expression of miR-574-5p
were then increased by downregulating SOD2 (Figures 5(a) and circPHKA2 could, respectively, downregulate and upregu-
and 5(b)). Similarly, ER stress and oxidative stress of late SOD2 expression levels (Figures 6(j)–6(m)); meanwhile,
OGD-induced HBMEC were restrained by circPHKA2 reex- miR-574-5p overexpression was an obstacle for the regulatory
pression, and unsurprisingly, this restraint was attenuated in effect of circPHKA2 on SOD2 (Figures 6(l) and 6(m)). These
the presence of si-SOD2, as indicated by the increased levels findings showed that there was a direct interaction between cir-
of GRP78, CHOP, caspase-12, ROS, and MDA cPHKA2 and miR-574-5p and miR-574-5p and SOD2 and that
(Figures 5(c)–5(e)), as well as decreased SOD2 level and circPHKA2 might modulate SOD2 expression via miR-574-5p.
SOD activity (Figures 5(f) and 5(g)). These results demon-
strated that SOD2 inhibition partially abrogated the roles 3.6. circPHKA2 Relieved OGD-Induced Injuries in HBMEC
of circPHKA2 overexpression in OGD-induced HBMEC, by Controlling miR-574-5p. Expression of miR-574-5p was
suggesting that circPHKA2 might suppress OGD-induced 2.11-fold high in blood of AIS patients and OGD-treated
injuries in HBMEC by modulating SOD2. HBMEC (Figures 7(a) and 7(b)). Cotransfecting with
Oxidative Medicine and Cellular Longevity 15

 10 7 Q1-UL Q1-UR 10 7 Q1-UL Q1-UR 10 7 Q1-UL Q1-UR
 40 HBMEC
 10 6 10 6 10 6
 Apoptotic cells (%)
 ⁎
 30
 ⁎ 10 5 10 5 10 5

 PI

 PI

 PI
 20 4 4
 10 10 10 4
 10 10 3
 10 3
 10 3
 Q1-LL Q1-LR Q1-LL Q1-LR Q1-LL Q1-LR
 0 0 0 0
 OGD + + + 0 10 3 10 4 10 5 10 6 10 7 0 10 3 10 4 10 5 10 6 10 7 0 10 3 10 4 10 5 10 6 10 7
 NC + – – Annexin V-FITC Annexin V-FITC Annexin V-FITC
 oe+circPHKA2 – + +
 OGD+ OGD+ OGD+
 miR-NC + + –
 NC+si-NC oe-circPHKA2 oe-circPHKA2
 miR-574-5p – – + +miR-NC +miR-574-5p

 (a)

 3 HBMEC
 ⁎ ⁎
 Bcl-2
 Relative protein

 2
 expression

 ⁎ Bax
 ⁎
 1
 -Actin
 0
 OGD + + +
 Bcl-2 Bax
 NC + – –
 OGD+NC+miR-NC oe+circPHKA2 – + +
 OGD+oe-circPHKA2+miR-NC miR-NC + + –
 miR-574-5p – – +
 OGD+oe-circPHKA2+miR-574-5p

 (b)

 GRP78
 HBMEC
 HBMEC 150
 Relative ROS level (%)
 1.5
 ⁎ ⁎ ⁎ ⁎
 CHOP
 ⁎ ⁎
 Relative protein

 1.0 ⁎ ⁎ 100
 expression

 Caspase-12
 0.5 50
 -Actin

 0.0 OGD + + + 0
 GRP78 CHOP Caspase-12 NC + – –
 OGD + + +
 oe–circPHKA2 – + + NC + – –
 OGD+NC+miR-NC
 miR-NC + + – oe–circPHKA2 – + +
 OGD+oe-circPHKA2+miR-NC
 miR-574-5p – – + miR-NC + + –
 OGD+oe-circPHKA2+miR-574-5p miR-574-5p – – +
 (c) (d)
 HBMEC
 Relative SOD activity (%)

 HBMEC ⁎ ⁎
 Relative MDA level (%)

 150 250
 ⁎
 ⁎ 200
 100
 150
 100
 50
 50
 0 0
 OGD + + + OGD + + +
 NC + – – NC + – –
 oe–circPHKA2 – + + oe–circPHKA2 – + +
 miR-NC + + – miR-NC + + –
 miR-574-5p – – + miR-574-5p – – +
 (e) (f)

Figure 8: circPHKA2 inhibited apoptosis, ER stress, and oxidative stress of HBMEC after OGD by modulating SOD2. OGD-induced HBMEC were
pretransfected with oe-circPHKA2, NC, or oe-circPHKA2 combined with commercial miR-574-5p or miR-NC. (a) FCM identified percentage of
apoptotic cells. (b, c) Western blotting detected relative protein expression of Bcl-2, Bax, GRP78, CHOP, caspase-12, and β-actin. (d–f) Assay kits of
ROS, MDA, and SOD examined relative ROS level, MDA level, and SOD activity, respectively. ∗ P < 0:05.
16 Oxidative Medicine and Cellular Longevity

commercial miR-574-5p, oe-circPHKA2 vector-mediated 5p and circPHKA2 or SOD2, these data together revealed a
promotions of EdU+ cells, cell viability, transwell migratory circPHKA2-miR-574-5p-SOD2 ceRNA axis in stroke-
cells, and tube formation rate in HBMEC after OGD were induced neurovascular damage.
partially abated (Figures 7(c)–7(f)), as well as the inhibitions The characteristics of miR-574-5p association with tar-
of apoptotic cells and expression of Bax, GRP78, CHOP, and get genes were suggested to be capable of diagnostic bio-
caspase-13, as well as productions of ROS and MDA markers in stroke [17]. miR-574-5p-SOD2 interaction was
(Figures 8(a)–8(e)). SOD2 activity was salvaged by ectopic discovered by us in cerebral IS; however, the expression of
circPHKA2 in OGD-induced HBMEC, and it was further SOD2 in ischemic lesion tissues was not further detected in
declined due to commercial miR-574-5p (Figure 8(f)). These this study. Instead, we concentrated on its expression and
results concluded that circPHKA2 protected HBMEC from activity in circulating bloods and OGD-induced AIS model
OGD-induced injuries by controlling miR-574-5p. in HBMEC.
 Oxidative stress played fundamental role in the patho-
4. Discussion genesis of ischemic brain injury, and SOD2 gene polymor-
 phism might contribute to individual variability in
IS was a multifactorial disease contributing to mortality and oxidative stress status [12, 23]. SOD2 and glutathione were
neurological dysfunction. Currently, circRNAs such as hsa_ critical for the cellular antioxidant defense in neurodegener-
circ_0000607, circFUNDC1, circPDS5B, and circCDC14A ative diseases including cerebral ischemia [24]. Thus, target-
had been promising candidates as biomarkers and targets ing mitochondrial oxidative, focusing on SOD2, might be an
in Chinese population-based AIS patients, due to their high effective approach to alleviate ischemic injury. SOD2 expres-
specificity and stability [7, 21]. Here, we investigated the sion and activity could be regulated by circPHKA2-miR-
dysregulation of circulating circPHKA2 in AIS patients and 574-5p axis in this study, as well as proinflammatory cyto-
further confirmed the role and competitive endogenous kines and ROS overproduction [16]. Besides, SOD2 overex-
RNA (ceRNA) regulatory mechanism of circPHKA2 in neu- pression could block oxidative stress, ER stress, and
rovascular damage induced by OGD. apoptosis [25], and our data showed that SOD2 blockage
 First of all, expression of circPHKA2 was observed to be was contributing to those detrimental cell responses after
lower in blood of AIS patients and cell model of cerebral IS OGD. Angiogenesis participated in the recovery from IS,
induced by OGD in HBMEC. The downregulation of blood and SOD2 overexpression in mice reduced vascular endo-
circPHKA2 in stroke patients was previously reported by Lu thelial cell death after ischemia and reperfusion [14]. In
et al. [10]. Then, we characterized the circular structure and vitro, we noticed that higher SOD2 was one of the conse-
stability of circPHKA2 using a series of assays. As a result, quences of circPHKA2 reexpression in OGD-subjected
Sanger sequencing identified the head-to-tail connection of HBMEC during the salvation of tube formation, prolifera-
exon-born circPHKA2, and circPHKA2 could not be ampli- tion, and migration. This study might be the first clear and
fied by convergent primers and oligo (dT)18 primers, sug- convincing evidence that SOD2 upregulation might be con-
gesting that circPHKA2 showed no linear structure. ductive to neuroprotection by enhancing vascular endothe-
Furthermore, circPHKA2 expression was found to be resis- lial cell proliferation, migration, and neovascularization.
tant to RNase R digestion, and this finding additionally indi- In conclusion, we demonstrated the abnormal downreg-
cated circPHKA2 with a loop conformation. Next, ulation of circPHKA2 in blood of AIS patients and the sup-
subcellular location assay indicated that circPHKA2 was pression of circPHKA2 reexpression in OGD-induced
inclined to be cytoplasmic distribution, which was consistent HBMEC. Moreover, circPHKA2 protected HBMEC from
with the notion that exon-derived circRNAs were mostly OGD-induced neurovascular injuries by controlling SOD2
located in the cytoplasm and functioned as miRNA sponges via sponging miR-574-5p. This study indicated that the cir-
[22]. And subsequently, it was validated that circPHKA2 cPHKA2-miR-574-5p-SOD2 ceRNA axis might be a novel
could sponge miR-574-5p to regulate SOD2 expression in antioxidant-based neurovascular protective strategy in IS.
HBMEC, and colocalization of the three RNAs was also con- Our research might be the first strong evidence describing
firmed by the RIP and pull-down assays. By the way, miR- the cellular functions of circPHKA2.
1962 might be another target for circPHKA2 in regulating
functional genes in the ischemic brain [10]. Data Availability
 Functionally, allied to reexpression of circPHKA2 in
OGD-induced HBMEC was the improvement of cell prolifer- No data were used to support this study.
ation, migration, and neovascularization and the mitigation of
apoptosis, oxidative stress, and ER stress. These findings indi- Conflicts of Interest
cated the neurovascular protection of circPHKA2 in stroke.
Furthermore, this protection was partially but distinctively The authors declare that they have no conflicts of interest.
abrogated by inhibiting SOD2 or facilitating miR-574-5p.
Molecularly, SOD2 downregulation and miR-574-5p upregu- References
lation were paralleled with circPHKA2 downregulation in
AIS patients’ blood; moreover, there was a linear correlation [1] J. F. Meschia, C. Bushnell, B. Boden-Albala et al., “Guidelines
between SOD2 and circPHKA2 expression in these blood for the primary prevention of Stroke,” Stroke, vol. 45, no. 12,
samples. Coupled with direct interactions between miR-574- pp. 3754–3832, 2014.
Oxidative Medicine and Cellular Longevity 17

 [2] B.-H. Chao, F. Yan, Y. Hua et al., “Stroke prevention and con- [19] S. H. Li, L. Chen, X. M. Pang et al., “Decreased miR-146a
 trol system in China: CSPPC-Stroke Program,” International expression in acute ischemic stroke directly targets the Fbxl10
 Journal of Stroke, vol. 16, no. 3, pp. 265–272, 2021. mRNA and is involved in modulating apoptosis,” Neurochem-
 [3] Z. Feng, Q. Sun, W. Chen, Y. Bai, D. Hu, and X. Xie, “The neu- istry International, vol. 107, pp. 156–167, 2017.
 roprotective mechanisms of ginkgolides and bilobalide in cere- [20] F. Zhao, F. Lei, X. Yan, S. Zhang, W. Wang, and Y. Zheng,
 bral ischemic injury: a literature review,” Molecular Medicine, “Protective effects of hydrogen sulfide against cigarette smoke
 vol. 25, no. 1, p. 57, 2019. exposure-induced placental oxidative damage by alleviating
 [4] P. W. Silva, S. M. M. Shimon, L. M. de Brito et al., “Novel redox imbalance via Nrf2 pathway in rats,” Cellular Physiology
 insights toward human stroke-related epigenetics: circular and Biochemistry, vol. 48, no. 5, pp. 1815–1828, 2018.
 RNA and its impact in poststroke processes,” Epigenomics, [21] S. Li, L. Chen, C. Xu et al., “Expression profile and bioinfor-
 vol. 12, no. 22, pp. 1957–1968, 2020. matics analysis of circular RNAs in acute ischemic stroke in
 [5] S. W. Wang, Z. Liu, and Z. S. Shi, “Non-coding RNA in acute a South Chinese Han population,” Scientific Reports, vol. 10,
 ischemic stroke: mechanisms, biomarkers and therapeutic tar- no. 1, article 10138, 2020.
 gets,” Cell Transplantation, vol. 27, no. 12, pp. 1763–1777, [22] X. Li, L. Yang, and L. L. Chen, “The biogenesis, functions, and
 2018. challenges of circular RNAs,” Molecular Cell, vol. 71, no. 3,
 [6] L. Chen and G. Shan, “CircRNA in cancer: fundamental mech- pp. 428–442, 2018.
 anism and clinical potential,” Cancer Letters, vol. 505, pp. 49–57, [23] E. Jówko, D. Gierczuk, I. Cieśliński, and J. Kotowska, “SOD2-
 2021. gene polymorphism and response of oxidative stress parame-
 [7] L. Zuo, L. Zhang, J. Zu et al., “Circulating circular RNAs as bio- ters in young wrestlers to a three-month training,” Free
 markers for the diagnosis and prediction of outcomes in acute Radical Research, vol. 51, no. 5, pp. 506–516, 2017.
 ischemic stroke,” Stroke, vol. 51, no. 1, pp. 319–323, 2020. [24] J. Ruszkiewicz and J. Albrecht, “Changes in the mitochondrial
 [8] Z. Dong, L. Deng, Q. Peng, J. Pan, and Y. Wang, “CircRNA antioxidant systems in neurodegenerative diseases and acute
 expression profiles and function prediction in peripheral blood brain disorders,” Neurochemistry International, vol. 88,
 mononuclear cells of patients with acute ischemic stroke,” pp. 66–72, 2015.
 Journal of Cellular Physiology, vol. 235, no. 3, pp. 2609–2618, [25] J. Zhong, C. Xu, R. Gabbay-Benziv, X. Lin, and P. Yang, “Super-
 2020. oxide dismutase 2 overexpression alleviates maternal diabetes-
 [9] Q. Wang, X. Liu, J. Zhao, and R. Zhu, “Circular RNAs: novel diag- induced neural tube defects, restores mitochondrial function
 nostic and therapeutic targets for ischemic stroke,” Expert Review and suppresses cellular stress in diabetic embryopathy,” Free
 of Molecular Diagnostics, vol. 20, no. 10, pp. 1039–1049, 2020. Radical Biology and Medicine, vol. 96, pp. 234–244, 2016.
[10] D. Lu, E. S. Ho, H. Mai et al., “Identification of blood circular
 RNAs as potential biomarkers for acute ischemic stroke,”
 Front Neurosci, vol. 14, no. 81, 2020.
[11] T. Fukai and M. Ushio-Fukai, “Superoxide dismutases: role in
 redox signaling, vascular function, and diseases,” Antioxidants
 & Redox Signaling, vol. 15, no. 6, pp. 1583–1606, 2011.
[12] I. F. Domingos, D. A. Pereira-Martins, R. L. Borges-Medeiros
 et al., “Evaluation of oxidative stress-related genetic variants
 for predicting stroke in patients with sickle cell anemia,” Jour-
 nal of the Neurological Sciences, vol. 414, no. 116839,
 p. 116839, 2020.
[13] S. L. Mehta, Y. Lin, W. Chen et al., “Manganese superoxide dis-
 mutase deficiency exacerbates ischemic brain damage under
 hyperglycemic conditions by altering autophagy,” Transla-
 tional Stroke Research, vol. 2, no. 1, pp. 42–50, 2011.
[14] C. M. Maier, L. Hsieh, T. Crandall, P. Narasimhan, and P. H.
 Chan, “Evaluating therapeutic targets for reperfusion-related
 brain hemorrhage,” Annals of Neurology, vol. 59, no. 6,
 pp. 929–938, 2006.
[15] A. M. Dosunmu-Ogunbi, K. C. Wood, E. M. Novelli, and A. C.
 Straub, “Decoding the role of SOD2 in sickle cell disease,”
 Blood Advances, vol. 3, no. 17, pp. 2679–2687, 2019.
[16] J. E. Jung, G. S. Kim, H. Chen et al., “Reperfusion and neuro-
 vascular dysfunction in stroke: from basic mechanisms to
 potential strategies for neuroprotection,” Molecular Neurobiol-
 ogy, vol. 41, no. 2-3, pp. 172–179, 2010.
[17] C. Kondybayeva, A. Akimniyazova, S. Kamenova et al., “Pre-
 diction of miRNA interaction with mRNA of stroke candidate
 genes,” Neurological Sciences, vol. 41, no. 4, pp. 799–808, 2020.
[18] K. J. Livak and T. D. Schmittgen, “Analysis of Relative Gene
 Expression Data Using Real-Time Quantitative PCR and the
 2−ΔΔ _C_T Method,” Methods, vol. 25, no. 4, pp. 402–408, 2001.
You can also read