Cholesterol and Triglyceride Concentrations, COVID-19 Severity, and Mortality: A Systematic Review and Meta-Analysis With Meta-Regression
←
→
Page content transcription
If your browser does not render page correctly, please read the page content below

SYSTEMATIC REVIEW
                                                                                                                                                  published: 18 August 2021
                                                                                                                                           doi: 10.3389/fpubh.2021.705916

                                              Cholesterol and Triglyceride
                                              Concentrations, COVID-19 Severity,
                                              and Mortality: A Systematic Review
                                              and Meta-Analysis With
                                              Meta-Regression
                                              Angelo Zinellu 1 , Panagiotis Paliogiannis 2,3 , Alessandro G. Fois 2 , Paolo Solidoro 4,5 ,
                                              Ciriaco Carru 1,3 and Arduino A. Mangoni 6,7*
                                              1
                                                Department of Biomedical Sciences, University of Sassari, Sassari, Italy, 2 Department of Medical, Surgical and
                                              Experimental Sciences, University of Sassari, Sassari, Italy, 3 Quality Control Unit, University Hospital of Sassari (Azienda
                                              Ospedaliero-Universitaria di Sassari), Sassari, Italy, 4 Division of Respiratory Medicine, Cardiovascular and Thoracic
                                              Department, AOU Città Della Salute e della Scienza, Torino, Italy, 5 Medical Sciences Department, University of Turin, Torino,
                                              Italy, 6 Discipline of Clinical Pharmacology, College of Medicine and Public Health, Flinders University Adelaide, Adelaide, SA,
                         Edited by:           Australia, 7 Department of Clinical Pharmacology, Southern Adelaide Local Health Network, Flinders Medical Centre,
                 Susanna Hofmann,             Adelaide, SA, Australia
   Helmholtz-Gemeinschaft Deutscher
    Forschungszentren (HZ), Germany
                                              Lipid profile alterations have been observed in patients with coronavirus disease 2019
                        Reviewed by:
                          Željko Reiner,      (COVID-19) in relation to disease severity and mortality. We conducted a systematic
           University Hospital Centre         review and meta-analysis with meta-regression of studies reporting total, HDL, and
                       Zagreb, Croatia
                                              LDL-cholesterol, and triglyceride concentrations in hospitalized patients with COVID-
                      Jürgen Harreiter,
  Medical University of Vienna, Austria       19. We searched PubMed, Web of Science and Scopus, between January 2020 and
                 *Correspondence:             January 2021, for studies describing lipid concentrations, COVID-19 severity, and survival
                 Arduino A. Mangoni           status (PROSPERO registration number: CRD42021253401). Twenty-two studies in
     arduino.mangoni@flinders.edu.au
                                              10,122 COVID-19 patients were included in the meta-analysis. Pooled results showed
                    Specialty section:        that hospitalized patients with severe disease or non-survivor status had significantly
          This article was submitted to       lower total cholesterol (standardized mean difference, SMD = −0.29, 95% CI −0.41
                       Clinical Diabetes,
                a section of the journal
                                              to −0.16, p < 0.001), LDL-cholesterol (SMD = −0.30, 95% CI −0.41 to −0.18, p
              Frontiers in Public Health      < 0.001), and HDL-cholesterol (SMD = −0.44, 95% CI −0.62 to −0.26, p < 0.001),
            Received: 07 May 2021             but not triglyceride (SMD = 0.04, 95% CI −0.10 to −0.19, p = 0.57), concentrations
            Accepted: 27 July 2021            compared to patients with milder disease or survivor status during follow up. Between-
          Published: 18 August 2021
                                              study heterogeneity was large-to-extreme. In sensitivity analysis, the effect size of
                               Citation:
     Zinellu A, Paliogiannis P, Fois AG,      different lipid fractions was not affected when each study was in turn removed. The
 Solidoro P, Carru C and Mangoni AA           Begg’s and Egger’s t-tests did not show evidence of publication bias, except for
   (2021) Cholesterol and Triglyceride
 Concentrations, COVID-19 Severity,
                                              studies investigating LDL-cholesterol. In meta-regression, significant associations were
  and Mortality: A Systematic Review          observed between the SMD of LDL-cholesterol and age and hypertension, and between
                and Meta-Analysis With        the SMD of triglycerides and study endpoint and aspartate aminotransferase. In our
                      Meta-Regression.
        Front. Public Health 9:705916.        systematic review and meta-analysis, lower total, HDL, and LDL-cholesterol, but not
    doi: 10.3389/fpubh.2021.705916            triglyceride, concentrations were significantly associated with COVID-19 severity and

Frontiers in Public Health | www.frontiersin.org                                      1                                             August 2021 | Volume 9 | Article 705916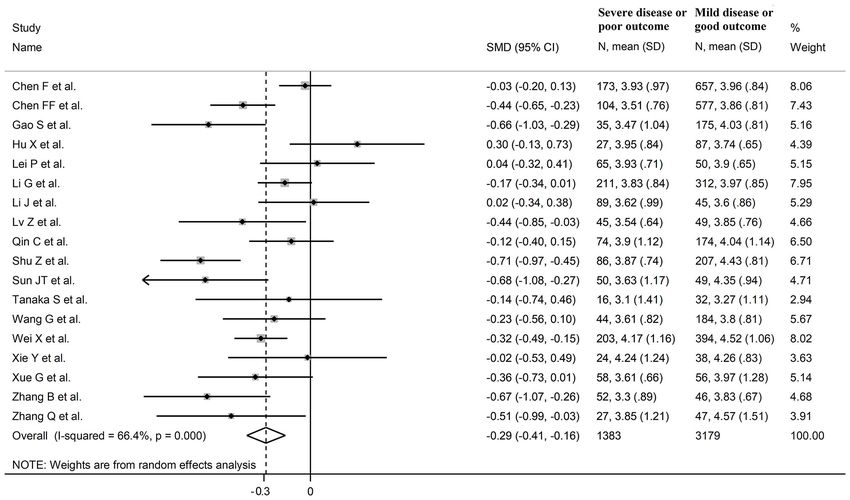
Zinellu et al.                                                                                                                                Lipids and COVID-19

                                              mortality. Cholesterol concentrations might be useful, in combination with other clinical
                                              and demographic variables, for risk stratification and monitoring in this group.
                                              Systematic       Review      Registration:       PROSPERO        registration    number:
                                              CRD42021253401.
                                              Keywords: cholesterol, triglycerides, COVID-19, disease severity, mortality

INTRODUCTION                                                                         MATERIALS AND METHODS
Since the start of the coronavirus disease 2019 (COVID-                              Search Strategy, Eligibility Criteria, and
19) pandemic significant advances have been made in the                              Study Selection
identification of specific patient characteristics that are associated               A systematic literature search was conducted in the electronic
with different disease severity and clinical outcomes. For                           databases PubMed, Web of Science and Scopus, from January
example, pre-existing comorbidities such as hypertension,                            2020 to January 2021, using the following terms and their
obesity and diabetes, clinical parameters such as hypoxia and CT-                    combination: “cholesterol” or “LDL” or “low-density lipoprotein”
chest imaging findings, and circulating markers of inflammation,                     or “HDL” or “high-density lipoprotein” or “triglycerides” and
nutrition, hemostasis, and single organ function, have been                          “COVID-19” or “Coronavirus disease-2019” (PROSPERO
investigated in observational studies in COVID-19 patients in                        registration number: CRD42021253401). Abstracts were
order to develop and validate scoring tools for risk stratification                  screened independently by two investigators. If relevant, the full
and monitoring (1, 2). However, the continuing pressures                             text of the articles were independently reviewed. The references
on health care systems and the unpredictable progression                             of the retrieved articles were also reviewed to identify additional
of the pandemic, with new variants of the causative agent,                           studies. Eligibility criteria included (i) assessment of total
severe acute respiratory syndrome coronavirus 2 (SARS-CoV-                           cholesterol and/or LDL-cholesterol and/or HDL-cholesterol
2), being discovered, additional efforts are required to further                     and/or triglyceride concentrations in COVID-19 patients; (ii)
improve the performance of existing predictive tools (3).                            investigation of COVID-19 patients with different disease
There is increasing evidence of significant alterations in lipid                     severity, based on current clinical guidelines or admission to
profile, particularly total cholesterol, LDL-cholesterol, and HDL-                   the Intensive Care Unit (ICU), or survival status, (iii) adult
cholesterol concentrations in hospitalized patients with COVID-                      patients, (iv) ≥10 subjects, (v) English language, and (vi)
19. While increasing concentrations of cholesterol in the cell                       full-text available. The references of the retrieved articles and
membrane have been reported to increase the binding activity                         reviews were also searched to identify additional studies. Any
of SARS-CoV-2, facilitating membrane fusion and the successful                       disagreement between the reviewers was resolved by a third
entry of the virus to the host (4, 5), clinical studies have                         investigator. We used the Newcastle-Ottawa Scale (NOS) to
shown acute reductions in plasma/serum concentrations of total                       assess study quality, with a score ≥6 indicating high quality (8).
cholesterol, LDL-cholesterol, and HDL-cholesterol in patients
with COVID-19. Notably, the magnitude of this reduction seems                        Statistical Analysis
to be proportional to the severity of the disease and might                          Standardized mean differences (SMD) were used to build forest
therefore assist with early risk stratification and clinical decisions               plots of continuous data and to evaluate differences in total
(5, 6). By contrast, studies investigating the concentration                         cholesterol, LDL-cholesterol, HDL-cholesterol, and triglyceride
of triglycerides in COVID-19 patients with different severity                        concentrations between COVID-19 patients with low vs. high
have reported variable results (6, 7). In order to capture                           severity or survivor vs. non-survivor status. When necessary,
and interpret the available evidence regarding the relationship                      the mean and standard deviation values were extrapolated from
between COVID-19 and lipid profile, we conducted a systematic                        the median and IQR values, as previously reported (9). The Q-
review and meta-analysis of studies reporting plasma/serum                           statistic was used to assess the heterogeneity of the SMD across
concentrations of total cholesterol, LDL-cholesterol, HDL-                           studies (the significance level was set at p < 0.10). Inconsistency
cholesterol and triglycerides in hospitalized COVID-19 patients                      across studies was evaluated using the I 2 statistic where I 2  75% extreme heterogeneity) (10, 11). A random-effects model
follow-up had lower plasma/serum concentrations of total                             was used, in presence of significant heterogeneity, to calculate
cholesterol, LDL-cholesterol, and HDL-cholesterol, but not                           the pooled SMD and the corresponding 95% confidence intervals
triglyceride, concentrations, when compared to patients with                         (CIs). We also conducted sensitivity analyses to evaluate the
mild disease or favorable outcomes. A meta-regression analysis                       influence of each individual study on the overall effect size with
was also conducted to identify associations between the between-                     the leave-one-out method (12). The presence of publication bias
group total cholesterol, LDL-cholesterol, HDL-cholesterol, and                       was assessed by means of the Begg’s adjusted rank correlation
triglyceride effect size and pre-defined biologically and clinically                 t-test and the Egger’s regression asymmetry t-test at the p
plausible variables.                                                                 < 0.05 level of significance (13, 14). We also performed the

Frontiers in Public Health | www.frontiersin.org                                 2                                          August 2021 | Volume 9 | Article 705916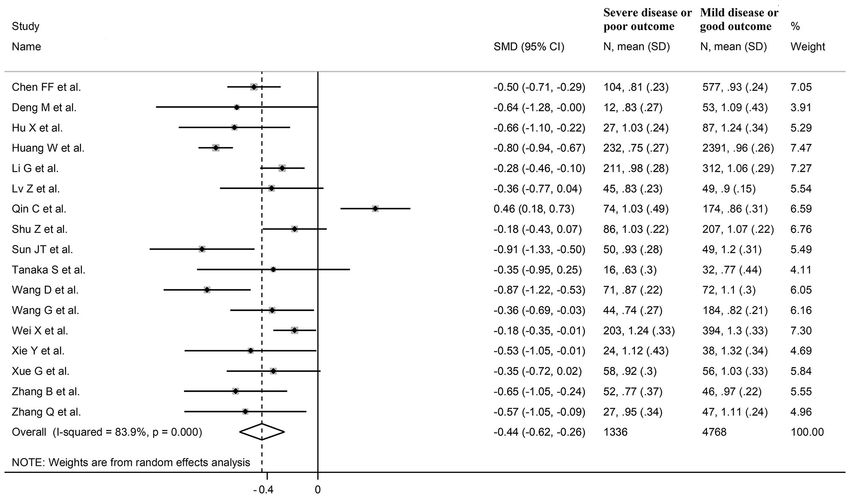
Zinellu et al.                                                                                                              Lipids and COVID-19

  FIGURE 1 | Flow chart of study selection.

Duval and Tweedie “trim and fill” procedure to further test and         the remaining 16 were retrospective (6, 7, 17, 18, 20, 21, 23–
correct the possible effect of publication bias (15). This method       26, 28, 32–36). Endpoints included disease severity based on
recalculates a pooled SMD by extrapolating and incorporating            current clinical guidelines in 13 studies (6, 7, 17, 21, 23, 25, 26,
the hypothetical missing studies, to increase the observed data         28, 29, 32–34, 36), ICU admission in two (24, 35), and survival
so that the funnel plot is more symmetric. To explore possible          status in three (18, 20, 30). The overall standardized mean
contributors to the between-study variance, we investigated             difference in total cholesterol concentrations between COVID-
in meta-regression analysis the associations between the SMD            19 patients with low vs. high severity or survivor vs. non-
and the following parameters: age, gender, specific endpoints           survivor status is shown in Figure 2. In 15 studies, patients with
(severity, ICU admission, or surviving status), study design            high severity or non-survivor status had lower total cholesterol
(retrospective or prospective), white blood cell count (WBC),           concentrations when compared to those with low severity or
C-reactive protein (CRP), aspartate aminotransferase (AST),             survivor status (mean difference range, −0.71 to −0.03) (6, 7,
alanine aminotransferase (ALT), albumin, D-dimer, creatinine,           17, 18, 20, 24, 26, 28–30, 32–36), although the difference was
diabetes, hypertension, and cardiovascular disease. Statistical         not statistically significant in seven studies (7, 17, 24, 30, 32–
analyses were performed using Stata 14 (STATA Corp., College            34). By contrast, in the remaining three studies (21, 23, 25),
Station, TX, USA). Our study was fully compliant with the               total cholesterol concentrations were lower in patients with
PRISMA statement regarding the reporting of systematic reviews          low severity or survivor status (mean difference range, 0.02 to
and meta-analyses (16).                                                 0.30), even if the difference was not statistically significant. The
                                                                        pooled results showed that total cholesterol concentrations were
                                                                        significantly lower in patients with high severity or non-survivor
RESULTS
                                                                        status (SMD −0.29, 95% CI −0.41 to −0.16, p < 0.001), with
Systematic Research                                                     large heterogeneity between studies (I 2 = 66.4%, p < 0.001). In
A flow chart describing the screening process is presented in           sensitivity analysis, the corresponding pooled SMD values were
Figure 1. We initially identified 2,121 studies. A total of 2,096       not altered when each study was in turn omitted (effect size
studies were excluded after the first screening because they were       ranged between −0.31 and −0.26, Figure 3A). In addition, the
either duplicates or irrelevant. After a full-text review of the        SMD remained significant (−0.30, 95% CI −0.43 to −0.16, p
remaining 25 articles, three were further excluded because they         < 0.001) with a similar between-study variance (I 2 = 62.7%, p
either did not provide the required information or did not meet         < 0.001), after removing the two studies that accounted for a
the inclusion criteria. Thus, 22 studies were included in the           third of the total participants (17, 18). The Begg’s (p = 0.83)
meta-analysis (6, 7, 17–36).                                            and Egger’s (p = 0.66) t-tests showed no evidence of publication
                                                                        bias. Accordingly, the trim-and-fill analysis did not add any study
Total Cholesterol                                                       to the funnel plot (Figure 3B). In meta-regression analysis, age
Eighteen studies assessed total cholesterol concentrations in           (t = −0.74, p = 0.47), gender (t = −0.21, p = 0.25), endpoint
4,562 COVID-19 patients, 3,179 (46% males, mean age 56 years)           (t = −0.92, p = 0.37), study design (t = −0.78, p = 0.45), AST
with low severity or survivor status and 1,383 (59% males, mean         (t = −1.00, p = 0.34), ALT (t = −1.40, p = 0.19), D-dimer
age 64 years) with high severity or non-survivor status during          (t = −2.00, p = 0.10), diabetes (t = 0.43, p = 0.68), hypertension
follow up (Table 1) (6, 7, 17, 18, 20, 21, 23–26, 28–30, 32–36).        (t = −1.44, p = 0.17) and cardiovascular disease (t = 0.54,
All studies were conducted in China, except one, performed              p = 0.60) were not associated with the SMD. A trend toward
in France (30). Two studies were prospective (29, 30), whilst           significance was observed with WBC (t = −2.01, p = 0.07), CRP

Frontiers in Public Health | www.frontiersin.org                    3                                     August 2021 | Volume 9 | Article 705916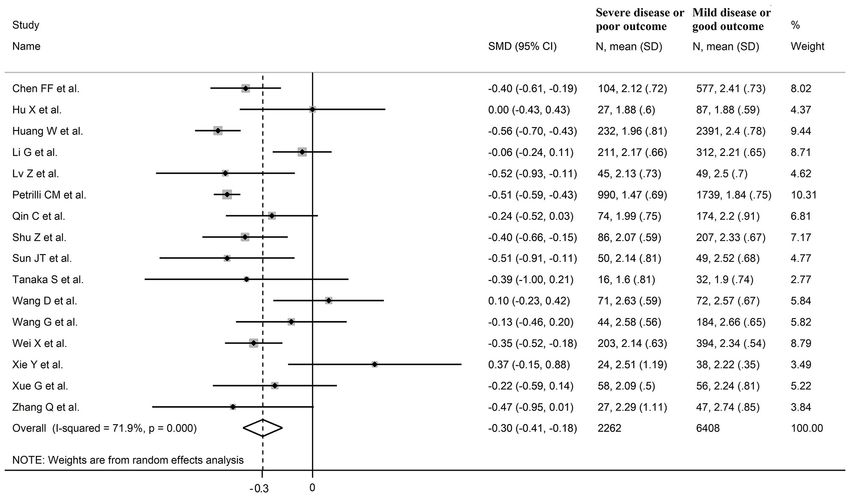
Frontiers in Public Health | www.frontiersin.org
Zinellu et al.
TABLE 1 | Characteristics of the studies in COVID-19 patients, according to disease severity or survival status, included in the meta-analysis.
Mild disease or survivor Severe disease or non-survivor
First author, NOS n Age Gender TC (mmol/L) LDL HDL TG n Age Gender TC LDL HDL TG
country (ref) (stars) (years) (M/F) Mean ± SD (mmol/L) (mmol/L) (mmol/L) (years) (M/F) (mmol/L) (mmol/L) (mmol/L) (mmol/L)
Mean Mean ± SD Mean ± SD Mean ± SD Mean Mean ± SD Mean ± SD Mean ± SD Mean ± SD
Chen et al., China 7 657 62 271/386 3.96 ± 0.84 NR NR 1.18 ± 0.62 173 65 107/66 3.93 ± 0.97 NR NR 1.12 ± 0.68
(17)
Chen et al., China 7 577 63 297/280 3.86 ± 0.81 2.41 ± 0.73 0.93 ± 0.24 1.27 ± 0.51 104 73 65/39 3.51 ± 0.76 2.12 ± 0.72 0.81 ± 0.23 1.38 ± 0.50
(18)
Deng et al., China 7 53 35 24/29 NR NR 1.09 ± 0.43 1.07 ± 0.33 12 33 12/0 NR NR 0.83 ± 0.27 1.39 ± 0.73
(19)
Gao et al., China 5 175 70 79/96 4.03 ± 0.81 NR NR 1.23 ± 0.52 35 74 22/13 3.47 ± 1.04 NR NR 1.37 ± 0.34
(20)
Hu et al., China 6 87 46 42/45 3.74 ± 0.65 1.88 ± 0.59 1.24 ± 0.34 1.27 ± 0.60 27 62 18/9 3.95 ± 0.84 1.88 ± 0.60 1.03 ± 0.24 1.34 ± 0.42
(21)
Huang et al., China 5 2,391 62 1,165/1,226 NR 2.40 ± 0.78 0.96 ± 0.26 1.33 ± 0.59 232 70 161/71 NR 1.96 ± 0.81 0.75 ± 0.27 1.65 ± 0.76
(22)
Lei et al., China 5 50 65 22/28 3.90 ± 0.65 NR NR 1.27 ± 0.47 65 69 36/29 3.93 ± 0.71 NR NR 1.19 ± 0.50
(23)
Li et al., China (24) 7 312 49 131/181 3.97 ± 0.85 2.21 ± 0.65 1.06 ± 0.29 1.50 ± 0.89 211 62 119/92 3.83 ± 0.84 2.17 ± 0.66 0.98 ± 0.28 1.53 ± 0.71
Li et al., China (25) 6 45 50 24/21 3.60 ± 0.86 NR NR 1.09 ± 0.58 89 64 51/38 3.62 ± 0.99 NR NR 1.20 ± 0.60
Lv et al., China (26) 6 49 63 24/25 3.85 ± 0.76 2.50 ± 0.70 0.90 ± 0.15 1.25 ± 0.44 45 62 24/21 3.54 ± 0.64 2.13 ± 0.73 0.83 ± 0.23 1.37 ± 0.76
4
Petrilli et al., USA 7 1,739 60 1,016/723 NR 1.84 ± 0.75 NR NR 990 68 656/334 NR 1.47 ± 0.69 NR NR
(27)
Qin et al., China (7) 7 174 51 91/83 4.04 ± 1.14 2.20 ± 0.91 0.86 ± 0.31 1.10 ± 0.54 74 65 39/35 3.9 ± 1.12 1.99 ± 0.75 1.03 ± 0.49 1.22 ± 0.59
Shu et al., China 6 207 54 79/128 4.43 ± 0.81 2.33 ± 0.67 1.07 ± 0.22 1.60 ± 0.74 86 65 56/30 3.87 ± 0.74 2.07 ± 0.52 1.03 ± 0.22 1.43 ± 0.51
(28)
Sun et al., China 7 49 52 26/23 4.35 ± 0.94 2.52 ± 0.68 1.20 ± 0.31 1.27 ± 0.73 50 71 34/16 3.63 ± 1.17 2.14 ± 0.81 0.93 ± 0.28 1.09 ± 0.68
(29)
Tanaka et al., 6 32 55 21/11 3.27 ± 1.11 1.90 ± 0.74 0.77 ± 0.44 2.13 ± 1.04 16 59 10/6 3.10 ± 1.41 1.60 ± 0.81 0.63 ± 0.30 2.23 ± 0.96
France (30)
Wang et al., China 5 72 44 29/43 NR 2.57 ± 0.67 1.10 ± 0.30 NR 71 65 44/27 NR 2.63 ± 0.59 0.87 ± 0.22 NR
(31)
Wang et al., China 7 184 NR NR 3.80 ± 0.81 2.66 ± 0.65 0.82 ± 0.21 1.12 ± 0.50 44 NR NR 3.61 ± 0.82 2.58 ± 0.56 0.74 ± 0.27 1.07 ± 0.44
(32)
August 2021 | Volume 9 | Article 705916
Wei et al., China (6) 5 394 64 189/205 4.52 ± 1.06 2.34 ± 0.54 1.30 ± 0.33 1.83 ± 0.74 203 69 116/87 4.17 ± 1.16 2.14 ± 0.63 1.24 ± 0.33 1.56 ± 0.82
Xie et al., China 6 38 61 14/24 4.26 ± 0.83 2.22 ± 0.35 1.32 ± 0.34 1.33 ± 0.76 24 72 13/11 4.24 ± 1.24 2.51 ± 1.19 1.12 ± 0.43 1.34 ± 0.59
(33)
Xue et al., China 7 56 61 30/26 3.97 ± 1.28 2.24 ± 0.81 1.03 ± 0.33 1.48 ± 0.56 58 64 34/24 3.61 ± 0.66 2.09 ± 0.50 0.92 ± 0.30 1.31 ± 0.52
(34)
Zhang et al., China 7 46 61 24/22 3.83 ± 0.67 NR 0.97 ± 0.22 1.37 ± 0.59 52 66 34/18 3.30 ± 0.89 NR 0.77 ± 0.37 1.60 ± 0.81
Lipids and COVID-19
(35)
Zhang et al., China 6 47 61 18/29 4.57 ± 1.51 2.74 ± 0.85 1.11 ± 0.24 1.58 ± 1.02 27 72 18/9 3.85 ± 1.21 2.29 ± 1.11 0.95 ± 0.34 1.28 ± 0.65
(36)
HDL, high-density lipoprotein; LDL, low-density lipoprotein; M/F, males/females; NOS, Newcastle-Ottawa quality assessment scale for case-control studies; NR, not reported; SD, standard deviation; TC, total cholesterol; TG, triglycerides.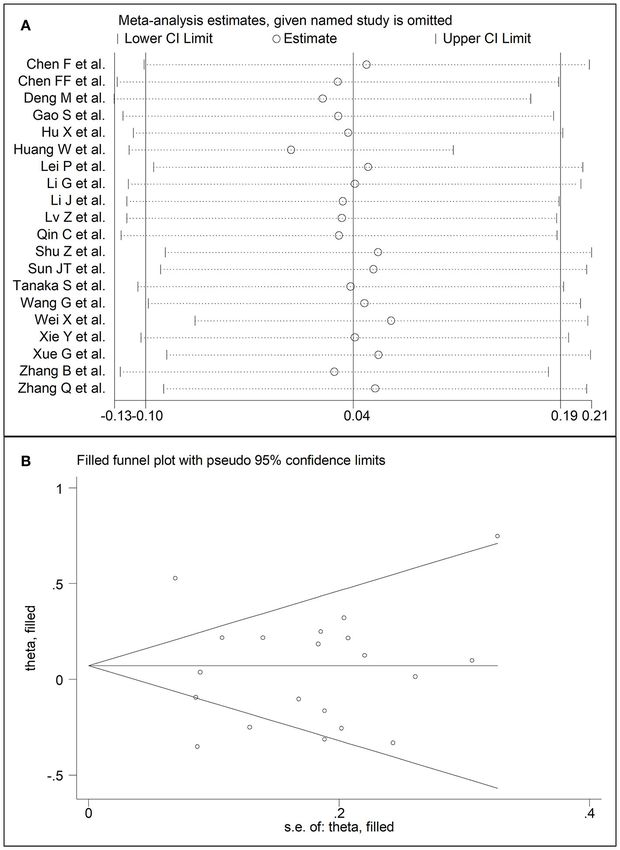
Zinellu et al.                                                                                                                            Lipids and COVID-19

  FIGURE 2 | Forest plot of studies examining total cholesterol concentrations in COVID-19.

(t = −1.94, p = 0.07), albumin (t = −2.31, p = 0.05), and                             no difference was observed between the groups (mean difference
creatinine (t = −1.94, p = 0.07).                                                     0.00) (21). The pooled results showed that LDL-concentrations
                                                                                      were significantly lower in patients with high severity or non-
LDL-Cholesterol                                                                       survivor status (SMD −0.30, 95% CI −0.41 to −0.18, p < 0.001),
Sixteen studies investigated LDL-cholesterol concentrations in                        with large heterogeneity between studies (I 2 = 71.9%, p < 0.001).
8,670 COVID-19 patients, 6,408 (51% males, mean age 60 years)                         In sensitivity analysis, the pooled SMD values were not altered
with low severity or survivor status and 2,262 (63% males,                            when individual studies were in turn omitted (effect size ranged
mean age 68 years) with high severity or non-survivor status                          between −0.33 and −0.27, Figure 5A). In addition, the SMD was
during follow up (Table 1) (6, 7, 18, 21, 22, 24, 26–34, 36).                         reduced but still significant (−0.24, 95% CI −0.35 to −0.13, p <
Fourteen studies were conducted in China (6, 7, 18, 21, 22, 24,                       0.001), with a reduction in between-study variance (I 2 = 47.9%,
26, 28, 29, 31–34, 36), one in USA (27), and one in France                            p = 0.02), after removing the two studies that accounted for 62%
(30). Three studies were prospective (27, 29, 30), whilst the                         of all participants (22, 27). The Egger’s (p = 0.02), but not the
remaining 13 were retrospective (6, 7, 18, 21, 22, 24, 26, 28, 31–                    Begg’s (p = 0.44), t-test showed the presence of publication bias.
34, 36). Endpoints included disease severity based on current                         Accordingly, the trim-and-fill method identified seven potential
clinical guidelines in 12 (6, 7, 21, 26–29, 31–34, 36), ICU                           missing studies to add on the left side of the funnel plot to ensure
admission in one (24), and survival status in three (18, 22, 30).                     symmetry (Figure 5B). The adjusted SMD was further increased
The overall standardized mean difference in LDL-cholesterol                           (−0.47, 95% CI −0.35 to −0.60, p < 0.001). In meta-regression
concentrations between COVID-19 patients with low vs. high                            analysis, age (t = 2.37, p = 0.03) and hypertension (t = 2.92,
severity or survivor vs. non-survivor status is shown in Figure 4.                    p = 0.02) were significantly and positively associated with the
In 13 studies, patients with high severity or non-survivor status                     SMD. By contrast, non-significant relationships were observed
had lower LDL-cholesterol concentrations when compared to                             with gender (t = 0.26, p = 0.80), endpoint (t = 0.11, p = 0.92),
those with low severity or survivor status (mean difference range,                    study design (t = −1.58, p = 0.14), country (t = −1.24 p = 0.24),
−0.56 to −0.06) (6, 7, 18, 22, 24, 26–30, 32, 34, 36), although the                   AST (t = −0.09, p = 0.93), ALT (t = 0.23, p = 0.82), D-dimer
difference was not statistically significant in six studies (7, 24, 30,               (t = −0.67, p = 0.55), WBC (t = −0.92, p = 0.38), CRP
32, 34, 36). In three studies (21, 23, 25), LDL-concentrations were                   (t = −0.54, p = 0.60), albumin (t = 0.01, p = 0.99), creatinine
non-significantly lower in patients with low severity or survivor                     (t = −0.54, p = 0.60), diabetes (t = 1.64, p = 0.14), and
status (mean difference range 0.10 to 0.37), whereas in one study                     cardiovascular disease (t = 0.67, p = 0.53).

Frontiers in Public Health | www.frontiersin.org                                  5                                     August 2021 | Volume 9 | Article 705916
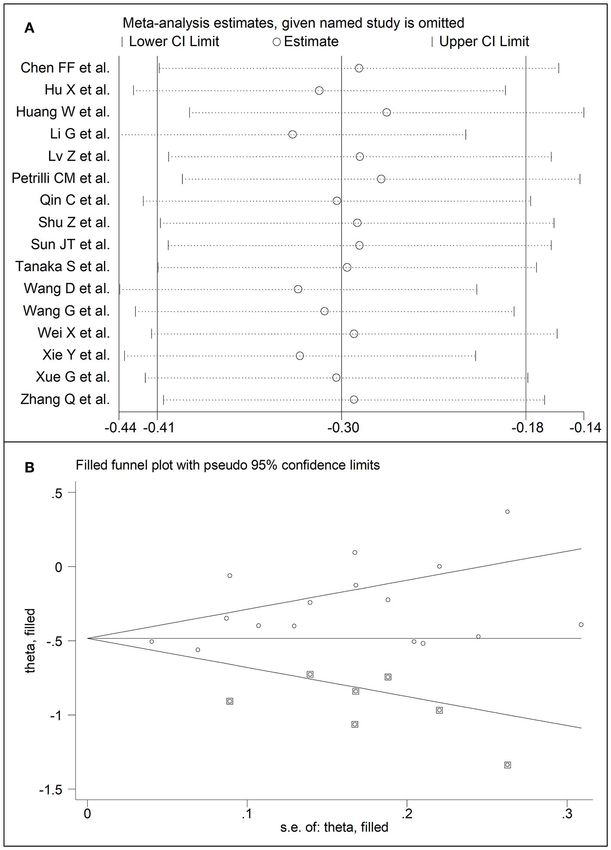
Zinellu et al.                                                                                                                                        Lipids and COVID-19

  FIGURE 3 | (A) Sensitivity analysis of the association between total cholesterol and COVID-19. The influence of individual studies on the overall standardized mean
  difference (SMD) is shown. The middle vertical axis indicates the overall SMD and the two vertical axes indicate the 95% confidence intervals (CIs). The hollow circles
  represent the pooled SMD when the remaining study is omitted from the meta-analysis. The two ends of each broken line represent the 95% CIs. (B) Funnel plot of
  studies investigating low vs. high severity or surviving vs. non-surviving status after trimming and filling. Dummy studies and genuine studies are represented by
  enclosed circles and free circles, respectively.

HDL-Cholesterol                                                                          15 were retrospective (6, 7, 18, 19, 21, 22, 24, 26, 28, 31–36).
Seventeen studies assessed HDL-cholesterol concentrations in                             Endpoints included disease severity based on current clinical
6,104 COVID-19 patients, 4,768 (48% males, mean age 60 years)                            guidelines in 12 (6, 7, 19, 21, 26, 28, 29, 31–34, 36), ICU
with low severity or survivor status and 1,336 (62% males, mean                          admission in two (24, 35), and survival status in three (18, 22, 30).
age 67 years) with high severity or non-survivor status during                           The overall SMD in HDL-cholesterol concentrations between
follow up (Table 1) (6, 7, 18, 19, 21, 22, 24, 26, 28–36). All studies                   COVID-19 patients with low vs. high severity or survivor
were performed in China, except one, conducted in France (30).                           vs. non-survivor status is reported in Figure 6. In 16 studies,
Two studies were prospective (29, 30), whilst the remaining                              patients with high severity or non-survivor status had lower

Frontiers in Public Health | www.frontiersin.org                                     6                                            August 2021 | Volume 9 | Article 705916

Zinellu et al.                                                                                                                            Lipids and COVID-19

  FIGURE 4 | Forest plot of studies examining LDL-cholesterol concentrations in COVID-19.

HDL-cholesterol concentrations than those with low severity or                      significance was observed with CRP (t = −2.03, p = 0.07) and
survivor status during follow up (mean difference range, −0.91 to                   creatinine (t = −2.03, p = 0.07).
−0.18) (6, 18, 19, 21, 22, 24, 26, 28–36), although the difference
was not statistically significant in four (26, 28, 30, 34). In the                  Triglycerides
remaining study, HDL-concentrations were significantly lower                        Twenty studies reported triglyceride concentrations in 7,250
in patients with low severity or survivor status during follow                      COVID-19 patients, 5,623 (47% males, mean age 60 years) with
up (mean difference 0.46) (7). The pooled results showed that                       low severity or survivor status and 1,627 (61% males, mean age 67
HDL-concentrations were significantly lower in patients with                        years) with high severity or non-survivor status during follow up
high severity or non-survivor status (SMD −0.44, 95% CI −0.62                       (Table 1) (6, 7, 17–26, 28–30, 32–36). All studies were performed
to −0.26, p < 0.001), with extreme heterogeneity between studies                    in China, except one, conducted in France (30). Two studies
(I 2 = 83.9%, p < 0.001). Sensitivity analysis showed that the                      were prospective (29, 30), whilst 18 were retrospective (6, 7, 17–
pooled SMD values were not affected when each study was                             26, 28, 32–36). Endpoints included disease severity based on
in turn omitted (effect size ranged between −0.50 and −0.41,                        current clinical guidelines in 14 studies (6, 7, 17, 19, 21, 23, 25, 26,
Figure 7A). In addition, the SMD was reduced though remained                        28, 29, 32–34, 36), ICU admission in two (24, 35), and survival
significant (−0.40, 95% CI −0.58 to −0.22, p
Zinellu et al.                                                                                                                                        Lipids and COVID-19

  FIGURE 5 | (A) Sensitivity analysis of the association between LDL-cholesterol and COVID-19. The influence of individual studies on the overall standardized mean
  difference (SMD) is shown. The middle vertical axis indicates the overall SMD and the two vertical axes indicate the 95% confidence intervals (CIs). The hollow circles
  represent the pooled SMD when the remaining study is omitted from the meta-analysis. The two ends of each broken line represent the 95% CIs. (B) Funnel plot of
  studies investigating low vs. high severity or surviving vs. non-surviving status after trimming and filling. Dummy studies and genuine studies are represented by
  enclosed circles and free circles, respectively.

−0.19, p = 0.57), with extreme heterogeneity between studies                             (p = 0.67) and Egger’s (p = 0.58) t-tests showed no evidence of
(I 2 = 81.0%, p < 0.001). Sensitivity analysis showed that the                           publication bias. Accordingly, the trim-and-fill method did not
pooled SMD values were not altered when each study was in turn                           add any study to the funnel plot (Figure 9B). Meta-regression
removed (effect size ranged between 0.00 and 0.07, Figure 9A).                           analysis showed that endpoint (t = 3.29, p = 0.004) and AST (t
In addition, the SMD remained non-significant (0.10, 95% CI                              =2.65, p = 0.02) were significantly associated to the effect size,
−0.12 to 0.14, p = 0.88), but with a reduction in between-study                          with a trend toward significance for albumin (t = 2.08, p = 0.07).
variance (I 2 = 62.8%, p < 0.001), after removing two studies                            By contrast, age (t = −0.50, p = 0.62), gender (t = 0.44, p = 0.66),
that accounted for 48% of all participants (17, 22). The Begg’s                          study design (t = −0.68, p = 0.51), ALT (t = 0.94, p = 0.36),

Frontiers in Public Health | www.frontiersin.org                                     8                                            August 2021 | Volume 9 | Article 705916
Zinellu et al.                                                                                                                         Lipids and COVID-19

  FIGURE 6 | Forest plot of studies examining HDL-cholesterol concentrations in COVID-19.

D-dimer (t = −0.44, p = 0.65), WBC (t = 1.72, p = 0.11), CRP                        on the left side of the funnel plot to ensure symmetry. In meta-
(t = −0.15, p = 0.88), creatinine (t = −0.15, p = 0.88), diabetes                   regression analysis, performed to identify specific study, clinical
(t = 0.38, p = 0.71), cardiovascular disease (t = −1.06, p = 0.32)                  and demographic factors potentially associated with the SMD,
and hypertension (t = −0.36, p = 0.73) were not significantly                       only age and hypertension were significantly associated with the
associated with the SMD.                                                            SMD for LDL whereas the type of study endpoint and AST values
                                                                                    were significantly associated with the SMD for triglycerides.
DISCUSSION                                                                              The exact mechanisms responsible for the lower
                                                                                    plasma/serum concentrations of total cholesterol, LDL-
In our systematic review and meta-analysis, the serum/plasma                        cholesterol, and HDL-cholesterol in patients with COVID-19,
concentrations of total cholesterol, LDL-cholesterol, and HDL-                      particularly in those with the more severe forms of the disease,
cholesterol were significantly lower in COVID-19 patients with                      are unclear. A reduction in cholesterol fractions has been
more severe disease, ascertained clinically or with documented                      previously reported with other viral agents, particularly the
transfer to ICU, and in those who did not survive during follow                     Human Immunodeficiency Virus-1 (HIV-1). In patients with
up when compared to patients with milder forms of the disease                       HIV-1 infection, a significant reduction in plasma/serum
or who survived during follow up. By contrast, no significant                       concentrations of HDL-cholesterol has been linked with the
associations were observed between triglyceride concentrations,                     impaired function of the ATP-binding cassette transporter
COVID-19 severity, and mortality. The observed SMD values for                       A1-dependent cholesterol efflux in macrophages and the
total cholesterol, LDL-cholesterol, and HDL-cholesterol, −0.29,                     activation of endothelial lipase and phospholipase A2, mediated
−0.30, and −0.44, respectively, indicate an effect size that is                     by a pro-inflammatory state (38–40). While alterations in
likely to be of biological and/or clinical relevance (37). The                      these transporters and enzymes have not been specifically
heterogeneity between studies was generally large-to-extreme                        reported in patients with COVID-19, other mechanisms may
however in sensitivity analysis the effect size of different lipid                  be involved in this group. For example, it has been speculated
fractions was not significantly affected when each study was in                     that the increased utilization of cholesterol for the synthesis
turn removed. Further analyses based on the Begg’s and Egger’s                      of pulmonary surfactant, as a response to viral infection and
t-tests did not show evidence of significant publication bias,                      replication in the lungs, and/or a poor nutritional status
except for LDL-cholesterol. With this lipid fraction, the trim-                     associated with reduced liver synthetic capacity, might account,
and-fill method identified seven potential missing studies to add                   at least in part, for the observed hypocholesterolemia in severe

Frontiers in Public Health | www.frontiersin.org                                9                                    August 2021 | Volume 9 | Article 705916
Zinellu et al. Lipids and COVID-19 FIGURE 7 | (A) Sensitivity analysis of the association between HDL-cholesterol and COVID-19. The influence of individual studies on the overall standardized mean difference (SMD) is shown. The middle vertical axis indicates the overall SMD and the two vertical axes indicate the 95% confidence intervals (CIs). The hollow circles represent the pooled SMD when the remaining study is omitted from the meta-analysis. The two ends of each broken line represent the 95% CIs. (B) Funnel plot of studies investigating low vs. high severity or surviving vs. non-surviving status after trimming and filling. Dummy studies and genuine studies are represented by enclosed circles and free circles, respectively. COVID-19 (7). The latter hypothesis is supported by the results of specific pro-inflammatory cytokines and/or the increased of a recent systematic review and meta-analysis which reported expression of the scavenger receptor class B type 1 (6, 42). While that lower concentrations of serum prealbumin, a combined previous studies have reported an inverse association between marker of malnutrition and inflammation, are also significantly CRP and HDL-cholesterol concentrations in COVID-19, the associated with higher COVID-19 severity and adverse clinical results of our meta-regression analysis showed a non-significant outcomes (41). It is also possible that the non-specific presence trend for an association between the SMD for HDL-cholesterol of sepsis, similar to other bacterial and viral infections, can lead and CRP (t = −2.03, p = 0.07). Further experimental and human to the observed alterations in lipid profile through the activation studies are required to clarify whether the association between Frontiers in Public Health | www.frontiersin.org 10 August 2021 | Volume 9 | Article 705916
Zinellu et al.                                                                                                                             Lipids and COVID-19

  FIGURE 8 | Forest plot of studies examining the concentrations of triglycerides in COVID-19.

an excessive inflammatory state and HDL-cholesterol, and other                             The large-to-extreme between-study heterogeneity represents
lipid fractions, in patients with severe COVID-19 is mediated                          a potential limitation in our study. However, there was no
by non-specific inflammatory markers or individual cytokines.                          evidence of publication bias, barring studies reporting LDL-
The significant differences observed in total-cholesterol, HDL-                        cholesterol concentrations, and the overall effect size was not
cholesterol, and LDL-cholesterol concentrations between                                significantly influenced in sensitivity analyses. The lack of
COVID-19 patients with different severity and clinical outcomes                        significant associations between study, clinical, and demographic
could also be theoretically amplified, at least in part, by the                        characteristics and the SMD, barring the associations between age
different pre-admission and/or hospital use of cholesterol                             and hypertension and the SMD for LDL and between the type of
lowering agents, particularly statins, in these subgroups.                             study design and AST and the SMD for triglycerides previously
However, a systematic review and meta-analysis of European                             described, suggest that other unreported factors, for example,
and North American studies in 2,398 patients with COVID-19                             statin use and/or issues with standardization of the analytical
has recently reported that the use of statins was associated with                      methods for the measurement of different lipid fractions (45),
a significantly reduced risk of disease progression or mortality                       might contribute to the observed heterogeneity. An additional
(odds ratio, OR, 0.59, 95% CI 0.35 to 0.99, p = 0.02). This trend                      limitation in our study was the lack of information provided in
persisted after excluding studies where statins were commenced                         most studies regarding the exact timing of the blood collection for
during hospital admission (OR 0.51, 95% CI 0.41 to 0.64, p-value                       lipid profile, for example, on the day of admission or thereafter.
not reported) (43). Pending confirmation in other ethnic groups,                           In conclusion, our systematic review and meta-analysis
for example, Chinese patients, these results suggest the presence                      has shown that lower plasma/serum concentrations of total
of a complex interplay between lipid profile on admission,                             cholesterol, LDL-cholesterol, and HDL-cholesterol, but not
pre-hospital and in-hospital statin use, disease severity and                          triglycerides, are significantly associated with more severe disease
mortality in COVID-19. The limited information available on                            and increased mortality in patients with COVID-19. While
the use of statins in the studies identified in our systematic review                  the assessment of lipid profile, with or without other patient
prevented the conduct of meta-regression analysis to investigate                       characteristics, might assist with risk stratification, additional
associations between statin use and the SMD of various lipid                           prospective studies are required to investigate the relationship
fractions. This important issue requires further research as the                       between various cholesterol fractions and statin use, the temporal
results of in vitro experiments support the presence of anti-viral                     variations in lipid concentrations, and the clinical impact of these
effects of statins against SARS-CoV-2 (44).                                            variables in this patient group.

Frontiers in Public Health | www.frontiersin.org                                  11                                     August 2021 | Volume 9 | Article 705916
Zinellu et al.                                                                                                                                       Lipids and COVID-19

  FIGURE 9 | (A) Sensitivity analysis of the association between serum triglycerides and COVID-19. The influence of individual studies on the overall standardized mean
  difference (SMD) is shown. The middle vertical axis indicates the overall SMD and the two vertical axes indicate the 95% confidence intervals (CIs). The hollow circles
  represent the pooled SMD when the remaining study is omitted from the meta-analysis. Two ends of each broken line represent the 95% CIs. (B) Funnel plot of
  studies investigating low vs. high severity or surviving vs. non-surviving status after trimming and filling. Dummy studies and genuine studies are represented by
  enclosed circles and free circles, respectively.

DATA AVAILABILITY STATEMENT                                                              and writing—review and editing. AM: writing—first draft.
                                                                                         All authors contributed to the article and approved the
The raw data supporting the conclusions of this article will be                          submitted version.
made available by the authors, without undue reservation.

                                                                                         SUPPLEMENTARY MATERIAL
AUTHOR CONTRIBUTIONS
                                                                                         The Supplementary Material for this article can be found
AZ and AM: initial idea. AZ, PP, and PS: data collection and                             online at: https://www.frontiersin.org/articles/10.3389/fpubh.
analysis. AZ, PP, AF, PS, CC, and AM: data interpretation                                2021.705916/full#supplementary-material

Frontiers in Public Health | www.frontiersin.org                                    12                                           August 2021 | Volume 9 | Article 705916
Zinellu et al. Lipids and COVID-19
REFERENCES clinical retrospective study in Wuhan, China. Aging. (2020) 12:12504–
16. doi: 10.18632/aging.103631
1. Huang C, Soleimani J, Herasevich S, Pinevich Y, Pennington KM, Dong 21. Hu X, Chen D, Wu L, He G, Ye W. Declined serum high density lipoprotein
Y, et al. Clinical characteristics, treatment, and outcomes of critically ill cholesterol is associated with the severity of COVID-19 infection. Clin Chim
patients with COVID-19: a scoping review. Mayo Clin Proc. (2021) 96:183– Acta. (2020) 510:105–10. doi: 10.1016/j.cca.2020.07.015
202. doi: 10.1016/j.mayocp.2020.10.022 22. Huang W, Li C, Wang Z, Wang H, Zhou N, Jiang J, et al. Decreased serum
2. Wynants L, Van Calster B, Collins GS, Riley RD, Heinze G, Schuit albumin level indicates poor prognosis of COVID-19 patients: hepatic injury
E, et al. Prediction models for diagnosis and prognosis of covid- analysis from 2,623 hospitalized cases. Sci China Life Sci. (2020) 63:1678–
19 infection: systematic review and critical appraisal. BMJ. (2020) 87. doi: 10.1007/s11427-020-1733-4
369:m1328. doi: 10.1101/2020.03.24.20041020 23. Lei P, Zhang L, Han P, Zheng C, Tong Q, Shang H, et al. Liver
3. Priesemann V, Balling R, Brinkmann MM, Ciesek S, Czypionka T, Eckerle injury in patients with COVID-19: clinical profiles, CT findings, the
I, et al. An action plan for pan-European defence against new SARS-CoV-2 correlation of the severity with liver injury. Hepatol Int. (2020) 14:733–
variants. Lancet. (2021) 397:469–70. doi: 10.1016/S0140-6736(21)00150-1 42. doi: 10.1007/s12072-020-10087-1
4. Meher G, Bhattacharjya S, Chakraborty H. Membrane cholesterol modulates 24. Li G, Zhou CL, Ba YM, Wang YM, Song B, Cheng XB, et al.
oligomeric status and peptide-membrane interaction of severe acute Nutritional risk and therapy for severe and critical COVID-19 patients: a
respiratory syndrome coronavirus fusion peptide. J Phys Chem B. (2019) multicenter retrospective observational study. Clin Nutr. (2020) 40:2154–
123:10654–62. doi: 10.1021/acs.jpcb.9b08455 61. doi: 10.1016/j.clnu.2020.09.040
5. Kocar E, Rezen T, Rozman D. Cholesterol, lipoproteins, and COVID-19: basic 25. Li J, Li M, Zheng S, Li M, Zhang M, Sun M, et al. Plasma albumin levels predict
concepts and clinical applications. Biochim Biophys Acta Mol Cell Biol Lipids. risk for nonsurvivors in critically ill patients with COVID-19. Biomark Med.
(2021) 1866:158849. doi: 10.1016/j.bbalip.2020.158849 (2020) 14:827–37. doi: 10.2217/bmm-2020-0254
6. Wei X, Zeng W, Su J, Wan H, Yu X, Cao X, et al. Hypolipidemia is 26. Lv Z, Wang W, Qiao B, Cui X, Feng Y, Chen L, et al. The prognostic value of
associated with the severity of COVID-19. J Clin Lipidol. (2020) 14:297– general laboratory testing in patients with COVID-19. J Clin Lab Anal. (2020)
304. doi: 10.1016/j.jacl.2020.04.008 35:e23668. doi: 10.1002/jcla.23668
7. Qin C, Minghan H, Ziwen Z, Yukun L. Alteration of lipid profile and value of 27. Petrilli CM, Jones SA, Yang J, Rajagopalan H, O’Donnell L, Chernyak Y, et al.
lipids in the prediction of the length of hospital stay in COVID-19 pneumonia Factors associated with hospital admission and critical illness among 5279
patients. Food Sci Nutr. (2020) 8:6144–52. doi: 10.1002/fsn3.1907 people with coronavirus disease 2019 in New York City: prospective cohort
8. Wells GA, Shea B, O’Connell D, Peterson J, Welch V, Losos M, study. BMJ. (2020) 369:m1966. doi: 10.1136/bmj.m1966
et al. The Newcastle-Ottawa Scale (NOS) for assessing the quality of 28. Shu Z, Zhou Y, Chang K, Liu J, Min X, Zhang Q, et al. Clinical features and
nonrandomised studies in meta-analyses. The Ottawa Hospital Research the traditional Chinese medicine therapeutic characteristics of 293 COVID-19
Institute (2013). Available online at: http://www.ohri.ca/programs/clinical_ inpatient cases. Front Med. (2020) 14:760–75. doi: 10.1007/s11684-020-0803-8
epidemiology/oxford.asp (accessed August 03, 2021). 29. Sun JT, Chen Z, Nie P, Ge H, Shen L, Yang F, et al. Lipid profile features and
9. Wan X, Wang W, Liu J, Tong T. Estimating the sample mean and their associations with disease severity and mortality in patients with COVID-
standard deviation from the sample size, median, range and/or interquartile 19. Front Cardiovasc Med. (2020) 7:584987. doi: 10.3389/fcvm.2020.584987
range. BMC Med Res Methodol. (2014) 14:135. doi: 10.1186/1471-2288- 30. Tanaka S, De Tymowski C, Assadi M, Zappella N, Jean-Baptiste S, Robert
14-135 T, et al. Lipoprotein concentrations over time in the intensive care unit
10. Bowden J, Tierney JF, Copas AJ, Burdett S. Quantifying, displaying COVID-19 patients: results from the ApoCOVID study. PLoS ONE. (2020)
and accounting for heterogeneity in the meta-analysis of RCTs using 15:e0239573. doi: 10.1371/journal.pone.0239573
standard and generalised Q statistics. BMC Med Res Methodol. (2011) 31. Wang D, Li R, Wang J, Jiang Q, Gao C, Yang J, et al. Correlation analysis
11:41. doi: 10.1186/1471-2288-11-41 between disease severity and clinical and biochemical characteristics of 143
11. Higgins JP, Thompson SG. Quantifying heterogeneity in a meta-analysis. Stat cases of COVID-19 in Wuhan, China: a descriptive study. BMC Infect Dis.
Med. (2002) 21:1539–58. doi: 10.1002/sim.1186 (2020) 20:519. doi: 10.1186/s12879-020-05242-w
12. Tobias A. Assessing the influence of a single study in the meta-analysis 32. Wang G, Zhang Q, Zhao X, Dong H, Wu C, Wu F, et al. Low
estimate. Stata Technical Bull. (1999) 47:15–7. high-density lipoprotein level is correlated with the severity of
13. Begg CB, Mazumdar M. Operating characteristics of a rank correlation test for COVID-19 patients: an observational study. Lipids Health Dis. (2020)
publication bias. Biometrics. (1994) 50:1088–101. doi: 10.2307/2533446 19:204. doi: 10.1186/s12944-020-01382-9
14. Sterne JA, Egger M. Funnel plots for detecting bias in meta- 33. Xie Y, You Q, Wu C, Cao S, Qu G, Yan X, et al. Impact of
analysis: guidelines on choice of axis. J Clin Epidemiol. (2001) cardiovascular disease on clinical characteristics and outcomes of coronavirus
54:1046–55. doi: 10.1016/S0895-4356(01)00377-8 disease 2019 (COVID-19). Circ J. (2020) 84:1277–83. doi: 10.1253/circj.CJ-
15. Duval S, Tweedie R. Trim and fill: a simple funnel-plot-based method of 20-0348
testing and adjusting for publication bias in meta-analysis. Biometrics. (2000) 34. Xue G, Gan X, Wu Z, Xie D, Xiong Y, Hua L, et al. Novel
56:455–63. doi: 10.1111/j.0006-341X.2000.00455.x serological biomarkers for inflammation in predicting disease severity
16. Liberati A, Altman DG, Tetzlaff J, Mulrow C, Gotzsche PC, Ioannidis JP, et al. in patients with COVID-19. Int Immunopharmacol. (2020) 89(Pt
The PRISMA statement for reporting systematic reviews and meta-analyses A):107065. doi: 10.1016/j.intimp.2020.107065
of studies that evaluate healthcare interventions: explanation and elaboration. 35. Zhang B, Dong C, Li S, Song X, Wei W, Liu L. Triglyceride to
BMJ. (2009) 339:b2700. doi: 10.1136/bmj.b2700 high-density lipoprotein cholesterol ratio is an important determinant
17. Chen F, Chen W, Chen J, Xu D, Xie W, Wang X, et al. Clinical of cardiovascular risk and poor prognosis in coronavirus disease-19: a
features and risk factors of COVID-19-associated liver injury and retrospective case series study. Diabetes Metab Syndr Obes. (2020) 13:3925–
function: a retrospective analysis of 830 cases. Ann Hepatol. (2020) 36. doi: 10.2147/DMSO.S268992
21:100267. doi: 10.1016/j.aohep.2020.09.011 36. Zhang Q, Wei Y, Chen M, Wan Q, Chen X. Clinical analysis of risk factors
18. Chen FF, Zhong M, Liu Y, Zhang Y, Zhang K, Su DZ, et al. The characteristics for severe COVID-19 patients with type 2 diabetes. J Diabetes Complications.
and outcomes of 681 severe cases with COVID-19 in China. J Crit Care. (2020) (2020) 34:107666. doi: 10.1016/j.jdiacomp.2020.107666
60:32–7. doi: 10.1016/j.jcrc.2020.07.003 37. Cohen J. Statistical Power Analysis for the Behavioral Sciences. 2nd ed.
19. Deng M, Qi Y, Deng L, Wang H, Xu Y, Li Z, et al. Obesity as a potential Hillsdale, NJ: Erlbaum (1988).
predictor of disease severity in young covid-19 patients: a retrospective study. 38. Mujawar Z, Rose H, Morrow MP, Pushkarsky T, Dubrovsky L,
Obesity. (2020) 28:1815–25. doi: 10.1002/oby.22943 Mukhamedova N, et al. Human immunodeficiency virus impairs
20. Gao S, Jiang F, Jin W, Shi Y, Yang L, Xia Y, et al. Risk factors reverse cholesterol transport from macrophages. PLoS Biol. (2006)
influencing the prognosis of elderly patients infected with COVID-19: a 4:e365. doi: 10.1371/journal.pbio.0040365
Frontiers in Public Health | www.frontiersin.org 13 August 2021 | Volume 9 | Article 705916Zinellu et al. Lipids and COVID-19
39. Rader DJ. Molecular regulation of HDL metabolism and lipoproteins. Lab Med. (2008) 39:481–90. doi: 10.1309/6UL9RHJH1J
function: implications for novel therapies. J Clin Invest. (2006) FFU4PY
116:3090–100. doi: 10.1172/JCI30163
40. Oh J, Hegele RA. HIV-associated dyslipidaemia: pathogenesis and treatment. Conflict of Interest: The authors declare that the research was conducted in the
Lancet Infect Dis. (2007) 7:787–96. doi: 10.1016/S1473-3099(07)70287-6 absence of any commercial or financial relationships that could be construed as a
41. Zinellu A, Mangoni AA. Serum prealbumin concentrations, COVID-19 potential conflict of interest.
severity, and mortality: a systematic review and meta-analysis. Front Med.
(2021) 8:638529. doi: 10.3389/fmed.2021.638529
Publisher’s Note: All claims expressed in this article are solely those of the authors
42. Pirillo A, Catapano AL, Norata GD. HDL in infectious
diseases and sepsis. Handb Exp Pharmacol. (2015) 224:483– and do not necessarily represent those of their affiliated organizations, or those of
508. doi: 10.1007/978-3-319-09665-0_15 the publisher, the editors and the reviewers. Any product that may be evaluated in
43. Onorato D, Pucci M, Carpene G, Henry BM, Sanchis-Gomar F, Lippi G. this article, or claim that may be made by its manufacturer, is not guaranteed or
Protective effects of statins administration in european and north american endorsed by the publisher.
patients infected with COVID-19: a meta-analysis. Semin Thromb Hemost.
(2021) 47:392–9. doi: 10.1055/s-0040-1722307 Copyright © 2021 Zinellu, Paliogiannis, Fois, Solidoro, Carru and Mangoni. This
44. Reiner Z, Hatamipour M, Banach M, Pirro M, Al-Rasadi K, Jamialahmadi is an open-access article distributed under the terms of the Creative Commons
T, et al. Statins and the COVID-19 main protease: in silico evidence on Attribution License (CC BY). The use, distribution or reproduction in other forums
direct interaction. Arch Med Sci. (2020) 16:490–6. doi: 10.5114/aoms.2020. is permitted, provided the original author(s) and the copyright owner(s) are credited
94655 and that the original publication in this journal is cited, in accordance with accepted
45. Myers GL, Leary ET, Waymack PP, Kimberly MM, Warnick GR. academic practice. No use, distribution or reproduction is permitted which does not
Standardization of measurements forcholesterol, triglycerides, and major comply with these terms.
Frontiers in Public Health | www.frontiersin.org 14 August 2021 | Volume 9 | Article 705916You can also read