Center Smoothing: Provable Robustness for Functions with Metric-Space Outputs
←
→
Page content transcription
If your browser does not render page correctly, please read the page content below
Center Smoothing: Provable Robustness for
                                                    Functions with Metric-Space Outputs

                                                              Aounon Kumar                               Tom Goldstein
                                                           University of Maryland                     University of Maryland
                                                             aounon@umd.edu                            tomg@cs.umd.edu
arXiv:2102.09701v2 [cs.LG] 26 Jun 2021

                                                                                      Abstract

                                                  Randomized smoothing has been successfully applied to classification tasks on
                                                  high-dimensional inputs, such as images, to obtain models that are provably ro-
                                                  bust against adversarial perturbations of the input. We extend this technique to
                                                  produce provable robustness for functions that map inputs into an arbitrary met-
                                                  ric space rather than discrete classes. Such functions are used in many machine
                                                  learning problems like image reconstruction, dimensionality reduction, facial recog-
                                                  nition, etc. Our robustness certificates guarantee that the change in the output of
                                                  the smoothed model as measured by the distance metric remains small for any
                                                  norm-bounded perturbation of the input. We can certify robustness under a vari-
                                                  ety of different output metrics, such as total variation distance, Jaccard distance,
                                                  perceptual metrics, etc. In our experiments, we apply our procedure to create
                                                  certifiably robust models with disparate output spaces – from sets to images –
                                                  and show that it yields meaningful certificates without significantly degrading
                                                  the performance of the base model. The code for our experiments is available at:
                                                  https://github.com/aounon/center-smoothing.

                                         1   Introduction
                                         The study of adversarial robustness in machine learning has gained a lot of attention ever since deep
                                         neural networks (DNNs) have been demonstrated to be vulnerable to adversarial attacks. They are
                                         tiny perturbations of the input that can completely alter a model’s predictions [48, 38, 17, 27]. These
                                         maliciously chosen perturbations can significantly degrade the performance of a model, like an image
                                         classifier, and make it output almost any class that the attacker wants. However, these attacks are not
                                         just limited to classification problems. Recently, they have also been shown to exist for DNN-based
                                         models with many different kinds of outputs like images, probability distributions, sets, etc. For
                                         instance, facial recognition systems can be deceived to evade detection, impersonate authorized
                                         individuals and even render them completely ineffective [50, 47, 14]. Image reconstruction models
                                         have been targeted to introduce unwanted artefacts or miss important details, such as tumors in MRI
                                         scans, through adversarial inputs [1, 42, 6, 7]. Similarly, super-resolution systems can be made to
                                         generate distorted images that can in turn deteriorate the performance of subsequent tasks that rely on
                                         the high-resolution outputs [9, 54]. Deep neural network based policies in reinforcement learning
                                         problems also have been shown to succumb to imperceptible perturbations in the state observations
                                         [15, 22, 2, 40]. Such widespread presence of adversarial attacks is concerning as it threatens the use
                                         of deep neural networks in critical systems, such as facial recognition, self-driving vehicles, medical
                                         diagnosis, etc., where safety, security and reliability are of utmost importance.
                                         Adversarial defenses have mostly focused on classification tasks [26, 4, 20, 12, 36, 19, 16]. Provable
                                         defenses based on convex-relaxation [52, 41, 45, 8, 46], interval-bound propagation [18, 21, 13, 39]
                                         and randomized smoothing [10, 28, 34, 43] that guarantee that the predicted class will remain the
                                         same in a certified region around the input point have also been studied. Among these approaches

                                         Preprint. Under review.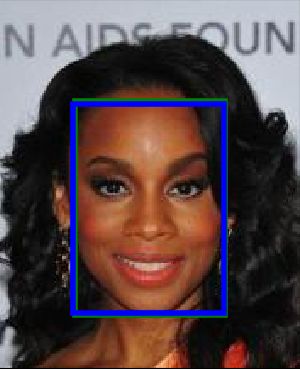
randomized smoothing scales up to high-dimensional inputs, such as images, and does not need
access to or make assumptions about the underlying model. The robustness certificates produced
are probabilistic, meaning that they hold with high probability. First studied by Cohen et al. in [10],
smoothing methods sample a set of points in a Gaussian cloud around an input, and aggregate the
predictions of the classifier on these points to generate the final output.
While accuracy is the standard quality measure for classification, more complex tasks may require
other quality metrics like total variation for images, intersection over union for object localization,
earth-mover distance for distributions, etc. In general, networks can be cast as functions of the type
f : Rk → (M, d) which map a k dimensional real-valued space into a metric space M with distance
function d : M × M → R≥0 . In this work, we extend randomized smoothing to obtain provable
robustness for functions that map into arbitrary metric spaces. We generate a robust version f¯ such
that the change in its output, as measured by d, is small for a small change in its input. More formally,
given an input x and an `2 -perturbation size 1 , we produce a value 2 with the guarantee that, with
high probability,
                            ∀x0 s.t. kx − x0 k2 ≤ 1 , d(f¯(x), f¯(x0 )) ≤ 2 .
Our contributions: We develop center smoothing, a technique
to make functions like f provably robust against adversarial
attacks. For a given input x, center smoothing samples a col-
lection of points in the neighborhood of x using a Gaussian
smoothing distribution, computes the function f on each of
these points and returns the center of the smallest ball enclos-
ing at least half the points in the output space (see figure 1).
Computing the minimum enclosing ball in the output space is
equivalent to solving the 1-center problem with outliers (hence
the name of our procedure), which is an NP-complete problem
for a general metric [44]. We approximate it by computing
the point that has the smallest median distance to all the other
points in the sample. We show that the output of the smoothed
function is robust to input perturbations of bounded `2 -size.           Figure 1: Center smoothing.
Although we defined the output space as a metric, our proofs only require the symmetry property and
triangle inequality to hold. Thus, center smoothing can also be applied to pseudometric distances
that need not satisfy the identity of indiscernibles. Many distances defined for images, such as total
variation, cosine distance, perceptual distances, etc., fall under this category. Center smoothing steps
outside the world of `p metrics, and certifies robustness in metrics like IoU/Jaccard distance for object
localization, and total-variation, which is a good measure of perceptual similarity for images. In our
experiments, we show that this method can produce meaningful certificates for a wide variety of
output metrics without significantly compromising the quality of the base model.
Related Work: Randomized smoothing has been extensively studied for classification problems to
obtain provably robust models against many different `p [10, 28, 43, 49, 35, 33, 29, 32] and non-`p
[30, 31] threat models. Beyond classification tasks, it has also been used for certifying the median
output of regression models [53] and the expected softmax scores of neural networks [25]. Smoothing
a vector-valued function by taking the mean of the output vectors has been shown to have a bounded
Lipschitz constant when both input and output spaces are `2 -metrics [51]. However, existing methods
do not generate the type of certificates described above for general distance metrics. Center smoothing
takes the distance function of the output space into account for generating the robust output and thus
results in a more natural smoothing procedure for the specific distance metric.

2   Preliminaries and Notations
Given a function f : Rk → (M, d) and a distribution D over the input space Rk , let f (D) denote
the probability distribution of the output of f in M when the input is drawn from D. For a point
x ∈ Rk , let x + P denote the probability distribution of the points x + δ where δ is a smoothing
noise drawn from a distribution P over Rk and let X be the random variable for x + P. For elements
in M , define B(z, r) = {z 0 | d(z, z 0 ) ≤ r} as a ball of radius r centered at z. Define a smoothed
version of f under P as the center of the ball with the smallest radius in M that encloses at least half
of the probability mass of f (x + P), i.e.,
                                                                           1
                           f¯P (x) = argmin r s.t. P[f (X) ∈ B(z, r)] ≥ .
                                          z                                2

                                                   2
If there are multiple balls with the smallest radius satisfying the above condition, return one of the
                          ∗
centers arbitrarily. Let rP (x) be the value of the minimum radius. Hereafter, we ignore the subscripts
and superscripts in the above definitions whenever they are obvious from context. In this work, we
sample the noise vector δ from an i.i.d Gaussian distribution of variance σ 2 in each dimension, i.e.,
δ ∼ N (0, σ 2 I).

2.1   Gaussian Smoothing

Cohen et al. in 2019 showed that a classifier h : Rk → Y smoothed with a Gaussian noise N (0, σ 2 I)
as,
                                 h̄(x) = argmax P [h(x + δ) = c] ,
                                             c∈Y
where Y is a set of classes, is certifiably robust to small perturbations in the input. Their certificate
relied on the fact that, if the probability of sampling from the top class at x under the smoothing
distribution is p, then for an `2 perturbation of size at most , the probability of the top class is
guaranteed to be at least
                                        p = Φ(Φ−1 (p) − /σ),                                        (1)
where Φ is the CDF of the standard normal distribution N (0, 1). This bound applies to any
{0, 1}-function over the input space Rk , i.e., if P[h(x) = 1] = p, then for any -size perturba-
tion x0 , P[h(x0 ) = 1] ≥ p .
We use this bound to generate robustness certificates for center smoothing. We identify a ball
B(f¯(x), R) of radius R enclosing a very high probability mass of the output distribution. One can
define a function that outputs one if f maps a point to inside B(f¯(x), R) and zero otherwise. The
bound in (1) gives us a region in the input space such that for any point inside it, at least half of the
mass of the output distribution is enclosed in B(f¯(x), R). We show in section 3 that the output of the
smoothed function for a perturbed input is guaranteed to be within a constant factor of R from the
output of the original input.

3     Center Smoothing
As defined in section 2, the output of f¯ is the center of the smallest ball in the output space that
encloses at least half the probability mass of the f (x + P). Thus, in order to significantly change the
output, an adversary has to find a perturbation such that a majority of the neighboring points map
far away from f¯(x). However, for a function that is roughly accurate on most points around x, a
small perturbation in the input cannot change the output of the smoothed function by much, thereby
making it robust.
For an `2 perturbation size of 1 of an input point x, let R
be the radius of a ball around f¯(x) that encloses more than
half the probability mass of f (x0 + P) for all x0 satisfying
kx − x0 k2 ≤ 1 , i.e.,
                                                         1
   ∀x0 s.t. kx − x0 k2 ≤ 1 , P[f (X 0 ) ∈ B(f¯(x), R)] > , (2)
                                                         2
where X 0 ∼ x0 + P. Basically, R is the radius of a ball
around f¯(x) that contains at least half the probability mass of
f (x0 + P) for any 1 -size perturbation x0 of x. Then, we have
the following robustness guarantee on f¯:
Theorem 1. For all x0 such that kx − x0 k2 ≤ 1 ,
                      d(f¯(x), f¯(x0 )) ≤ 2R.                        Figure 2: Robustness guarantee.
Proof. Consider the balls B(f¯(x0 ), r∗ (x0 )) and B(f¯(x), R) (see figure 2). From the definition of
r∗ (x0 ) and R, we know that the sum of the probability masses of f (x0 + P) enclosed by the two balls
must be strictly greater than one. Thus, they must have an element y in common. Since d satisfies the
triangle inequality, we have:
                              d(f¯(x), f¯(x0 )) ≤ d(f¯(x), y) + d(y, f¯(x0 ))
                                              ≤ R + r∗ (x0 ).

                                                   3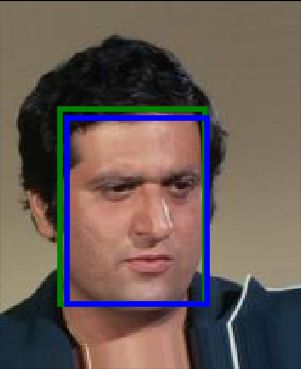
Since, the ball B(f¯(x), R) encloses more than half of the probability mass of f (x + P), the minimum
ball with at least half the probability mass cannot have a radius greater than R, i.e., r∗ (x0 ) ≤ R.
Therefore, d(f¯(x), f¯(x0 )) ≤ 2R.

The above result, in theory, gives us a smoothed version of f with a provable guarantee of robustness.
However, in practice, it may not be feasible to obtain f¯ just from samples of f (x + P). Instead, we
will use some procedure that approximates the smoothed output with high probability. For some
∆ ∈ [0, 1/2], let r̂(x, ∆) be the radius of the smallest ball that encloses at least 1/2 + ∆ probability
mass of f (x + P), i.e.,
                                                                         1
                         r̂(x, ∆) = min   r s.t. P[f (X) ∈ B(z 0 , r)] ≥ + ∆.
                                      z0                                 2
Now define a probabilistic approximation fˆ(x) of the smoothed function f¯ to be a point z ∈ M ,
which with probability at least 1 − α1 (for α1 ∈ [0, 1]), encloses at least 1/2 − ∆ probability mass of
f (x + P) within a ball of radius r̂(x, ∆). Formally, fˆ(x) is a point z ∈ M , such that, with at least
1 − α1 probability,
                                                                1
                                 P [f (X) ∈ B(z, r̂(x, ∆))] ≥ − ∆.
                                                                2
Defining R̂ to be the radius of a ball centered at fˆ(x) that satisfies:
                                                                               1
                     ∀x0 s.t. kx − x0 k2 ≤ 1 , P[f (X 0 ) ∈ B(fˆ(x), R̂)] >     + ∆,                    (3)
                                                                               2
we can write a probabilistic version of theorem 1,
Theorem 2. With probability at least 1 − α1 ,

                            ∀x0 s.t. kx − x0 k2 ≤ 1 , d(fˆ(x), fˆ(x0 )) ≤ 2R̂,

The proof of this theorem is in the appendix, and logically parallels the proof of theorem 1.

3.1   Computing fˆ

For an input x and a given value of ∆, sample n points independently from a Gaussian cloud
x + N (0, σ 2 I) around the point x and compute the function f on each of these points. Let Z =
{z1 , z2 , . . . , zn } be the set of n samples of f (x + N (0, σ 2 I)) produced in the output space. Compute
the minimum enclosing ball B(z, r) that contains at least half of the points in Z. The following
lemma bounds the radius r of this ball by the radius of the smallest ball enclosing at least 1/2 + ∆1
probability mass of the output distribution (proof in appendix).
                                                    2
Lemma 1. With probability at least 1 − e−2n∆1 ,
                                              r ≤ r̂(x, ∆1 ).

                                                                                  2
Now, sample a fresh batch of n random points and compute the 1 − e−2n∆1 probability Hoeffding
lower-bound p∆1 of the probability mass enclosed inside B(z, r) by conting the number of points
                                                                                                 2
that fall inside the ball, i.e., calculate the p∆1 for which, with probability at least 1 − e−2n∆1 ,
                                       P [f (X) ∈ B(z, r)] ≥ p∆1 .
Let ∆2 = 1/2 − p∆1 . If max(∆1 , ∆2 ) ≤ ∆, the point z satisfies the conditions in the definition of
                            2
fˆ, with at least 1 − 2e−2n∆1 probability. If max(∆1 , ∆2 ) > ∆, discard the computed center z and
abstain. In our experiments, we select ∆1 , n and α1 appropriately so that the above process succeeds
easily.
Computing the minimum enclosing ball B(z, r) exactly can be computationally challenging, as for
certain norms, it is known to be NP-complete [44]. Instead, we approximate it by computing a ball
β-MEB(Z, 1/2) that contains at least half the points in Z, but has a radius that is within βr units of
the optimal radius, for a constant β. We modify theorem 1 to account for this approximation (see
appendix for proof).

                                                        4
Algorithm 1 Smooth Algorithm 2 Certify
k
Input: x ∈ R , σ, ∆, α1 . Input: x ∈ Rk , 1 , σ, ∆, α1 , α2 .
Output: z ∈ M . Output: 2 ∈ R.
Set Z = {zi }ni=1 s.t. zi ∼ f (x + N (0, σ 2 I)). Compute fˆ(x) using algorithm 1.
Set Z = {zi }m 2
i=1 s.t. zi ∼ f (x + N (0, σ I)).
p
Set ∆1 = ln (2/α1 ) /2n.
Compute z = β-MEB(Z, 1/2). ˆ
Compute R̃ = {d(f (x), f (zi )) | zi ∈ Z}.
−1
Re-sample Z. Set p = Φ(Φp (1/2 + ∆) + 1 /σ).
Compute p∆1 . Set q = p + ln(1/α2 )/2m.
Set ∆2 = 1/2 − p∆1 . Set R̂ = qth-quantile of R̃.
If ∆ < max(∆1 , ∆2 ), discard z and abstain. Set 2 = (1 + β)R̂.
Theorem 3. With probability at least 1 − α1 ,
∀x0 s.t. kx − x0 k2 ≤ 1 , d(fˆ(x), fˆ(x0 )) ≤ (1 + β)R̂
2
where α1 = 2e−2n∆1 .
We use a simple approximation that works for all metrics and achieves an approximation factor of
two, producing a certified radius of 3R̂. It computes a point from the set Z, instead of a general point
in M , that has the minimum median distance from all the points in the set (including itself). This can
be achieved using O(n2 ) pair-wise distance computations. To see how the factor 2-approximation
is achieved, consider the optimal ball with radius r. Each pair of points is at most 2r distance from
each other. Thus, a ball with radius 2r, centered at one of these points will cover every other point
in the optimal ball. Better approximations can be obtained for specific norms, e.g., there exists a
(1 + )-approximation algorithm for the `2 norm [5]. For graph distances, the optimal radius can be
computed exactly using the above algorithm. The smoothing procedure is outlined in algorithm 1.
3.2 Certifying fˆ
Given an input x, compute fˆ(x) as described above. Now, we need to compute a radius R̂ that
satisfies condition 3. As per bound 1, in order to maintain a probability mass of at least 1/2 + ∆ for
any 1 -size perturbation of x, the ball B(fˆ(x), R̂) must enclose at least
−1 1 1
p=Φ Φ +∆ + (4)
2 σ
probability mass of f (x + P). Again, just as in the case of estimating f¯, we may only compute R̂
from a finite number of samples m of the distribution f (x + P). For each sample zi ∼ x + P, we
compute the distance d(fˆ(x), f (zi )) and set R̂ to be the qth-quantile R̃q of these distances for a q
that is slightly greater than p (see equation 5 below). The qth-quantile R̃q is a value larger than at
least q fraction of the samples. We set q as,
r
ln (1/α2 )
q =p+ , (5)
2m
for some small α2 ∈ [0, 1]. This guarantees that, with high probability, the ball B(fˆ(x), R̃q )
encloses at least p fraction of the probability mass of f (x + P). We prove the following lemma
by bounding the cumulative distribution function of the distances of f (zi )s from fˆ(x) using the
Dvoretzky–Kiefer–Wolfowitz inequality.
Lemma 2. With probability 1 − α2 ,
h i
P f (X) ∈ B(fˆ(x), R̃q ) > p
Combining with theorem 3, we have the final certificate:
∀x0 s.t. kx − x0 k2 ≤ 1 , d(fˆ(x), fˆ(x0 )) ≤ (1 + β)R̂,
5with probability at least 1 − α, for α = α1 + α2 . In our experiments, we set α1 = α2 = 0.005 to
achieve an overall success probability of 1 − α = 0.99, and calculate the required ∆1 , ∆2 and q
values accordingly. We set ∆ to be as small as possible without violating max(∆1 , ∆2 ) ≤ ∆ too
often. We use a β = 2-approximation for computing the minimum enclosing ball in the smoothing
step. Algorithm 2 provides the pseudocode for the certification procedure.
4 Relaxing Metric Requirements
Although we defined our procedure for metric outputs, our analysis does not critically use all the
properties of a metric. For instance, we do not require d(z1 , z2 ) to be strictly greater than zero for
z1 6= z2 . An example of such a distance measure is the total variation distance that returns zero for
two vectors that differ by a constant amount on each coordinate. Our proofs do implicitly use the
symmetry property, but asymmetric distances can be converted to symmetric ones by taking the sum
or the max of the distances in either directions. Perhaps the most important property of metrics that
we use is the triangle inequality as it is critical for the robustness guarantee of the smoothed function.
However, even this constraint may be partially relaxed. It is sufficient for the distance function d to
satisfy the triangle inequality approximately, i.e., d(a, c) ≤ γ(d(a, b) + d(b, c)), for some constant
γ. The theorems and lemmas can be adjusted to account for this approximation, e.g., the bound
in theorem 1 will become 2γR. A commonly used distance measure for comparing images and
documents is the cosine distance defined as the inner-product of two vectors after normalization. This
distance can be show to be proportional to the squared Euclidean distance between the normalized
vectors which satisfies the relaxed version of triangle inequality for γ = 2.
These relaxations extend the scope of center smoothing to many commonly used distance measures
that need not necessarily satisfy all the metric properties. For instance, perceptual distance metrics
measure the distance between two images in some feature space rather than image space. Such
distances align well with human judgements when the features are extracted from a deep neural
network [56] and are considered more natural measures for image similarity. For two images I1
and I2 , let φ(I1 ) and φ(I2 ) be their feature representations. Then, for a distance function d in
the feature space that satisfies the relaxed triangle inequality, we can define a distance function
dφ (I1 , I2 ) = d(φ(I1 ), φ(I2 )) in the image space, which also satisfies the relaxed triangle inequality.
For any image I3 ,
dφ (I1 , I2 ) = d(φ(I1 ), φ(I2 ))
≤ γ (d(φ(I1 ), φ(I3 )) + d(φ(I3 ), φ(I2 )))
= γ (dφ (I1 , I3 ) + dφ (I3 , I2 )) .
5 High-dimensional Outputs
For functions with high-dimensional outputs, like high-resolution images, it might be difficult to
compute the minimum enclosing ball (MEB) for a large number of points. The smoothing procedure
needs us to store all the n ∼ 103 − 104 sampled points until the MEB computation is complete,
requiring O(nk 0 ) space, where k 0 is the dimensionality of the output space. It does not allow us to
sample the n points in batches as is possible for the certification step. Also, computing the MEB by
considering the pair-wise distances between all the sampled points is time-consuming and requires
O(n2 ) pair-wise distance computations. To bring down the space and time requirements, we design
another version (Smooth-HD, algorithm 3) of the smoothing procedure where we compute the MEB
by first sampling a small number n0 ∼ 30 of candidate centers and then returning one of these
candidate centers that has the smallest median distance to a separate sample of n (
n0 ) points.
We sample the n points in batches and compute the distance d(ci , zj ) for each pair of candidate
center ci and point zj in a batch. The rest of the procedure remains the same as algorithm 1. It only
requires us to store batch-size number of output points and the n0 candidate centers at any given time,
significantly reducing the space complexity. Also, this procedure only requires O(n0 n) pair-wise
distance computations. The key idea here is that, with very high probability (> 1 − 10−9 ), at least
one of the n0 candidate centers will lie in the smallest ball that encloses at least 1/2 + ∆1 probability
mass of f (x + P). Also, with high probability, at least half of the n samples will lie in this ball
too. Thus, the median distance of this candidate center to the n samples is at most 2γ r̂(x, ∆1 ), after
accounting for the factor of γ in the relaxed version of the triangle inequality as discussed in section 4.
6Algorithm 3 Smooth-HD
Input: x ∈ Rk , σ, ∆, α1 .
Output: z ∈ M .
n0 2
Set C = {cpi }i=1 s.t. ci ∼ f (x + N (0, σ I)).
Set ∆1 = ln (2/α1 ) /2n.
Sample Z = {zj }nj=1 s.t. zj ∼ f (x + N (0, σ 2 I)) in batches.
For each batch, compute pair-wise distances d(ci , zj ) for ci ∈ C and zj in the batch.
Compute the center c ∈ C with the minimum median distance to the points in Z.
Re-sample Z in batches.
Compute p∆1 .
Set ∆2 = 1/2 − p∆1 .
If ∆ < max(∆1 , ∆2 ), discard c and abstain.
Ignoring the probability that none of the n0 points lie inside the ball, we can derive the following
version of theorem 3:
Theorem 4. With probability at least 1 − α1 ,
∀x0 s.t. kx − x0 k2 ≤ 1 , d(fˆ(x), fˆ(x0 )) ≤ γ(1 + 2γ)R̂
2
where α1 = 2e−2n∆1 .
6 Experiments
We apply center smoothing to certify a wide range of output metrics: Jaccard distance based on
intersection over union (IoU) of sets, total variation distances for images, and perceptual distance. We
certify the bounding box generated by a face detector – a key component of most facial recognition
systems – by guaranteeing the minimum overlap (measured using IoU) it must have with the output
under an adversarial perturbation of the input. For instance, if 1 = 0.2, the Jaccard distance (1-IoU)
is guaranteed to be bounded by 0.2, which implies that the bounding box of a perturbed image must
have at least 80% overlap with that of the clean image. We use a pre-trained face detection model
for this experiment. We certify the perceptual distance of the output of a generative model (trained
on ImageNet) that produces 128 × 128 RGB images using the above high-dimensional version of
the smoothing procedure Smooth-HD. For total variation distance, we use simple, easy-to-train
convolutional neural network based dimensionality reduction (autoencoder) and image reconstruction
models. Our goal is to demonstrate the effectiveness of our method for a wide range of applications
and so, we place less emphasis on the performance of the underlying models being smoothed. In
each case, we show that our method is capable of generating certified guarantees without significantly
degrading the performance of the underlying model. We provide additional experiments for other
metrics and parameter settings in the appendix.
As is common in the randomized smoothing literature, we train our base models (except for the
pre-trained ones) on noisy data with different noise levels σ = 0.1, 0.2, . . . , 0.5 to make them more
robust to input perturbations. We use n = 104 samples to estimate the smoothed function and
m = 106 samples to generate certificates, unless stated otherwise. We set ∆ = 0.05, α1 = 0.005
and α2 = 0.005 as discussed in previous sections. We grow the smoothing noise σ linearly with the
input perturbation 1 . Specifically, we maintain 1 = hσ for different values of h = 2, 1 and 1.5
in our experiments. We plot the median certified output radius 2 and the median smoothing loss,
defined as the distance between the outputs of the base model and the smoothed model d(f (x), fˆ(x)),
of fifty random test examples for different values of 1 . In all our experiments, we observe that
both these quantities increase as the input radius 1 increases, but the smoothing error remains
significantly below the certified output radius. Also, increasing the value of h improves the quality
of the certificates (lower 2 ). This could be due to the fact that for a higher h, the smoothing noise
σ is lower (keeping 1 constant), which means that the radius of the minimum enclosing ball in
the output space is smaller leading to a tighter certificate. We ran all our experiments on a single
NVIDIA GeForce RTX 2080 Ti GPU in an internal cluster. Each of the fifty examples we certify
took somewhere between 1-3 minutes depending on the underlying model.
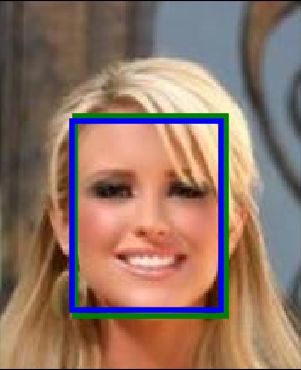
7(a) Certifying Jaccard Distance (1 - IoU). (b) Smoothed Output.
Figure 3: Face Detection on CelebA using MTCNN detector: Part (a) plots the certified output radius
2 and the smoothing error for h = 1 and 2. Part (b) compares the smoothed output (blue box) to
the output of the base model (green box, mostly hidden behind the blue box) showing a significant
overlap.
6.1 Jaccard distance
It is known that facial recognition systems can be deceived to evade detection, impersonate authorized
individuals and even render completely ineffective [50, 47, 14]. Most facial recognition systems first
detect a region that contains a persons face, e.g. a bounding box, and then uses facial features to
identify the individual in the image. To evade detection, an attacker may seek to degrade the quality of
the bounding boxes produced by the detector and can even cause it to detect no box at all. Bounding
boxes are often interpreted as sets and the their quality is measured as the amount of overlap with the
desired output. When no box is output, we say the overlap is zero. The overlap between two sets is
defined as the ratio of the size of the intersection between them to the size of their union (IoU). Thus,
to certify the robustness of the output of a face detector, it makes sense to bound the worst-case IoU
of the output of an adversarial input to that of a clean input. The corresponding distance function,
known as Jaccard distance, is defined as 1 − IoU which defines a metric over the universe of sets.
|A ∩ B| |A ∩ B|
IoU (A, B) = , dJ (A, B) = 1 − IoU (A, B) = 1 − .
|A ∪ B| |A ∪ B|
In this experiment, we certify the output of a pre-trained face detection model MTCNN [55] on
the CelebA face dataset [37]. We set n = 5000 and m = 10000, and use default values for other
parameters discussed above. Figure 3a plots the certified output radius 2 and the smoothing error for
h = 1 /σ = 1 and 2 for 1 = 0.1, 0.2, . . . , 0.5. Certifying the Jaccard distance allows us to certify
IoU as well, e.g., for h = 2, 2 is consistently below 0.2 which means that even the worst bounding
box under adversarial perturbation of the input has an overlap of at least 80% with the box for the
clean input. The low smoothing error shows that the performance of the base model does not drop
significantly as the actual output of the smoothed model has a large overlap with that of the base
model. Figure 3b compares the outputs of the smoothed model (blue box) and the base model (green
box). For most of the images, the blue box overlaps with the green one almost perfectly.
6.2 Perceptual Distance
Deep generative models like GANs and VAEs have been shown to be vulnerable to adversarial
attacks [23]. One attack model is to produce an adversarial example that is close to the original input
in the latent space, measured using `2 -norm. The goal is to make the model generate a different
looking image using a latent representation that is close to that of the original image. We apply
center smoothing to a generative adversarial network BigGAN pre-trained on ImageNet images [3].
We use the version of the GAN that generates 128 × 128 resolution ImageNet images from a set
of 128 latent variables. Since we are interested in producing similar looking images for similar
latent representations, a good output metric would be the perceptual distance between two images
measured by LPIPS metric [56]. This distance function takes in two images, passes them through a
deep neural network, such as VGG, and computes a weighted sum of the square of the differences of
8(b) Model Output vs Smoothed
(a) Certifying perceptual distance. Output.
Figure 4: Generative model for ImageNet: Part (a) plots the certified output radius 2 and the
smoothing error for h = 1 and 1.5. Part (b) compares the output of the base model to that of the
smoothed model.
the activations (after some normalization) produced by the two images. The process can be thought
of as generating two feature vectors φ1 and φ2 for the two input images I1 and I2 respectively, then
computing a weighted sum of the element-wise square of the differences between the two feature
vectors, i.e.,
X
d(I1 , I2 ) = wi (φ1i − φ2i )2
i
The square of differences metric can be shown to follow the relaxed triangle inequality for γ = 2.
Therefore, the the final bound on the certified output radius will be γ(1 + 2γ)R̂ = 10R̂. Figure 4a
plots the median smoothing error and certified output radius 2 for fifty randomly picked latent vectors
for 1 = 0.01, 0.02, . . . , 0.05 and h = 1, 1.5. For these experiments, we set n = 2000, m = 104 and
∆ = 0.8. We use the modified smoothing procedure Smooth-HD (algorithm 3) for high-dimensional
outputs presented in section 5 with a small batch size of 150 to accommodate the samples in memory.
It takes about three minutes to smooth and certify each input on a single NVIDIA GeForce RTX 2080
Ti GPU in an internal cluster. Due to the higher factor of ten in the certified output radius in this case
compared to our other experiments where the factor is three, the certified output radius increases
faster with the input radius 1 , but the smoothing error remains low showing that, in practice, the
method does not significantly degrade the performance of the base model. Figure 4b shows that,
visually, the smoothed output is not very different from the output of the base model. The input radii
we certify for are lower in this case than our other experiments due to the low dimensionality (only
128 dimensions) of the input (latent) space as compared to the input (image) spaces in our other
experiments.
6.3 Total Variation Distance
The total variation norm of a vector x is defined as the sum of the magnitude of the difference between
pairs of coordinates defined by a neighborhood set N . For a 1-dimensional array x with k elements,
one can define the neighborhood as the set of consecutive elements.
X k−1
X
T V (x) = |xi − xj |, T V1D (x) = |xi − xi+1 |.
(i,j)∈N i=1
Similarly, for a grayscale image represented by a h × w 2-dimensional array x, the neighborhood can
be defined as the next element (pixel) in the row/column. In case of an RGB image, the difference
between the neighboring pixels is a vector, whose magnitude can be computed using an `p -norm. For,
our experiments we use the `1 -norm.
h−1
X w−1
X
T VRGB (x) = kxi,j − xi+1,j k1 + kxi,j − xi,j+1 k1
i=1 j=1
9(a) Dimensionality Reduction on MNIST (b) Dimensionality Reduction on CIFAR-10
(c) Image Reconstruction on MNIST (d) Image Reconstruction on CIFAR-10
Figure 5: Certifying Total Variation Distance
The total variation distance between two images I1 and I2 can be defined as the total variation
norm of the difference I1 − I2 , i.e., T V D(I1 , I2 ) = T V (I1 − I2 ). The above distance defines a
pseudometric over the space of images as it satisfies the symmetry property and the triangle inequality,
but may violate the identity of indiscernibles as an image obtained by adding the same value to all
the pixel intensities has a distance of zero from the original image. However, as noted in section 4,
our certificates hold even for this setting.
We certify total variation distance for the problems of dimensionality reduction and image recon-
struction on MNIST [11] and CIFAR-10 [24]. The base-model for dimensionality reduction is an
autoencoder that uses convolutional layers in its encoder module to map an image down to a small
number of latent variables. The decoder applies a set of de-convolutional operations to reconstruct
the same image. We insert batch-norm layers in between these operations to improve performance.
For image reconstruction, the goal is to recover an image from small number of measurements of the
original image. We apply a transformation defined by Gaussian matrix A on each image to obtain the
measurements. The base model tries to reconstruct the original image from the measurements. The
attacker, in this case, is assumed to add a perturbation in the measurement space instead of the image
space (as in dimensionality reduction). The model first reverts the measurement vector to a vector
in the image space by simply applying the pseudo-inverse of A and then passes it through a similar
autoencoder model as for dimensionality reduction. We present results for 1 = 0.2, 0.4, . . . , 1.0
and h = 2, 1.5 and use 256 latent dimensions and measurements for these experiments in figure 5.
To put these plots in perspective, the maximum TVD between two CIFAR-10 images could be
6 × 31 × 31 = 5766 and between MNIST images could be 2 × 27 × 27 = 1458 (pixel values between
0 and 1).
7 Conclusion
Randomized smoothing can be extended beyond classification tasks to obtain provably robust models
for problems where the quality of the output is measured using a distance metric. We design a
procedure that can make any model of this kind provably robust against norm bounded adversarial
perturbations of the input. In our experiments, we demonstrate that it can generate meaningful
certificates under a wide variety of distance metrics without significantly compromising the quality
of the base model. We also note that the metric requirements on the distance measure can be partially
relaxed in exchange for weaker certificates.
10In this work, we focus on `2 -norm bounded adversaries and the Gaussian smoothing distribution. An
important direction for future investigation could be whether this method can be generalised beyond
`p -adversaries to more natural threat models, e.g., adversaries bounded by total variation distance,
perceptual distance, cosine distance, etc. Center smoothing does not critically rely on the shape of the
smoothing distribution or the threat model. Thus, improvements in these directions could potentially
be coupled with our method to broaden the scope of provable robustness in machine learning.
References
[1] Vegard Antun, Francesco Renna, Clarice Poon, Ben Adcock, and Anders C. Hansen. On
instabilities of deep learning in image reconstruction - does AI come at a cost? CoRR,
abs/1902.05300, 2019. URL http://arxiv.org/abs/1902.05300.
[2] Vahid Behzadan and Arslan Munir. Vulnerability of deep reinforcement learning to policy
induction attacks. In Petra Perner, editor, Machine Learning and Data Mining in Pattern
Recognition - 13th International Conference, MLDM 2017, New York, NY, USA, July 15-20,
2017, Proceedings, volume 10358 of Lecture Notes in Computer Science, pages 262–275.
Springer, 2017. doi: 10.1007/978-3-319-62416-7\_19. URL https://doi.org/10.1007/
978-3-319-62416-7_19.
[3] Andrew Brock, Jeff Donahue, and Karen Simonyan. Large scale GAN training for high
fidelity natural image synthesis. In 7th International Conference on Learning Representations,
ICLR 2019, New Orleans, LA, USA, May 6-9, 2019. OpenReview.net, 2019. URL https:
//openreview.net/forum?id=B1xsqj09Fm.
[4] Jacob Buckman, Aurko Roy, Colin Raffel, and Ian J. Goodfellow. Thermometer encoding:
One hot way to resist adversarial examples. In 6th International Conference on Learning
Representations, ICLR 2018, Vancouver, BC, Canada, April 30 - May 3, 2018, Conference Track
Proceedings, 2018.
[5] Mihai Bundefineddoiu, Sariel Har-Peled, and Piotr Indyk. Approximate clustering via core-sets.
In Proceedings of the Thiry-Fourth Annual ACM Symposium on Theory of Computing, STOC
’02, page 250–257, New York, NY, USA, 2002. Association for Computing Machinery. ISBN
1581134959. doi: 10.1145/509907.509947. URL https://doi.org/10.1145/509907.
509947.
[6] Francesco Calivá, Kaiyang Cheng, Rutwik Shah, and Valentina Pedoia. Adversarial robust
training in mri reconstruction. arXiv preprint arXiv:2011.00070, 2020.
[7] Kaiyang Cheng, Francesco Calivá, Rutwik Shah, Misung Han, Sharmila Majumdar, and
Valentina Pedoia. Addressing the false negative problem of deep learning mri reconstruction
models by adversarial attacks and robust training. In Tal Arbel, Ismail Ben Ayed, Marleen
de Bruijne, Maxime Descoteaux, Herve Lombaert, and Christopher Pal, editors, Proceedings of
the Third Conference on Medical Imaging with Deep Learning, volume 121 of Proceedings of
Machine Learning Research, pages 121–135, Montreal, QC, Canada, 06–08 Jul 2020. PMLR.
URL http://proceedings.mlr.press/v121/cheng20a.html.
[8] Ping-yeh Chiang, Renkun Ni, Ahmed Abdelkader, Chen Zhu, Christoph Studer, and Tom
Goldstein. Certified defenses for adversarial patches. In 8th International Conference on
Learning Representations, 2020.
[9] Jun-Ho Choi, Huan Zhang, Jun-Hyuk Kim, Cho-Jui Hsieh, and Jong-Seok Lee. Evaluating
robustness of deep image super-resolution against adversarial attacks. In 2019 IEEE/CVF
International Conference on Computer Vision, ICCV 2019, Seoul, Korea (South), October
27 - November 2, 2019, pages 303–311. IEEE, 2019. doi: 10.1109/ICCV.2019.00039. URL
https://doi.org/10.1109/ICCV.2019.00039.
[10] Jeremy Cohen, Elan Rosenfeld, and Zico Kolter. Certified adversarial robustness via randomized
smoothing. In Kamalika Chaudhuri and Ruslan Salakhutdinov, editors, Proceedings of the
36th International Conference on Machine Learning, volume 97 of Proceedings of Machine
Learning Research, pages 1310–1320, Long Beach, California, USA, 09–15 Jun 2019. PMLR.
[11] Li Deng. The mnist database of handwritten digit images for machine learning research [best of
the web]. IEEE Signal Processing Magazine, 29(6):141–142, 2012. doi: 10.1109/MSP.2012.
2211477.
11[12] Guneet S. Dhillon, Kamyar Azizzadenesheli, Zachary C. Lipton, Jeremy Bernstein, Jean
Kossaifi, Aran Khanna, and Animashree Anandkumar. Stochastic activation pruning for robust
adversarial defense. In 6th International Conference on Learning Representations, ICLR 2018,
Vancouver, BC, Canada, April 30 - May 3, 2018, Conference Track Proceedings, 2018.
[13] Krishnamurthy Dvijotham, Sven Gowal, Robert Stanforth, Relja Arandjelovic, Brendan
O’Donoghue, Jonathan Uesato, and Pushmeet Kohli. Training verified learners with learned
verifiers, 2018.
[14] Morgan Frearson and Kien Nguyen. Adversarial attack on facial recognition using visible light.
arXiv preprint arXiv:2011.12680, 2020.
[15] Adam Gleave, Michael Dennis, Cody Wild, Neel Kant, Sergey Levine, and Stuart Russell.
Adversarial policies: Attacking deep reinforcement learning. In 8th International Confer-
ence on Learning Representations, ICLR 2020, Addis Ababa, Ethiopia, April 26-30, 2020.
OpenReview.net, 2020. URL https://openreview.net/forum?id=HJgEMpVFwB.
[16] Zhitao Gong, Wenlu Wang, and Wei-Shinn Ku. Adversarial and clean data are not twins. CoRR,
abs/1704.04960, 2017.
[17] Ian J. Goodfellow, Jonathon Shlens, and Christian Szegedy. Explaining and harnessing adver-
sarial examples. In 3rd International Conference on Learning Representations, ICLR 2015, San
Diego, CA, USA, May 7-9, 2015, Conference Track Proceedings, 2015.
[18] Sven Gowal, Krishnamurthy Dvijotham, Robert Stanforth, Rudy Bunel, Chongli Qin, Jonathan
Uesato, Relja Arandjelovic, Timothy Mann, and Pushmeet Kohli. On the effectiveness of
interval bound propagation for training verifiably robust models, 2018.
[19] Kathrin Grosse, Praveen Manoharan, Nicolas Papernot, Michael Backes, and Patrick D. Mc-
Daniel. On the (statistical) detection of adversarial examples. CoRR, abs/1702.06280, 2017.
[20] Chuan Guo, Mayank Rana, Moustapha Cissé, and Laurens van der Maaten. Countering
adversarial images using input transformations. In 6th International Conference on Learning
Representations, ICLR 2018, Vancouver, BC, Canada, April 30 - May 3, 2018, Conference Track
Proceedings, 2018.
[21] Po-Sen Huang, Robert Stanforth, Johannes Welbl, Chris Dyer, Dani Yogatama, Sven Gowal,
Krishnamurthy Dvijotham, and Pushmeet Kohli. Achieving verified robustness to symbol
substitutions via interval bound propagation. In Proceedings of the 2019 Conference on
Empirical Methods in Natural Language Processing and the 9th International Joint Conference
on Natural Language Processing, EMNLP-IJCNLP 2019, Hong Kong, China, November 3-7,
2019, pages 4081–4091, 2019. doi: 10.18653/v1/D19-1419. URL https://doi.org/10.
18653/v1/D19-1419.
[22] Sandy H. Huang, Nicolas Papernot, Ian J. Goodfellow, Yan Duan, and Pieter Abbeel. Adversarial
attacks on neural network policies. In 5th International Conference on Learning Representations,
ICLR 2017, Toulon, France, April 24-26, 2017, Workshop Track Proceedings. OpenReview.net,
2017. URL https://openreview.net/forum?id=ryvlRyBKl.
[23] Jernej Kos, Ian Fischer, and Dawn Song. Adversarial examples for generative models. In 2018
IEEE Security and Privacy Workshops, SP Workshops 2018, San Francisco, CA, USA, May
24, 2018, pages 36–42. IEEE Computer Society, 2018. doi: 10.1109/SPW.2018.00014. URL
https://doi.org/10.1109/SPW.2018.00014.
[24] Alex Krizhevsky, Vinod Nair, and Geoffrey Hinton. Cifar-10 (canadian institute for advanced
research). URL http://www.cs.toronto.edu/~kriz/cifar.html.
[25] Aounon Kumar, Alexander Levine, Soheil Feizi, and Tom Goldstein. Certifying confidence
via randomized smoothing. In Hugo Larochelle, Marc’Aurelio Ranzato, Raia Hadsell, Maria-
Florina Balcan, and Hsuan-Tien Lin, editors, Advances in Neural Information Processing
Systems 33: Annual Conference on Neural Information Processing Systems 2020, NeurIPS
2020, December 6-12, 2020, virtual, 2020. URL https://proceedings.neurips.cc/
paper/2020/hash/37aa5dfc44dddd0d19d4311e2c7a0240-Abstract.html.
[26] Alexey Kurakin, Ian J. Goodfellow, and Samy Bengio. Adversarial machine learning at scale. In
5th International Conference on Learning Representations, ICLR 2017, Toulon, France, April
24-26, 2017, Conference Track Proceedings, 2017. URL https://openreview.net/forum?
id=BJm4T4Kgx.
12[27] Cassidy Laidlaw and Soheil Feizi. Functional adversarial attacks. In Hanna M. Wallach,
Hugo Larochelle, Alina Beygelzimer, Florence d’Alché-Buc, Emily B. Fox, and Roman Gar-
nett, editors, Advances in Neural Information Processing Systems 32: Annual Conference
on Neural Information Processing Systems 2019, NeurIPS 2019, 8-14 December 2019, Van-
couver, BC, Canada, pages 10408–10418, 2019. URL http://papers.nips.cc/paper/
9228-functional-adversarial-attacks.
[28] Mathias Lécuyer, Vaggelis Atlidakis, Roxana Geambasu, Daniel Hsu, and Suman Jana. Certified
robustness to adversarial examples with differential privacy. In 2019 IEEE Symposium on
Security and Privacy, SP 2019, San Francisco, CA, USA, May 19-23, 2019, pages 656–672,
2019.
[29] Guang-He Lee, Yang Yuan, Shiyu Chang, and Tommi S. Jaakkola. Tight certificates of
adversarial robustness for randomly smoothed classifiers. In Advances in Neural Information
Processing Systems 32: Annual Conference on Neural Information Processing Systems 2019,
NeurIPS 2019, 8-14 December 2019, Vancouver, BC, Canada, pages 4911–4922, 2019.
[30] Alexander Levine and Soheil Feizi. Wasserstein smoothing: Certified robustness against
wasserstein adversarial attacks, 2019.
[31] Alexander Levine and Soheil Feizi. (de)randomized smoothing for certifiable defense against
patch attacks. CoRR, abs/2002.10733, 2020. URL https://arxiv.org/abs/2002.10733.
[32] Alexander Levine and Soheil Feizi. Robustness certificates for sparse adversarial attacks by
randomized ablation. In The Thirty-Fourth AAAI Conference on Artificial Intelligence, AAAI
2020, The Thirty-Second Innovative Applications of Artificial Intelligence Conference, IAAI
2020, The Tenth AAAI Symposium on Educational Advances in Artificial Intelligence, EAAI
2020, New York, NY, USA, February 7-12, 2020, pages 4585–4593. AAAI Press, 2020. URL
https://aaai.org/ojs/index.php/AAAI/article/view/5888.
[33] Alexander Levine, Aounon Kumar, Thomas Goldstein, and Soheil Feizi. Tight second-order
certificates for randomized smoothing, 2020.
[34] Bai Li, Changyou Chen, Wenlin Wang, and Lawrence Carin. Certified adversarial robustness
with additive noise. In Advances in Neural Information Processing Systems 32: Annual
Conference on Neural Information Processing Systems 2019, NeurIPS 2019, 8-14 December
2019, Vancouver, BC, Canada, pages 9459–9469, 2019.
[35] Bai Li, Changyou Chen, Wenlin Wang, and Lawrence Carin. Second-order adversarial attack
and certifiable robustness, 2019. URL https://openreview.net/forum?id=SyxaYsAqY7.
[36] Xin Li and Fuxin Li. Adversarial examples detection in deep networks with convolutional filter
statistics. In IEEE International Conference on Computer Vision, ICCV 2017, Venice, Italy,
October 22-29, 2017, pages 5775–5783, 2017.
[37] Ziwei Liu, Ping Luo, Xiaogang Wang, and Xiaoou Tang. Deep learning face attributes in the
wild. In Proceedings of International Conference on Computer Vision (ICCV), December 2015.
[38] Aleksander Madry, Aleksandar Makelov, Ludwig Schmidt, Dimitris Tsipras, and Adrian Vladu.
Towards deep learning models resistant to adversarial attacks. In 6th International Conference
on Learning Representations, ICLR 2018, Vancouver, BC, Canada, April 30 - May 3, 2018,
Conference Track Proceedings, 2018.
[39] Matthew Mirman, Timon Gehr, and Martin Vechev. Differentiable abstract interpretation for
provably robust neural networks. In Jennifer Dy and Andreas Krause, editors, Proceedings of
the 35th International Conference on Machine Learning, volume 80 of Proceedings of Machine
Learning Research, pages 3578–3586. PMLR, 10–15 Jul 2018. URL http://proceedings.
mlr.press/v80/mirman18b.html.
[40] Anay Pattanaik, Zhenyi Tang, Shuijing Liu, Gautham Bommannan, and Girish Chowdhary.
Robust deep reinforcement learning with adversarial attacks. In Elisabeth André, Sven Koenig,
Mehdi Dastani, and Gita Sukthankar, editors, Proceedings of the 17th International Conference
on Autonomous Agents and MultiAgent Systems, AAMAS 2018, Stockholm, Sweden, July 10-15,
2018, pages 2040–2042. International Foundation for Autonomous Agents and Multiagent
Systems Richland, SC, USA / ACM, 2018. URL http://dl.acm.org/citation.cfm?id=
3238064.
13[41] Aditi Raghunathan, Jacob Steinhardt, and Percy Liang. Semidefinite relaxations for certifying
robustness to adversarial examples. In Proceedings of the 32nd International Conference on
Neural Information Processing Systems, NIPS’18, page 10900–10910, Red Hook, NY, USA,
2018. Curran Associates Inc.
[42] Ankit Raj, Yoram Bresler, and Bo Li. Improving robustness of deep-learning-based image
reconstruction. In Proceedings of the 37th International Conference on Machine Learning,
ICML 2020, 13-18 July 2020, Virtual Event, volume 119 of Proceedings of Machine Learning
Research, pages 7932–7942. PMLR, 2020. URL http://proceedings.mlr.press/v119/
raj20a.html.
[43] Hadi Salman, Jerry Li, Ilya P. Razenshteyn, Pengchuan Zhang, Huan Zhang, Sébastien Bubeck,
and Greg Yang. Provably robust deep learning via adversarially trained smoothed classifiers.
In Advances in Neural Information Processing Systems 32: Annual Conference on Neural
Information Processing Systems 2019, NeurIPS 2019, 8-14 December 2019, Vancouver, BC,
Canada, pages 11289–11300, 2019.
[44] Vladimir Shenmaier. Complexity and approximation of the smallest k-enclosing ball problem.
European Journal of Combinatorics, 48:81 – 87, 2015. ISSN 0195-6698. doi: https://doi.org/10.
1016/j.ejc.2015.02.011. URL http://www.sciencedirect.com/science/article/pii/
S0195669815000335.
[45] Sahil Singla and Soheil Feizi. Robustness certificates against adversarial examples for relu
networks. CoRR, abs/1902.01235, 2019.
[46] Sahil Singla and Soheil Feizi. Second-order provable defenses against adversarial attacks, 2020.
[47] Qing Song, Yingqi Wu, and Lu Yang. Attacks on state-of-the-art face recognition using
attentional adversarial attack generative network. CoRR, abs/1811.12026, 2018. URL http:
//arxiv.org/abs/1811.12026.
[48] Christian Szegedy, Wojciech Zaremba, Ilya Sutskever, Joan Bruna, Dumitru Erhan, Ian J.
Goodfellow, and Rob Fergus. Intriguing properties of neural networks. In 2nd International
Conference on Learning Representations, ICLR 2014, Banff, AB, Canada, April 14-16, 2014,
Conference Track Proceedings, 2014.
[49] Jiaye Teng, Guang-He Lee, and Yang Yuan. `1 adversarial robustness certificates: a randomized
smoothing approach, 2020. URL https://openreview.net/forum?id=H1lQIgrFDS.
[50] Fatemeh Vakhshiteh, Raghavendra Ramachandra, and Ahmad Nickabadi. Threat of adversarial
attacks on face recognition: A comprehensive survey. arXiv preprint arXiv:2007.11709, 2020.
[51] Adva Wolf. Making medical image reconstruction adversarially robust. 2019. URL http:
//cs229.stanford.edu/proj2019spr/report/97.pdf.
[52] Eric Wong and J. Zico Kolter. Provable defenses against adversarial examples via the convex
outer adversarial polytope. In Proceedings of the 35th International Conference on Machine
Learning, ICML 2018, Stockholmsmässan, Stockholm, Sweden, July 10-15, 2018, pages 5283–
5292, 2018.
[53] Ping yeh Chiang, Michael J. Curry, Ahmed Abdelkader, Aounon Kumar, John Dickerson, and
Tom Goldstein. Detection as regression: Certified object detection by median smoothing, 2020.
[54] Minghao Yin, Yongbing Zhang, Xiu Li, and Shiqi Wang. When deep fool meets deep prior:
Adversarial attack on super-resolution network. In Proceedings of the 26th ACM International
Conference on Multimedia, MM ’18, page 1930–1938, New York, NY, USA, 2018. Association
for Computing Machinery. ISBN 9781450356657. doi: 10.1145/3240508.3240603. URL
https://doi.org/10.1145/3240508.3240603.
[55] Kaipeng Zhang, Zhanpeng Zhang, Zhifeng Li, and Yu Qiao. Joint face detection and alignment
using multi-task cascaded convolutional networks. CoRR, abs/1604.02878, 2016. URL http:
//arxiv.org/abs/1604.02878.
[56] Richard Zhang, Phillip Isola, Alexei A. Efros, Eli Shechtman, and Oliver Wang. The un-
reasonable effectiveness of deep features as a perceptual metric. In 2018 IEEE Conference
on Computer Vision and Pattern Recognition, CVPR 2018, Salt Lake City, UT, USA, June
18-22, 2018, pages 586–595. IEEE Computer Society, 2018. doi: 10.1109/CVPR.2018.
00068. URL http://openaccess.thecvf.com/content_cvpr_2018/html/Zhang_The_
Unreasonable_Effectiveness_CVPR_2018_paper.html.
14A Proof of Theorem 2
Let z 0 = fˆ(x0 ). Then, by definition of fˆ,
1
P [f (X 0 ) ∈ B(z 0 , r̂(x0 , ∆))] ≥ − ∆, (6)
2
where X 0 ∼ x0 + P and
1
r̂(x0 , ∆) = min r s.t. P[f (X 0 ) ∈ B(z 00 , r)] ≥ + ∆.
00
z 2
And, by definition of R̂,
1
P[f (X 0 ) ∈ B(fˆ(x), R̂)] > + ∆. (7)
2
Therefore, from (6) and (7), B(z 0 , r̂(x0 , ∆)) and B(fˆ(x), R̂) must have a non-empty intersection.
Let, y be a point in that intersection. Then,
d(fˆ(x), fˆ(x0 )) ≤ d(fˆ(x), y) + d(y, z 0 )
≤ r̂(x0 , ∆) + R̂.
Since, by definition, r̂(x0 , ∆) is the radius of the smallest ball with 1/2 + ∆ probability mass of
f (x0 + P) over all possible centers in Rk and R̂ is the radius of the smallest such ball centered at
fˆ(x), we must have r̂(x0 , ∆) ≤ R̂. Therefore,
d(fˆ(x), fˆ(x0 )) ≤ 2R̂.
B Proof of Lemma 1
Consider the smallest ball B(z 0 , r̂(x, ∆1 )) that encloses at least 1/2 + ∆1 probability mass of
2
f (x + P). By Hoeffding’s inequality, with at least 1 − e−2n∆1 probability, at least half the points in
Z must be in this ball. Since, r is the radius of the minimum enclosing ball that contains at least half
of the points in Z, we have r ≤ r̂(x, ∆1 ).
C Proof of Theorem 3
β-MEB(Z, 1/2) computes a β-approximation of the minimum enclosing ball that contains at least
2
half of the points of Z. Therefore, by lemma 1, with probability at least 1 − e−2n∆1 ,
β-MEB(Z, 1/2) ≤ βr̂(x, ∆1 ) ≤ βr̂(x, ∆),
since ∆ ≥ ∆1 . Thus, the procedure to compute fˆ, if succeeds, will output a point z ∈ Rk which,
2
with probability at least 1 − 2e−2n∆1 , will satisfy,
1
P [f (X) ∈ B(z, βr̂(x, ∆))] ≥ − ∆.
2
Now, using the definition of R̂ and following the same reasoning as theorem 2, we can say that,
d(fˆ(x), fˆ(x0 )) ≤ βr̂(x0 , ∆) + R̂
≤ (1 + β)R̂.
D Proof of Lemma 2
Given z = fˆ(x), define a random variable Q = d(z, f (X)), where is X ∼ x + P. For m i.i.d.
samples of X, the values of Q are independently and identically distributed. Let F (r) denote the true
15cumulative distribution function of Q and define the empirical cdf Fm (r) to be the fraction of the m
samples of Q that are less than or equal to r, i.e.,
m
1 X
Fm (r) = 1{Qi ≤r}
m i=1
Using the Dvoretzky–Kiefer–Wolfowitz inequality, we have,
2
P sup (Fm (r) − F (r)) > ≤ e−2m
r∈R
q 2
for ≥ 1
2m ln 2. Setting, e−2m = α2 for some α2 ≤ 1/2, we have,
r
ln (1/α2 )
sup (Fm (r) − F (r)) <
r∈R 2m
with probability at least 1 − α2 . Set r = R̃q , the qth quantile of of the m samples. Then,
r
ln (1/α2 )
F (R̃q ) > Fm (R̃q ) −
2m
r
h i ln (1/α2 )
or, P Q ≤ R̃q > q − = p.
2m
With probability 1 − α2 ,
h i
P f (X) ∈ B(fˆ(x), R̃q ) > p.
E Angular Distance
A common measure for similarity of two vectors A and B is the cosine similarity between them,
defined as below:
P
A·B Ai B i
cos(A, B) = = qP i pP .
kAk2 kBk2 2 2
j Aj k Bk
In order to convert it into a distance, we can compute the angle between the two vectors by taking the
cosine inverse of the above similarity measure, which is known as angular distance:
AD(A, B) = cos−1 (cos(A, B))/π.
Angular distance always remains between 0 and 1, and similar to the total variation distance, angular
distance also defines a pseudometric on the output space. We repeat the same experiments with the
same models and hyper-parameter settings as for total variation distance (figure 6). The results are
similar in trend in all the experiments conducted, showing that center smoothing can be reliably
applied to a vast range of output metrics to obtain similar robustness guarantees.
16(a) Dimensionality Reduction on MNIST (b) Dimensionality Reduction on CIFAR-10
(c) Image Reconstruction on MNIST (d) Image Reconstruction on CIFAR-10
Figure 6: Certifying Angular Distance
17You can also read