Carbon Footprint of Wines from the Finger Lakes Region in New York State - MDPI
←
→
Page content transcription
If your browser does not render page correctly, please read the page content below
sustainability

Article
Carbon Footprint of Wines from the Finger Lakes
Region in New York State
Amanda J. Trombly 1 and Marie-Odile P. Fortier 2, *
 1    Department of Forest and Natural Resources Management, State University of New York
      College of Environmental Science and Forestry, Syracuse, NY 13210, USA; ajtrombl@syr.edu
 2    Department of Civil and Environmental Engineering, University of California Merced,
      Merced, CA 95343, USA
 *    Correspondence: mfortier2@ucmerced.edu

 Received: 21 April 2019; Accepted: 20 May 2019; Published: 23 May 2019

 Abstract: The goal of this study was to evaluate the cradle-to-gate greenhouse gas emissions of
 Finger Lakes wine using life cycle assessment. It was hypothesized that the carbon footprint of
 Finger Lakes wines would be lower than that of wines from other regions, based on winery practices
 and climate conditions. Primary data was collected from three wineries representing a range of
 production volumes, and sensitivity analyses were also performed. Bottle production contributed
 the most to the impacts of the wine. Impacts associated with cultivation were highest for the winery
 with the smallest production volume. The cradle-to-gate greenhouse gas emissions for the three case
 studies ranged from 0.617 to 1.03 kg CO2eq bottle−1 . These results suggest that wines from these three
 Finger Lakes wineries have among the lowest carbon footprints of wines globally (which range from
 0.68 to 2.68 kg CO2eq bottle−1 ), promoting the need to assess the impacts of other wineries in this
 wine region.

 Keywords: life cycle assessment; carbon footprint; wine; Finger Lakes; New York State

1. Introduction
     Life cycle assessment (LCA) as a research methodology to determine environmental impacts
of consumer products has become increasingly frequent in the scientific community. This is due to
the ever-growing interest of consumers and business-owners alike in the environmental impacts associated
with the products they consume and produce. LCA allows for these individuals to determine the impacts
of each step of the production process, and from the results, develop suggestions regarding which steps
could be improved. A match in scope and the functional unit between LCA studies provides researchers
and reviewers the benefit of directly comparing environmental impacts associated with products or
processes that provide the same function.
     One product that has increasingly received attention from LCA researchers is wine. The carbon
footprints or life cycle greenhouse gas (GHG) emissions have been calculated and published for wines
from multiple regions: Italy [1–4], Spain [5–7], Portugal [8], France [9], Luxembourg [10], Australia [11],
New Zealand [12], and Canada [13]. Variations in scope are evident among these previous wine LCAs.
Notably, two LCAs related to wine grapes produced in the United States do not include processes
beyond the agricultural phase [14,15]. Furthermore, no LCAs have been published for wine produced in
the Northeastern area of the United States, even though New York is the state with the third highest wine
production nationally [16]. The Finger Lakes region in central New York State is home to over 100 wineries
and boasts a robust tourism industry centered on the natural environment (e.g., Watkins Glen State Park)
and the winemaking industry. Four of the eleven Finger Lakes (Canandaigua, Seneca, Cayuga, and Keuka)

Sustainability 2019, 11, 2945; doi:10.3390/su11102945                      www.mdpi.com/journal/sustainability
Sustainability 2019, 11, 2945 2 of 27
host their own wine trails. Seneca Lake has nearly 70 wineries, more than 30 of which are members of
the Seneca Lake Wine Trail, representing the greatest number of any lake in the Finger Lakes region [17].
The Finger Lakes region presents a distinctive climatic setting for wine production. New York State
has winters during which temperatures can reach below negative 17.8 degrees Celsius and summer
temperatures that can often exceed 37.8 degrees Celsius [18]. Riesling production in particular has
become common in the Finger Lakes wine region, as Riesling grapes prefer cooler growing conditions,
having originated from the Rhine region in Germany [19]. The cold temperatures and snowfall in
the winter may also reduce the energy needs for cooling during winemaking. Furthermore, the region
also benefits from abundant rainfall during the growing seasons of economic crops as well as snowfall
in the winter [18], which may contribute to a lower need for irrigation relative to wine regions in
arid climates.
In addition to these climatic conditions, the production of Finger Lakes wines may also be
currently benefiting from low carbon-emission electricity. It has been estimated that at least
15 percent of wineries in the Finger Lakes have invested in solar energy in the last several years,
with the earliest in 2004, which started increasing with a cooperative effort by four of the larger wineries
in 2015 [20]. These installations were part of the NY-Sun program by New York State to incentivize
community and industry solar panel installation [21]. The NY-Sun program is part of the New York
Reforming the Energy Vision initiative, designed to reduce the state’s reliance on fossil-fuel-based
heat and electricity, increase energy efficiency in systems throughout the state, and reduce greenhouse
gas emissions [21]. The adoption of solar energy led to the Finger Lakes Wine Region being awarded
the Solar Champion Award by the Solar Energy Industries Association in 2015 [22].
Given the unique conditions available for viticulture and viniculture in New York and the lack
of previous LCAs on wines from the region, an LCA is needed to determine the carbon footprint
of wines from the Finger Lakes using data from existing wineries. We hypothesize that the carbon
footprint of Finger Lakes wines will be lower than that of wines from other regions due to the relatively
lower need for irrigation and cooling and the use of renewable energy. This study provides the first
carbon footprint analysis for wine produced in the Northeastern United States, and the Finger Lakes
region of New York State in particular. Three wineries located on the east and west shores of Seneca
Lake volunteered to provide data for this carbon footprint study of Finger Lakes wines. These three
wineries represent different production scales and practices and were thus assessed as three separate
LCA case studies.
2. Materials and Methods
2.1. Goal and Scope Definition
This goal of this study is to determine the cradle-to-gate greenhouse gas (GHG) emissions of
an average 0.75 L bottle of wine produced in the Finger Lakes region of New York through three case
studies representing data collected from three participating wineries located around Seneca Lake.
The wineries range in annual wine production volumes and are thus referred to as the Small, Medium,
and Large wineries to maintain anonymity. The results and recommendations of this study may be
utilized by the wineries themselves in order to internally adjust the processes of the wine production
life cycle in order to reduce their carbon footprint and for sustainable marketing for the companies.
In addition, these results have the potential to encourage the provision of additional incentives for
reducing GHG emissions in the New York State wine industry. The methodology outlined within this
study can set a precedent for future studies that can include a greater number of wineries in the Finger
Lakes area.
The scope of this study is cradle-to-gate, determining the environmental impacts of processes in
the winemaking life cycle from grape cultivation and harvest through bottling the produced wine.
This is consistent with previously published LCAs of wine (e.g., [7,8,23]), though some do include
the distribution and end-of-life phases of the life cycle (cradle-to-grave) (e.g., [1,2,11]). ExcludingSustainability 2019, 11, 2945 3 of 27
the distribution phase in wine LCAs eliminates the need to assume distribution trends, as these are
highly variable and dependent on the individual winery and individual consumers. Studies that
choose to include the distribution phase either have winery- or industry-specific distribution data or
must make assumptions. A cradle-to-grave scope also requires data or assumptions on end-of-life
management. Furthermore, most steps after bottling are often beyond the control of a winery, and thus
broadening the scope past bottling may not provide actionable information for a winery through
LCA results. Subsequently, a large number of published wine LCAs chose a cradle-to-gate scope for
their analyses instead of a cradle-to-grave scope, or provided results by life cycle process, which could
in turn be aggregated to the same scope and be used in a cradle-to-gate comparison [1–3,5,7–9,11,13,23].
In an LCA, all results are scaled to a functional unit, which is a quantitative component that
represents the function of the system or process being studied [24,25]. The functional unit for this
study is also the most commonly chosen for wine-related LCAs: one 0.75 L bottle of wine [1–13,23,26].
Setting the same functional unit as this precedent allows for comparisons to be made between this
study and the wine LCAs that have already been published.
2.2. Inventory Analysis and Impact Assessment
Data collection began with a site visit to each winery to discuss the life cycle of produced
wines with contacts who are employed by and who supervise the wineries. A draft of the methods
and numerical inputs was provided to these contacts in order to confirm that the models accurately
represent conditions at each winery. For this LCA of Finger Lakes wines, most of the life cycle
inventory (LCI) data was obtained from the Ecoinvent 3 and USLCI databases using SimaPro 8.2
software (Table A1). The GHG emissions of these LCIs were categorized using the Environmental
Protection Agency Tool for Reduction and Assessment of Chemicals and Other Environmental Impacts
(EPA TRACI) 2.0 life cycle impact assessment (LCIA) method and SimaPro 8.2 software. EPA TRACI is
a midpoint LCIA method, which complies with the ISO Standards for LCA practice for describing
environmental problems [24,25].
The values used for the life cycle GHG emissions of solar panel-generated electricity were
obtained from harmonized LCA results by US National Renewable Energy Laboratory researchers [27].
Additionally, the values used for the life cycle GHG emissions of gelatin were obtained from an LCA in
the scientific literature [28], due to the absence of a relevant inventory for gelatin in the databases
of the SimaPro 8.2 software package. In the systems of equations developed to model the life cycle
GHG emissions of wines from each winery in Python code, the impacts from database LCIs and these
two sources for gelatin and solar panel-generated electricity were scaled to the functional unit using
winery-specific data provided by each of the wineries. The systems of equations were designed to
calculate the life cycle GHG emissions of an average wine from each of the three wineries by each life
cycle process from grape cultivation through bottling and to allow for sensitivity analysis.
2.3. Interpretation
Baseline LCA results were analyzed by process and compared against the scientific literature
on the carbon footprint of wines. In addition to baseline LCA scenarios, a sensitivity analysis
was performed for each winery case study in order to identify the variable input parameters to
which the impacts are most sensitive and to subsequently provide suggestions for improvements
to each of the participating wineries. This was accomplished by changing one variable parameter
at a time to its minimum and maximum value, while keeping all other parameters at their baseline
values, thus isolating the effects of a change in a single parameter on the life cycle results.
Because the three case study wineries obtain all of their net electricity from on-site solar panels,
ranging from 28- to 151-kW capacity, which may differ from other Finger Lakes wineries not investigated
in this study, alternative baseline scenarios were investigated in which the wineries maintain the same
practices but obtain all of their electricity needs from the grid. The emissions associated with the current
electricity mix were obtained for the area using the Power Profiler tool developed by the United StatesSustainability 2019, 11, 2945 4 of 27
Environmental Protection Agency [29]. The baseline values for grid electricity impacts were based on
the baseline electricity consumption values provided by the three case study wineries and the carbon
emissions per energy unit reported for the region by the Power Profiler tool.
2.4. Assumptions and Limitations
The impacts associated with vine planting were not modeled in this LCA. It was assumed that
these GHG emissions scaled to one bottle of wine would be minimal due to the long lifetime of
the vines. For example, one LCA notes a lifespan of 30 to 70 years for each vine [5]. Vine planting
(which is different from cultivation practices that are performed every year) is frequently excluded in
wine LCAs; greenhouse gas emissions specifically allocated to vine planting were only calculated in
four studies among all published wine LCAs [2,8,10,23].
The amount of carbon dioxide emitted as a result of fermentation and the amount of carbon
dioxide fixed into the biomass of vines and fruit during photosynthesis prior to harvest are excluded
from this LCA, as it was assumed that these two quantities would be equivalent [23]. A precedent for
this assumption has been set in several wine LCAs [1,3–5,7,10,11,23,30]. The carbon dioxide emissions
and storage in the plants remaining on the land after harvest and in the soils are not quantified in this
LCA. Prior LCAs have also omitted this potential carbon storage due to lack of data available at this
scale [2].
There was limited database information available for the highly specific pesticide, fungicide,
and fertilizer data provided by the contacts at the three collaborating wineries. Therefore, proxy
data for pesticides and fungicides were selected where the level of detail from the wineries was
higher than could be achieved with the databases available. For fertilizers, pesticides, and fungicides,
the impacts were calculated based on the production of these compounds, and the impacts associated
with application (i.e., via sprayers) were not included due to data limitations.
Other wine LCAs either modeled a proxy compound, modeled only the transportation of
the compounds [8,10,13], or omitted the impacts of these compounds in cases where life cycle inventory
data availability was inadequate [2–5,7,11,23]. For example, Barry (2011) used Captan as a proxy to
represent all fungicides and insecticides used and glycosophate to represent all herbicides used [12].
Similarly, the impacts of yeast are often excluded from LCAs of wine [3–5,7,11,13,23] or only their
transportation was modeled [8,10]. However, for the purposes of this study, the value for fodder yeast
(which produces ethanol) found in the Ecoinvent 3 database was used as a proxy inventory impact for
yeast used during fermentation.
In addition, the impacts associated with the cork, cap, label, and other associated packaging in
the bottling phase of the life cycle are excluded from the scope of this study. This is based on a precedent
set by several other studies as it has been determined that the impacts from bottling originate primarily
from the production of the glass bottles [26]. The impacts of producing the glass bottle are included in
the three case studies.
The impacts associated with the production of infrastructure (such as winery buildings)
and machinery (such as the mechanical harvesters, tractors, and winemaking machines) were considered
outside of the scope based on the lifespan of these technologies. This is similar to the boundaries set
by several wine LCA studies, as this infrastructure was only included in two previous studies [7,23].
Still, the impacts of operating these items were included; only the production of their materials
and infrastructure were excluded.
The impacts related to the operation of specific on-site machinery associated with viticulture
were not collected from each winery. Therefore, the assumed diesel consumption for a mechanical
harvester of 30 L per hectare per growing season was modeled as part of the cultivation stage based
on the LCA of New Zealand wine by Barry (2011) [12]. This diesel consumption does not include
the fuel consumption of any other on-site cultivation machinery (i.e., sprayers, tractors). Because this
value reflects the diesel consumption for a mechanical harvester, it is only included in the calculations
which do not harvest by hand (the Medium and Large wineries).Sustainability 2019, 11, 2945 5 of 27
Though 80 percent of grapes are cultivated on-site for the Small winery, all viticulture information is
modeled based on the cultivation methods utilized by the Small winery. Therefore, the other 20 percent
of grapes imported to the Small winery are assumed to have been cultivated using the same methods,
as they are from neighboring farms and growers. While it was not taken into account for the purposes
of the assessment, the transportation of the grapes from the local vineyards would also contribute to
the life cycle impact of the harvest. For the Medium and Large wineries, 100 percent of the production
volume is based on grapes grown on-site.
The impacts associated with water use by the winemaking facilities were excluded from the analysis.
This includes any water used for irrigation, cleaning, and inputs into the tanks during winemaking.
These values were excluded due to the lack of data collected from the wineries and because these
wineries do not frequently irrigate. This is consistent with other LCA studies which also exclude
water as an input into the system at any point in the life cycle [4,5]. The impacts of tap water included
in the analysis for the Medium winery were solely used in the impact calculations for the fertilizer
compounds requiring water inputs for application.
In that only wineries that elected to participate in the study were considered, there could be
self-selection bias. For example, there is the chance the wineries that believed they followed sustainable
practices participated while those who did not believe this opted out, thus skewing the results away
from representing the entire region. One example of the potential differences between the three
wineries in this study and the entire Finger Lakes winemaking region is the use of solar panels for
electricity. Each of the three participating wineries produces more than enough net electricity from
their solar array to maintain their winemaking facilities and tasting rooms, with excess electricity being
fed back into the grid. Future studies including a larger number of wineries from the Finger Lakes
could alleviate this potential bias and provide results that more comprehensively represent the region
as a whole.
Although the information for this LCA originates from a small fraction of the wineries in the region,
the wide variation in production volumes (from 21,000 to 775,000 bottles annually) and techniques
utilized may approximate general practices in the Finger Lakes winemaking region. However, each
vineyard and winery approaches grape growing and winemaking differently, especially in terms of
crop management and wine additives, and so the LCA results will not generalize to all of the wineries
in the Finger Lakes. This analysis thus presents results by winery before discussing the potential
applicability across the region and comparison to the carbon footprint of other wines produced globally.
2.5. Study-Specific Methodology
The three wineries agreed to participate based on a condition of anonymity, and therefore they will
be referred to as Small, Medium, and Large for the remainder of this study. Each winery has different
methods for producing their wine, particularly in terms of the additives used, the amount and types of
fertilizers, pesticides, and fungicides applied to the grape crop, and the volume of wine produced each
year. Therefore, in order to provide context for the case studies and their calculated GHG emissions,
a detailed winemaking process is described for each of the wineries. Data was obtained on-site in
March 2018, and further email correspondence to finalize data collection and to confirm the modeled
values and processes continued through June 2018. The winery contacts confirmed the methods prior to
obtaining results from the authors. The calculated impacts are intended to represent average conditions
and production volumes, understanding that these impacts could vary significantly depending on
the harvest year [7].
2.5.1. Small Winery
The Small winery is the smallest of the three vineyards and wineries assessed in this study
by production volume. It is located on the east shore of Seneca Lake. This vineyard produces
approximately 6.73 Mg/ha of grapes every year, resulting in an annual production between 2200
and 3000 cases of wine (an average of about 21,000 bottles, as each case contains 12 bottles). This rangeSustainability 2019, 11, 2945 6 of 27
was estimated given the average yield of the vineyard and the area of vineyard cultivated, as well
as the mass of grapes required to make a single bottle of wine. The same methodology was used to
model the annual number of bottles produced from the area cultivated, mass harvested, and mass of
grapes per bottle for each winery.
Eighty percent of the grapes used for wine production are grown on-site, with the other 20%
brought in 2019,
Sustainability from11,three
x FORother
PEER REVIEW
local vineyards. At the Small winery, the lifetime of the vines 6 ofis27
approximately 30 years, and 100 to 200 vines require replanting each year, either due to age or winter
approximately
damage. 30 years,
Dry periods and 100
during to 200
critical vines stages
growth requirehavereplanting each year,
previously led toeither
0.81 hadueoftothis
agevineyard
or winter
damage.minimal
requiring Dry periods during
irrigation. The critical
watergrowth
used forstages haveispreviously
irrigation sourced from leda to 0.81 ha of
spring-fed this
well vineyard
connected
requiring minimal irrigation. The water used for irrigation is sourced
to a gravity-fed collection tank. A small pump is used in order to direct the flow of water across from a spring-fed well
connected
the to a gravity-fed
0.81 ha. Water for irrigationcollection tank. Aasmall
goes through mesh pumpscreenistoused
filterin order
out solidsto before
direct the
beingflow of water
spread on
across the 0.81 ha. Water for irrigation goes through a mesh screen to
the vineyard. As irrigation is only utilized during years of extreme drought, this does not represent filter out solids before being
spread
the averageon the
yearvineyard. As irrigation
of production is only
for the Small utilized
winery, andduring years
therefore thisofwater
extreme drought,
treatment andthis does not
provision
represent
falls outsidethe theaverage
scope ofyearthis of production for the Small winery, and therefore this water treatment
study.
andTheprovision
entirety of the electricityscope
falls outside the usedof bythis
thestudy.
winery and accompanying tasting room is provided by
The entirety of the electricity used by
the 28 kW solar array on site. Excess electricity generated the winery and by accompanying
the array is fed tasting
back to room is provided
the grid, and no
by the gas
natural 28 kW solar array
is utilized on The
on-site. site.amount
Excess electricity
of electricitygenerated
used by theby the
Small array is fed
winery back
was to in
used themodeling
grid, and
no impacts
the natural of gaselectricity
is utilizedgeneration;
on-site. The theamount of electricity
grid electricity used by the
displacement from Small winery
excess was used
production wasin
modeling
omitted fromthe theimpacts
analysis.ofDue electricity generation;
to limitations the grid electricity
in machine-specific data within displacement
the winery, the from excess
impacts
production was omitted from the analysis. Due to limitations in machine-specific
of electricity usage across multiple processes are derived from the total electricity usage of the facility data within the
winery, the impacts of electricity usage across multiple processes are derived
and scaled based on the number of bottles produced on an annual basis. Thus, the impacts of electricity from the total electricity
usage
use of the
are not facilityto
assigned and scaled based
individual on thebut
processes, number of bottles
are instead onlyproduced
included on in aan annual process
separate basis. Thus,
for
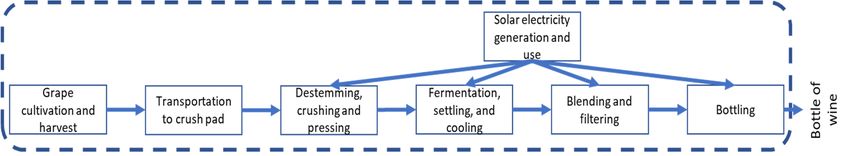
electricity provision (Figure 1). The impacts associated with the other processes do not includeincluded
the impacts of electricity use are not assigned to individual processes, but are instead only energy
in aHowever,
use. separatethey process for electricity
still include the GHGprovision
emissions(Figure 1). The
originating fromimpacts associated
the production with the other
and transportation
ofprocesses
inputs such do not include energy
as fertilizers, use. However,
fungicides, pesticides,they stillyeast,
gases, includeandthe GHG
glass emissions
bottles. originating
The same from
separation
the production and transportation of inputs
of energy use impacts applies to all three winery case studies. such as fertilizers, fungicides, pesticides, gases, yeast,
and glass bottles. The same separation of energy use impacts applies to all three winery case studies.
Figure1.1.System
Figure Systemdiagram
diagramofofcradle-to-gate
cradle-to-gateprocesses
processesmodeled
modeledfor
forthe
theSmall
Smalland
andMedium
Mediumwineries.
wineries.
Approximately
Approximately80% 80% of wines
of wines produced
producedat theatSmall winery
the Small are white
winery are wines,
white with
wines,over 50 percent
with over 50
ofpercent
production exclusively
of production comprised
exclusively of Riesling.
comprised This study
of Riesling. Thisexplores the general
study explores life cyclelife
the general of cycle
winesof
produced at this location and therefore, with this ratio of white wine to red wine
wines produced at this location and therefore, with this ratio of white wine to red wine production, production, the aging
process
the agingmainly
process associated
mainly with red wines
associated withisred
notwines
considered. The full production
is not considered. volume of wine
The full production volumewasof
modeled
wine was using
modeled only the
usingwhite
onlywine processes
the white wine(Figure 1). (Figure 1).
processes
The
Themodeling
modeling of of the cultivation step
the cultivation step for
forthe
thegrapes
grapesproduced
produced on-site
on-site includes
includes thethe amount
amount and
and frequency
frequency of fertilizer,
of fertilizer, pesticide,
pesticide, andand fungicide
fungicide application.
application. The pesticide
The pesticide used used
is theisbiologic
the biologic
DiPel,
DiPel,
whichwhich is targeted
is targeted to combat
to combat grape grape berryinfestations
berry moth moth infestations and is applied
and is applied two totimes
two to three threeover
times
the
over
coursethe of
course
the of the growing
growing seasonseason (Valent
(Valent BioSciences,
BioSciences, LLC.,LLC., Dublin,
Dublin, CA,CA, USA).
USA). A A wide
wide varietyof
variety
offungicides
fungicidesare areused
usedby bythe
theSmall
Small winery,
winery, in in order to combat
combat powdery
powdery mildew,
mildew, downy
downy mildew,
mildew,
Botrytis cinerea, black rot, and Phomopsis.
Botrytis cinerea, black rot, and Phomopsis. These are each applied at varying rates that depend onon
These are each applied at varying rates that depend the
the labeled
labeled rates
rates of of
thethe targeted
targeted compound,
compound, as as
wellwell
as as
thethe amount
amount of of rainfall
rainfall overover
thethe course
course of of
the
the growing
growing season
season (May (May to September).
to September). DuringDuring
yearsyears of heavy
of heavy precipitation,
precipitation, the fungicides
the fungicides are
are applied
applied as frequently
as frequently as every as10every
days,10while
days, during
while during drier seasons,
drier seasons, they
they are are applied
applied more infrequently
more infrequently (every
(every 21 days).
21 days). This results
This results in a of
in a range range of applications
applications from
from four tofour
nineto nineper
times times perbased
year, year, on
based on
rainfall.
The average of the minimum and maximum was chosen as the baseline value for the number of
fungicide applications per year.
The fertilizers used by the winery include Timothy hay provided from a neighboring farmer
(less than 2 km away) and composted pomace accumulated during crushing and destemming of
cultivated grapes. The Timothy hay also provides a mulching benefit for the crop, although theSustainability 2019, 11, 2945 7 of 27
rainfall. The average of the minimum and maximum was chosen as the baseline value for the number
of fungicide applications per year.
The fertilizers used by the winery include Timothy hay provided from a neighboring farmer
(less than 2 km away) and composted pomace accumulated during crushing and destemming
of cultivated grapes. The Timothy hay also provides a mulching benefit for the crop, although
the carbon emissions associated with its decomposition in the field are not included in the model.
Only the greenhouse gas emissions associated with its production are considered. Due to the wide
variety of compounds used as fungicides, many of which are bacteria-based biological controls,
and the use of DiPel biological control as a pesticide, this study utilized the life cycle inventory
in the Ecoinvent 3 database for unspecified pesticides to calculate the impacts associated with
the production of both fungicides and pesticides used at the Small winery. Further iterations of this
study could use more specific inventory data if it becomes available in the future.
After cultivation, the grapes are harvested by hand, with the assistance of a small tractor for
collection. The tractor utilizes a biodiesel blend called B20 Diesel. Due to limitations in database
information regarding this particular blend of diesel fuel, this was not specifically modeled for this
study, though future studies could model the use of different biodiesel blends. This tractor brings
the grapes to the crush pad, where the grapes, skins, and stems are crushed before being pressed.
Pressings are transported to a compost container on-site, and the composted material is used as fertilizer
during the following growing season. The juice is fermented in 3785-L (1000-gallon) stainless steel
tanks through the addition of yeast, enzymes, sulfites, and diammonium phosphate compounds to
assist with the production of alcohol within the juice. The masses of these additives were obtained
directly from the Small winery (Table 1). No additional sugar was added in the winemaking process.
Following fermentation, the yeast and other solids are settled out of the wine liquid, and these lees are
collected, composted on-site, and spread on the vineyard as additional fertilizer.
Table 1. Variable parameter values modeled for stages in the life cycle of a bottle of wine
at the Small winery.
Variable Parameter Minimum Baseline Maximum Units
Mass of fungicide 2.699 3.175 3.651 kg year−1
Mass of pesticide 1.361 4.309 7.257 kg year−1
Number of fungicide applications 4 6.5 9 unitless
Number of pesticide applications 2 2.5 3 unitless
Mass of hay 21,591 25,401 29,211 kg year−1
Area of vineyard 2.43 2.83 3.24 ha
Mass of harvest 5716 6725 7734 kg ha−1 year−1
Mass of grape per bottle 0.964 1.134 1.304 kg bottle−1
Distance to crush pad 0.155 0.183 0.210 km
Distance to compost bin 0.233 0.274 0.316 km
Fraction of pomace 0.0255 0.0300 0.0345 unitless
Mass of propylene glycol 62.12 73.08 84.04 kg year−1
Mass of yeast 4.356 5.125 5.894 kg year−1
Mass of Argon gas 89.87 105.73 121.59 kg year−1
Number of filters 233.75 275.00 316.25 filters year−1
Mass of empty bottle 0.440 0.445 0.450 kg bottle−1
Distance to bottling facility 2.05 2.41 2.78 km
Distance transportation of bottle 45.35 47.91 50.48 km
Electricity usage by winery 22,193 26,109 28,233 kWh year−1
Impact of electricity from solar panels 0.026 0.045 0.183 kg CO2eq kWh−1
Impact of electricity from grid (NY) 0.148 0.174 0.200 kg CO2eq kWh−1
In order to stabilize and further settle out solids within the wine, approximately 75.7 L of
propylene glycol are pumped through an on-site chiller to quickly cool down the wine (Table 1).
This propylene glycol is also the primary means for temperature control over the course of the life cycleSustainability 2019, 11, 2945 8 of 27
of the wine and is first used to remove heat produced by the yeast during fermentation. In order to keep
fermentation tanks warm following harvests that occur late in the season, electric heat belts are placed
around the tanks, which allow for easy temperature control. Once the wines have been completed,
they are blended together to produce the preferred flavors. The wine is then pumped through
a plate-and-frame filtering machine, utilizing cellulose pads with decreasing pore size. About 275 filter
pads are used by the Small winery each year (Table 1). Each batch of wine is filtered twice before being
pumped into small tanks, which are then transported by truck to an off-site bottling facility in small
batches. These tanks are transported by pickup truck to the bottling facility.
In previous years, the bottling facility was located approximately 2.41 km away from the Small
winery (Table 1). The bottles utilized by this facility are from the “eco-glass” lines of products supplied
by a company based in Waterloo, New York. This line is designed to be slightly lighter than conventional
glass bottles. Approximately 26 canisters (approximately 2.41 m3 each) of argon are used as an inert
gas to displace air within the bottle in order to preserve the taste and quality of the wine (Table 1).
The bottling phase includes the application of the label, which for the purposes of this study has been
assumed to be negligible over the life cycle of the wine, as has the production of the cork. Once bottling
has been completed, the bottles are packaged, and 30 percent are transported to Clay, New York for
storage before distribution. The rest of the wines are either distributed locally or through the tasting
room on-site. The distribution of wines is outside the defined cradle-to-gate scope of this study.
2.5.2. Medium Winery
The Medium winery is a medium-sized vineyard and winery on the west shore of Seneca Lake.
This vineyard produces 4.48 to 11.2 Mg/ha of grapes every year, resulting in an annual production
between 68,000 and 190,000 bottles of wine (approximately 5600 to 15,800 cases of 12 bottles).
Considering that the assumed lifetime of the vines at the Medium winery is 15 to 20 years, replanting is
not considered for the purposes of this analysis, though it should be noted that around three to four
percent of vines need to be replanted each year due to losses from winter damage and age.
Due to its location, there is no irrigation requirement for the vineyard during the growing
season, which falls between May (bud break) and November (when senescence occurs in the leaves).
This means that the water required for maintaining the health of the grapevines is regularly provided
by rainfall. During years with less precipitation, the reduced water availability presents a challenge to
vine growth and health, often leading to smaller harvests. Despite this, additional irrigation would
not be reasonable to undertake at the Medium winery due to the infrequency of drought-stress years
(once every four to five years). Additionally, due to the slope of the land on which the vineyard is
located, necessary drainage is minimal. There is a rudimentary drain tile system installed, though
there remain some vineyard blocks where water is held in the soils in periods of high precipitation,
due mainly to the heterogeneity of the soil in the region. The impact of this drainage system is assumed
to be negligible over the course of the wine life cycle.
The operations of the winery and the adjacent tasting room are facilitated entirely through
the electricity generated by the 151 kW solar array on-site. Due to limitations in machine-specific data
within the winery, the impacts of electricity usage for the life cycle of a bottle of wine is represented by
the electricity used by the winery as a whole and is scaled to the functional unit based on the number
of bottles produced on an annual basis.
Overall, approximately 65 to 70 percent of the wine produced at the Medium winery is white
wine, which is more commonly produced than red wines in colder climates like the Finger Lakes.
The differences in impacts between the two types of wine are assumed to come mainly from the impacts
of the barrel in which aging occurs. The other differences are primarily in order of processes (i.e., red
wine grapes ferment with the skins before being pressed, while white wine grapes are pressed before
fermentation). For the purposes of this study, therefore, it is assumed that the full production volume
is appropriately represented by the white wine processes (Figure 1).Sustainability 2019, 11, 2945 9 of 27
The modeling of the cultivation step for the wine grapes includes the amount and frequency
of fertilizer, pesticide, and fungicide application. For this winery, these compounds are applied
according to the labeled recommended rate for each, and not exceeding the maximum recommended
application. For each compound used by the Medium winery, the application rates were obtained from
the specifications available on the companies’ websites (Loveland Products, Inc., Loveland, CO, USA;
Valent BioSciences, LLC., Dublin, CA, USA; Syngenta International AG, Basel, Switzerland; and Arysta
LifeScience Corporation, Cary, NC, USA). For a majority of the compounds used, the labeled rates
were described as a range of values, and thus this range provided the maximum and minimum
values modeled for each of the application rates (Table 2). The baseline values for those compounds
were assumed to be the average of the maximum and minimum values. For those compounds that
only provided a baseline application, a range of plus or minus 15 percent was assumed, unless
a maximum seasonal application was provided, which also determined the number of applications if
present. The compounds with maximum seasonal application rates are Sniper (0.468 L/ha), Danitol
(0.673 kg ai./ha), Captan (16.8 kg/ha), and Roper (26.9 kg/ha).
Table 2. Application rates of compounds associated with grape growing at the Medium winery.
Compound Compound Type Minimum Baseline Maximum Units
Sniper (Loveland Products, Inc., Loveland, CO, USA) Pesticide 0.22 0.35 0.44 kg ha−1
Danitol (Valent BioSciences, LLC., Dublin, CA, USA) Pesticide 0.12 0.17 0.25 kg ha−1
Captan (Arysta LifeScience Corp., Cary, NC, USA) Fungicide 2.37 2.79 3.21 kg ha−1
Revus Top (Syngenta International AG, Basel, Switzerland) Fungicide 0.12 0.15 0.17 kg ha−1
Rampart (Loveland Products, Inc., Loveland, CO, USA) Fungicide 3.39 6.77 10.18 kg ha−1
Roper (Loveland Products, Inc., Loveland, CO, USA) Fungicide 1.68 3.09 4.47 kg ha−1
At the Medium winery, the Captan fungicide is applied approximately eight times per year,
which was then assumed to be the number of applications for any compound without a maximum
seasonal application rate. In calculating the inventory impacts of the fertilizers used by the Medium
winery (Table 3), the individual chemical components for each compound were identified from
the Material Safety Data Sheet (MSDS) and label. Each fertilizer’s composition is presented as a range
of percentages for the ingredients. Borosol is comprised of 45 to 60 percent boric acid, 15 to 30 percent
monoethanolamine, and 15 to 25 percent water, while Lokomotive is 40 to 70 percent water, four to
six percent urea, and six to eight percent potassium acetate (“Loveland Products|Get Growing,” 2018).
The GHG emissions of these composites were calculated based on these ranges of percentages, as well
as the LCI values for these compounds (Table 3). For example, the maximum inventory value for
the impact of Borosol is based on a composition of 30 percent monoethanolamine, 15 percent water,
and 55 percent boric acid. The composition for potassium acetate in Lokomotive was determined
from a study which reports that potassium acetate is derived from 50 percent potassium hydroxide
and 50 percent acetic acid [31].
After cultivation, the grapes are harvested by machine and transported 0.161 to 0.402 km into
the winemaking facility, where they are crushed, destemmed, and pressed (Table 3). The waste stems,
skins, and seeds (also known as pomace), which account for 10 to 12 percent of the mass of grapes
harvested, are then transported 0.20 km by truck to a nearby field (Table 3), where they are spread on
the ground and subsequently decompose. The separated juice is then pumped into several sizes of
stainless-steel tanks to ferment.
The juice is fermented for a short time after the addition of yeast. Once the juice has reached
the desired sugar content, white wines are either fermented to dryness or rapidly cooled. Those white
wine styles which are fermented to complete dryness do not require cooling, as the yeast has no substrate
on which to survive and therefore stops production. Cooling is required for the styles which contain
residual sugars as the sudden drop in temperature halts further fermentation. Once fermentation is
completed, the dead yeast and other solids, known collectively as the gross lees, settle out. The cloudy
wine is then racked (separated) from the gross lees into new tanks, and the lees are discarded. Following
the racking of gross lees, the wine is fined with bentonite and seeded with cream of tartar (at the ratesSustainability 2019, 11, 2945 10 of 27
in Table 3), in order to further settle out solids and to prevent the creation of crystals in finished wines.
Each batch of wine is cooled in large stainless-steel tanks in order to stabilize.
Table 3. Variable parameter values modeled for the life cycle assessment (LCA) case study of a bottle
of wine from the Medium winery.
Variable Parameter Minimum Baseline Maximum Units
Number of pesticide applications 1 2 2 unitless
Number of fertilizer applications 6 7 8 unitless
Number of fungicide applications 2 5 8 unitless
Mass of pesticide 0.346 0.519 0.692 kg ha−1
Mass of fungicide 7.59 12.82 18.06 kg ha−1
Application rate of Borosol 4.67 8.18 11.69 L ha−1
Application rate of Lokomotive 4.67 11.69 18.71 L ha−1
Calculated impact of Lokomotive 0.908 1.089 1.264 kg CO2eq kg−1
Calculated impact of Borosol 0.260 0.314 0.369 kg CO2eq kg−1
Area of vineyard 18.2 19.2 20.2 ha
Mass of harvest 4483 7846 11,208 kg ha−1 year−1
Mass of grape per bottle 0.91 1.20 1.36 kg bottle−1
Distance to crush pad 0.16 0.28 0.40 km
Distance to field 0.18 0.20 0.23 km
Fraction of pomace 0.10 0.11 0.12 unitless
Mass of bentonite 38.56 45.36 52.16 kg year−1
Mass of propylene glycol 88.4 104.0 119.6 kg year−1
Mass of sugar 3856 4536 5216 kg year−1
Mass of yeast 0.00016 0.00019 0.00022 kg bottle−1
Mass of nitrogen gas 908 1044 1200 kg year−1
Mass of CO2 gas 1346 1514 1682 kg year−1
Number of filters 1700 2000 2300 filters year−1
Mass of empty bottle 0.49 0.50 0.51 kg bottle−1
Distance to transport empty bottle 337 1320 4200 km
Electricity usage by winery 133,950 141,000 148,050 kWh year−1
Impact of electricity from solar 0.026 0.045 0.183 kg CO2eq kWh−1
Impact of electricity from grid (NY) 0.148 0.174 0.200 kg CO2eq kWh−1
In the years during which winter temperatures are sufficiently low, wine is pumped to several
tanks located outside in order to complete stabilization, thus reducing the overall electricity demand
of the winery. When the temperatures are not appropriate for stabilization outdoors, and for wines
that are prepared exclusively indoors, between 85 and 115 L of propylene glycol (Table 3) is pumped
around the surface of the tanks for several days, after which the waste solids (including potassium
bitartrate, the product resulting from the addition of cream of tartar) settle out, remaining in the tanks
when the liquid is pumped to new tanks. This same propylene glycol is also used earlier in the life
cycle for refrigeration, in order to clarify the wine and to prevent the reproduction of microbes that
naturally occurs on grapes, as well as to halt fermentation in wines with residual sugars. The pumps
operate on a closed loop, so the volume of propylene glycol remains constant throughout the life
cycle of the winery. The settled waste is disposed of into the winery’s septic system, though some of
the waste yeast is used in the personal compost of the winemaker.
Once the wines have been completed, they can be blended together to produce the preferred
styles. Rarely, sugar is added during this step to assist in the balancing of flavor, though this is not
the case for all styles. A minimum of 100 (8.5 m3 at standard temperature and pressure) canisters of
nitrogen gas per year are introduced into the tanks during this step to roll and mix the wine (Table 3).
Further filtering is then accomplished using a plate-and-frame filtering machine, and each of the three
filtering phases increases in granularity in order to remove any remaining solids, resulting in a clear
wine ready for bottling. Over the course of a single production year, about 2000 filter sheets are used,
totaling approximately 0.008 filter sheets per bottle (Table 3). The Medium winery utilizes BECO SterilSustainability 2019, 11, 2945 11 of 27
40 filter sheets, which amount to approximately 0.215 kg of cellulose fiber per sheet (“BECO® Standard
Range,” 2018).
The bottling is also performed on-site with glass bottles with an average mass of 500 g shipped
in from Mexico, Pennsylvania, Illinois, and Europe. For the purposes of this study, the distance that
bottles are transported were limited to those produced in North America, as 85 to 90 percent of bottles
used by the Medium winery are from facilities in North America, and therefore these distances are
more representative of an average bottle of wine produced by the Medium winery. Bottling occurs
approximately 40 to 50 days over the course of the year. Between 80 and 100 (8.5 m3 ) canisters of
carbon dioxide per production year are used as an inert gas to displace the air within the bottle
and to keep air from being introduced as the wine travels between the tanks during the blending
stage (Table 3). The bottling phase includes the application of the label, which for the purpose of
this study has been assumed to comprise a negligible impact over the life cycle of the wine, as has
the production of the cork. Once bottling has been completed, the bottles are packaged and either sold
through the tasting room or distributed elsewhere. The distribution of wines is outside the defined
cradle-to-gate scope of this study.
2.5.3. Large Winery
The Large winery is a vineyard and winery with a relatively high production volume on the east
Sustainability
shore 2019, 11,
of Seneca x FOR
Lake. PEER
This REVIEW produces 6.73 to 17.9 Mg/ha of grapes annually, depending
vineyard 11 ofon27
the variety, resulting in an annual production between 291,000 and 775,000 bottles of wine. This vineyard
the variety,anresulting
experiences approximatein anloss
annual
of 8%production
of vines eachbetween
year due 291,000 anddamage,
to winter 775,000but
bottles of replanting
annual wine. This
vineyard experiences an approximate loss of 8% of
requirements are not included in the overall carbon footprint. vines each year due to winter damage, but annual
replanting
Due torequirements
its location and are the
not slope
included in the
of the overall land,
vineyard carbon footprint.
there is no irrigation requirement for
the Large winery during the growing season (May to October). is
Due to its location and the slope of the vineyard land, there no irrigation
Indeed, requirement
removing for the
excess water is
Large winery during the growing season (May to October). Indeed, removing excess
a more pressing need. To accomplish this, the Large winery utilizes a pattern tiling drainage system water is a more
pressing need. To accomplish this, the Large winery utilizes a pattern tiling drainage system with
with approximately 750 m of 15.2 cm corrugated run tile per hectare. The associated GHG emissions of
approximately
these 750 m of
tiles are included in 15.2 cm corrugated
the grape cultivationrun tile of
phase perthehectare.
wine lifeThe associated GHG emissions of
cycle.
these tiles are included in the grape cultivation phase of the wine life cycle.
The operations of the winery and the on-site tasting room are facilitated entirely through
The operations of the winery and the on-site tasting room are facilitated entirely through the
the electricity generated by the facility’s 93 kW solar array, with the exception of the heating required
electricity generated by the facility’s 93 kW solar array, with the exception of the heating required for
for wine storage as well as the fuel for on-site vehicles, which are provided by two propane tanks.
wine storage as well as the fuel for on-site vehicles, which are provided by two propane tanks. Excess
Excess electricity generated by the solar panels that is not used by the winery is fed back into the grid.
electricity generated by the solar panels that is not used by the winery is fed back into the grid. The
The same method was also utilized to calculate the impacts from electricity for the other two case studies.
same method was also utilized to calculate the impacts from electricity for the other two case studies.
The wine production at the Large winery is 70% white (primarily Riesling and Chardonnay),
The wine production at the Large winery is 70% white (primarily Riesling and Chardonnay),
and therefore this study focuses on the general production steps associated with white wine
and therefore this study focuses on the general production steps associated with white wine as
as representative of the winery’s total production (Figure 2).
representative of the winery’s total production (Figure 2).
Figure2.2.System
Figure Systemdiagram
diagramof
ofcradle-to-gate
cradle-to-gateprocesses
processesmodeled
modeledfor
forthe
theLarge
Largewinery.
winery.
For those
For those variable parameters
parameters for
for which
whichonly
onlybaseline values
baseline were
values provided,
were minimum
provided, minimumand
maximum values were assumed to be plus or minus 15% of the baseline value. For those
and maximum values were assumed to be plus or minus 15% of the baseline value. For those variables
for which a range was given, the baseline value was assumed to be the average of the two values
(Table 4). The modeled ranges were then verified by the winery contact.
Table 4. Variable parameter values modeled for stages in the life cycle of a bottle of wine at the Large
winery.Sustainability 2019, 11, 2945 12 of 27
variables for which a range was given, the baseline value was assumed to be the average of the two
values (Table 4). The modeled ranges were then verified by the winery contact.
Table 4. Variable parameter values modeled for stages in the life cycle of a bottle of wine
at the Large winery.
Variable Parameter Minimum Baseline Maximum Units
Mass of sulfur (fungicide) 1166 1372 1578 kg year−1
Mass of hay 129,546 152,407 175,269 kg year−1
Area of vineyard 41.3 48.6 49.0 ha
Lifetime of pattern tile 50 75 100 years
Mass of harvest 6725 12,329 17,934 kg ha−1 year−1
Mass of grape per bottle 0.9550 1.1235 1.2920 kg bottle−1
Distance to crush pad 1.163 1.368 1.573 km
Distance to compost bin 0.181 0.213 0.245 km
Fraction of pomace 0.1751 0.2060 0.2369 unitless
Mass of yeast 11.57 13.61 15.65 kg year−1
Mass of gelatin 0.000064 0.000075 0.000086 kg bottle−1
Number of filters 47.6 56 64.4 filters year−1
Mass of empty bottle 0.425 0.445 0.475 kg bottle−1
Distance to transport empty bottle 41.04 41.68 45.38 km
Mass of propane 24,463 28,780 33,097 kg year−1
Electricity usage by winery 110,466 129,960 149,454 kWh year−1
Impact of electricity from solar panels 0.026 0.045 0.183 kg CO2eq kWh−1
Impact of electricity from grid (NY) 0.1480 0.1741 0.2002 kg CO2eq kWh−1
The modeling of the cultivation step for the wine grapes includes the amount and frequency of
fertilizer, pesticide, and fungicide application. The fertilizers used at this winery include Timothy hay,
which is applied at an amount of 3.14 Mg/ha on a case-by-case basis to account for nitrogen deficiencies
in the soil, as well as compost produced on-site. The Large winery utilizes a sulfur spray as a fungicidal
treatment ten times per growing season (approximately once every 14 days) (Table 4). As for pesticides,
there are no preventative sprays or compounds introduced for the entirety of the crop, as outbreaks are
handled on a case-by-case basis (and often solely vine-by-vine).
Once the grapes reach optimal ripeness, they are harvested from the vine. Ninety-five percent
of harvesting is done by machine, and the other five percent is performed by hand. These grapes
are brought to the crush pad and presses where approximately 17.5 to 24 percent of the harvested
mass is removed in the stems and skins (Table 4). The waste skins and stems (as well as other
lees produced through the winemaking life cycle) are then transported by forklift to a composter
on-site. The produced compost is used as fertilizer on-site for future harvests. The juice from pressing
is pumped into the 5678 L stainless-steel tanks. The juice is inoculated with yeast to assist with
fermentation, though some varietals are left to spontaneously ferment. Fermentation proceeds until
the yeast dies, as the Large winery specializes in producing dry wines. Additionally, due to this
preference, no additional sugar or sweeteners are added during the winemaking process.
In order to remove the solids from the juice, 500 g of gelatin are added to each 5678-L stainless-steel
tank to act as a flocculant, and nitrogen gas is injected into the juice to keep air from accumulating
as well as to assist in settling out the solids. Once settled out, the lees are racked and added to
the compost pile. The wines are then blended to achieve the desired flavor profiles, with argon gas
displacing the air within the tanks.
The Large winery utilizes approximately 29 canisters of argon and nitrogen, which each contain
approximately 8.5 m3 of gas, per production year (Table 4). Once the wines have been blended, they
are brought down to the proper temperature while still in the stainless-steel tanks. These tanks are
cold stabilized all together in one room through ambient temperature controls powered by electricity.Sustainability 2019, 11, 2945 13 of 27
Once cooled, the wines are run twice through a plate-and-frame filtering machine, which uses cellulose
pads at 0.4 to 0.5 micron fine pores.
Bottling is also completed on-site, using bottles from the same bottle manufacturer located in
Waterloo, New York as the Small winery. For different types of wine, the bottles are various shapes
(all containing 0.75 L of wine), thus the mass of an empty glass bottle used by the Large winery
ranges from 425 to 475 g (Table 4). This is consistent with the values reported by other studies
which state the masses of their bottles [3–5,7,10,23]. The bottling phase was calculated in the same
way as for the other two case studies, excluding the production and application of the cork, label,
and other packaging components, but including the impacts of producing and transporting the bottle
to the winery. Additionally, the distribution of wines is outside the defined cradle-to-gate scope of
this study.
2.6. Main Differences between Case Studies
While each of these wineries have very distinct production methods, there are key aspects of
the winemaking process for each that can be considered as major differences in the carbon footprint
calculation model (Table 5). These aspects include the production volume (in terms of the number
of 0.75 L bottles produced annually), the size (and subsequently, electricity generation) of the on-site
solar array, the compounds used as fertilizers, pesticides, and fungicides, waste management (in terms
of treatment of pomace), the source of glass packaging bottles and location of bottling, as well
as the proportion of production volume based entirely on on-site grapes.
Table 5. Major differences in production methods modeled between the three case study wineries.
Characteristic Small Winery Medium Winery Large Winery
Annual wine production volume Approximately 21,000 bottles year−1 68,000 to 190,000 bottles year−1 291,000 to 775,000 bottles year−1
Capacity of on-site solar array 28 kW 151 kW 93 kW
Fertilizers used Timothy hay; compost Borosol; Lokomotive Timothy hay; compost
Fungicide and pesticide life cycle “Undefined” pesticides to capture
Captan Sulfur
inventories used in the model general pesticides
Deposited on nearby field
Pomace management Composted on-site Composted on-site
(~0.2 km away)
Various locations
Source of bottles Local manufacturer Local manufacturer
(337 to 4200 km from winery)
Off-site facility (approximately 2.41 km
Bottling location On-site On-site
from winery)
On-site grape production 100% of production from 100% of production from
80% of production from on-site grapes
for wines on-site grapes onsite grapes
3. Results and Discussion
3.1. Baseline Results by Finger Lakes Case Study
The life cycle GHG emissions of each process in the cradle-to-gate production of a bottle of wine
and the total carbon footprint result were calculated for each of the three Finger Lakes wineries.
For the Small winery, the life cycle GHG emissions of an average bottle of wine were 1.03 kg
CO2eq bottle−1 . The highest impacts were associated with cultivation, which provides 46% of the total
life cycle GHG emissions, and with bottling, which provides 45% of the total life cycle GHG emissions
(Figure 3). The impacts associated with the cultivation process are due almost entirely (97%) to the high
mass of Timothy hay applied per hectare over the course of a growing season.
The bottling process includes the transportation of the wine to the bottling facility
and the production of the glass bottles. This does not include the impact of the electricity used
for bottling, as the impact from electricity use was calculated separately for the entire winery instead
of separated by process. The Small winery is the only one of the three case study wineries that bottles
off-site, and therefore the impacts of bottling included the transportation of the bottle from the bottling
manufacturer as well as the transportation of the wine to the bottling facility. Despite this additional
transportation impact, the impacts associated with the production of the glass bottle represents over
99.5% of the GHG emissions contributed by the bottling process.You can also read