Can the Carbon Emissions Trading System Improve the Green Total Factor Productivity of the Pilot Cities?-A Spatial Difference-in-Differences ...
←
→
Page content transcription
If your browser does not render page correctly, please read the page content below

International Journal of
               Environmental Research
               and Public Health

Article
Can the Carbon Emissions Trading System Improve the Green
Total Factor Productivity of the Pilot Cities?—A Spatial
Difference-in-Differences Econometric Analysis in China
Dawei Huang 1,2 and Gang Chen 2, *

                                          1   School of Management, Shenzhen Polytechnic, Shenzhen 518055, China; hdw@szpt.edu.cn
                                          2   School of Economics and Management, Harbin Institute of Technology (Shenzhen), Shenzhen 518055, China
                                          *   Correspondence: 13b956005@stu.hit.edu.cn; Tel.: +86-158-1553-5026

                                          Abstract: The carbon emission trading system (CETS) is an important market-oriented policy tool for
                                          the Chinese government to solve the problem of high emissions and achieve the growth of green total
                                          factor productivity (GTFP). This study makes up for the neglect of the spatial effect of CETS policy in
                                          previous studies and adopts the spatial difference-in-differences (DID) Durbin model (SDID-SDM)
                                          method of two-way fixed effects to scientifically identify the direct and spatial effects influencing
                                          the mechanisms and heterogeneity of CETS on urban GTFP based on the panel data of 281 cities
                                          in China from 2004 to 2017. It found that China’s CETS significantly improved the GTFP of pilot
                                          cities but produced a negative spatial siphon effect that restricted the growth of GTFP in surrounding
                                          cities. Benchmark results are robust under the placebo test, the propensity score matching SDID
                                          (PSM-SDID) test, and the difference-in difference-in-differences (DDD) test. The mechanism analysis

                                   shows that the CETS effect is mainly realized by improving energy efficiency, promoting low-carbon
Citation: Huang, D.; Chen, G. Can
                                          innovation, adjusting the industrial structure, and enhancing financial agglomeration. In addition,
the Carbon Emissions Trading              we find that policy effects are better in cities with high marketization, strong monitoring reporting
System Improve the Green Total            and verification (MRV) capabilities, high coal endowment, and high financial endowment. Overall,
Factor Productivity of the Pilot          China’s CETS policy achieves the goal of enhancing GTFP but needs to pay attention to the spatial
Cities?—A Spatial Difference-             siphon effect. In addition, our estimation strategy can serve as a scientific reference for similar studies
in-Differences Econometric Analysis       in other developing countries.
in China. Int. J. Environ. Res. Public
Health 2022, 19, 1209. https://           Keywords: carbon emissions trading system; green total factor productivity; pilot cities; spatial
doi.org/10.3390/ijerph19031209            difference-in-differences; difference-in difference-in-differences; energy efficiency; low-carbon inno-
Academic Editors: Kevin W. Li,            vation; industrial structure; spatial siphon effect; financial agglomeration; MRV capability
Zhi Liu and Xuemei Li

Received: 3 December 2021
Accepted: 19 January 2022
                                          1. Introduction
Published: 22 January 2022
                                               The climate problem is one of the most serious problems faced by mankind in the 21st
Publisher’s Note: MDPI stays neutral
                                          century [1–3]. Existing studies have also confirmed that global temperature rise is closely
with regard to jurisdictional claims in
                                          related to greenhouse gas emissions [4], while carbon dioxide accounts for 84% of green-
published maps and institutional affil-
                                          house gas emissions; it means that reducing carbon dioxide emissions is the key to solving
iations.
                                          the problem of climate deterioration [5,6]. Therefore, in response to the global climate crisis,
                                          countries around the world have taken the initiative to put “carbon peak” (many advanced
                                          economies have achieved “carbon peak”) and “carbon neutrality” on the agenda. As a
Copyright: © 2022 by the authors.
                                          major carbon emitter in recent years, China also pledged at the United Nations Climate
Licensee MDPI, Basel, Switzerland.        Conference to strive to reach the peak before 2030 and to strive to achieve carbon neutrality
This article is an open access article    by 2060 [7,8]. More and more studies have shown that the carbon emission trading system
distributed under the terms and           (CETS) plays an important role in reducing carbon dioxide emissions; for example, the
conditions of the Creative Commons        United States Regional Greenhouse Emission Reduction Initiative (RGGI) [9,10], the Euro-
Attribution (CC BY) license (https://     pean Union’s Carbon Emissions Trading System [11,12], South Korea’s 2015 “Greenhouse
creativecommons.org/licenses/by/          Gas Emission Allowance Allocation and Trading Act” [13] are important measures for
4.0/).                                    advanced economies to achieve emission reduction targets, which are generally considered

Int. J. Environ. Res. Public Health 2022, 19, 1209. https://doi.org/10.3390/ijerph19031209                    https://www.mdpi.com/journal/ijerph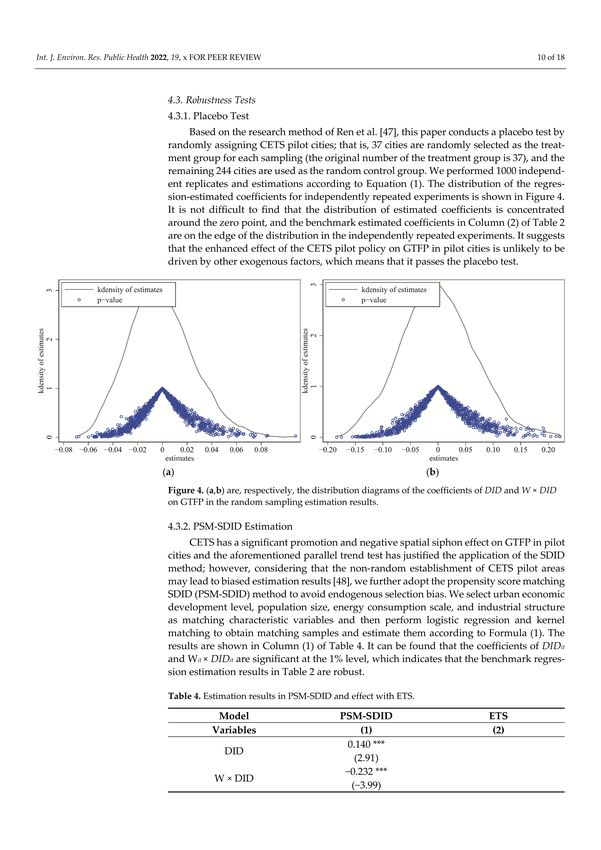
Int. J. Environ. Res. Public Health 2022, 19, 1209                                                                                   2 of 18

                                        to be effective [14]. To cope with the severe greenhouse gas emission problem, in 2011,
                                        China officially approved the launch of carbon trading pilot projects in Beijing, Tianjin,
                                        Shanghai, Chongqing, Hubei, Guangdong, and Shenzhen, and in 2013–2014, the pilot
                                        areas successively launched carbon trading markets, accumulating experience for the con-
                                        struction of carbon markets in developing countries [15,16]. Domestic and foreign studies
                                        have shown that the carbon market is an effective policy tool to achieve specific emission
                                        reduction targets at a lower cost. Compared with traditional administrative management
                                        methods, it can not only transfer the responsibility of greenhouse gas emissions to enter-
                                        prises but also provides corresponding economic incentives for carbon emission reduction
                                        and reduces the emission reduction costs of the whole society. It also drives green techno-
                                        logical innovation and industrial investment and provides an effective tool for handling
                                        the relationship between economic development and carbon emission reduction [17,18].
                                        Therefore, an in-depth understanding of the policy processing effects of the pilot carbon
                                        emissions trading policy is essential for the government to use market-based emission
                                        reduction tools to deal with the dual challenges of green sustainable development and
                                        high-quality economic growth.
                                              In China, cities are the main spatial matrix of carbon emission governance. The
                                        provincial-level emission reduction political tasks issued by the central government will
                                        be decomposed to the city-level and implemented through the city-level government to
                                        specific emission reduction decisions of enterprises and institutions [19,20]. Therefore,
                                        city-level research will be more practical than provincial-level research.
                                              Previous studies on the impact of CETS policies on GTFP have ignored the spatial
                                        effects of policies, resulting in a bias in the identification of policy effects [19]. There are two
                                        main sources of spatial effects of policies: one is the extensive internal circulation connection
                                        between cities. Although there are still some factor markets in China that have not been
                                        liberalized, the circulation of major commodities and factors between provinces and cities
                                        is smooth; that is, there are extensive internal circulation connections between cities. This
                                        internal circulation link will become a channel for the policy effect, acting in some regions
                                        to extend outside the pilot area, which will then generate the general equilibrium effect
                                        of the policy and form the spatial externality of the policy effect [21,22]. The second is
                                        the spatial redistribution of enterprises caused by enterprise location decisions under
                                        the pressure of CETS policy. Similar to the classic “pollution paradise hypothesis”, after
                                        the implementation of the CETS pilot policy, some carbon-emitting companies choose to
                                        relocate their factories to areas with lower environmental standards (such as non-pilot
                                        cities), which, in turn, produces a spatial externality of policy effects [19].
                                              Existing studies have shown that CETS can achieve the policy effect of enhancing
                                        GTFP by improving energy efficiency, promoting low-carbon innovation, and adjusting
                                        industrial structure [23,24], but there is also the problem of ignoring the policy space effect.
                                        Under the pressure of CETS policy, carbon emission companies in pilot cities will take
                                        decisions such as carbon emission quota trading [25,26], emission reduction innovation,
                                        and location relocation to deal with the policy pressure [27]. At the macro level, these
                                        decisions drive industrial capital and economic factors to gradually shift from high-carbon
                                        industries to low-carbon and clean industries, which will lead to improvements in energy
                                        efficiency, low-carbon innovation, and a shift in industrial structure and then realize the
                                        promotion of urban GTFP at multiple scales, from the micro to the macro level [28–30]. At
                                        the same time, the differentiation of corporate emission reduction decisions will inevitably
                                        lead to the fact that some high-carbon companies cannot cover emission reduction costs
                                        through low-carbon innovation [31–33]. These manufacturers will choose to withdraw
                                        from the local market and relocate. On the one hand, it can improve the overall GTFP level
                                        of the original location, but on the other hand, the efficiency of the new location will be
                                        lowered due to their high-carbon decision-making, which will result in the spatial siphon
                                        effect of GTFP [34]. Furthermore, the intra-regional and inter-regional flow of industrial
                                        capital will have an impact on financial agglomeration and then affect the urban GTFP by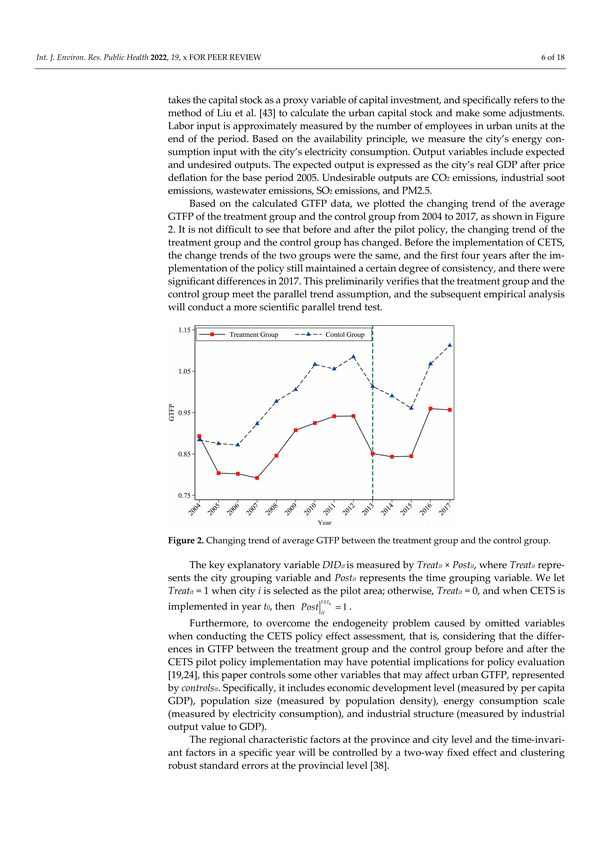
Int. J. Environ. Res. Public Health 2022, 19, 1209                                                                               3 of 18

                                        affecting the efficiency of capital spatial allocation. This is another influence mechanism
                                        that is easily overlooked by existing research.
                                              In addition, the problem of high carbon emissions brought about by China’s rapid
                                        economic growth is a typical problem that is occurring or will soon be faced by developing
                                        countries and some emerging market countries [19]. Therefore, our research can provide
                                        theoretical and practical experience for the construction of carbon markets in developing
                                        countries. Secondly, the CETS pilot areas approved by the Chinese government have
                                        different geographic locations and significant humane, economic, geographic, and spatial
                                        heterogeneous distribution characteristics. It is possible to comprehensively investigate the
                                        potential spatial heterogeneity of the CETS policy effects in regions with different economic
                                        development levels and different human and geographic characteristics [19]. In addition,
                                        as a typical market-oriented emission reduction policy tool, the policy effect of CETS will
                                        be affected by the level of marketization in the pilot area, the implementation of monitoring
                                        reporting and verification (MRV), and the structure of energy consumption [35]. Our
                                        research is of great help in understanding how CETS can improve GTFP under complex
                                        market economic conditions.
                                              The marginal contributions of this study are mainly in three aspects: Firstly, we adopt
                                        the SDID-SDM model, with two-way fixed effects, based on prefecture-level city-level data
                                        rather than provincial-level data [36–38] to scientifically identify and estimate the direct
                                        impact and spatial lag impact of CETS on urban GTFP, which avoids identification bias
                                        due to missing spatial externalities of policy effects. Secondly, we use the panel data of
                                        281 cities in mainland China to empirically examine the policy effects of China’s CETS,
                                        which provides additional quantitative evidence for the study of the policy performance
                                        of emission reduction tools such as carbon trading markets in emerging economies. It
                                        makes up for the lack of previous studies that have mainly focused on European and
                                        American markets [39] and ignored developing economies. Finally, based on the benchmark
                                        model, this research integrates spatial effects into the analysis of CETS’s mechanism of
                                        promoting GTFP and the analysis of heterogeneity of policy effects, which expands the
                                        spatial dimension of existing research content. In addition, we also discuss the CETS
                                        policy effect mechanism and the sources of heterogeneity from the perspective of financial
                                        agglomeration and financial endowment.
                                              The rest of this paper is organized as follows: Section 2 discusses the policy background
                                        and development status of CETS. Part 3 presents the methodology and data. Section 4
                                        presents the empirical results of the benchmark model and a series of robustness tests. The
                                        fifth part is the investigation of the CETS policy effect mechanism. Section 6 is an in-depth
                                        analysis of policy heterogeneity. The last part is the discussion and conclusions.

                                        2. China’s Carbon Emission Trading System
                                             The Chinese government has carried out a lot of policy exploration to deal with
                                       ecological and environmental issues in the context of high growth, especially carbon
                                       emissions [24]. In 2010, the State Council of China issued the “Decision on Accelerating the
                                       Cultivation and Development of Emerging Industries with Strategic Characters”, which
                                       formally proposed to “establish and improve a major pollutant and carbon emission trading
                                       system” as one of the tasks to deepen reforms in key areas. In 2011, China issued the
                                       “Outline of the Twelfth Five-Year Plan for National Economic and Social Development” and
                                       the “Comprehensive Work Plan for Energy Conservation and Emission Reduction in the
                                       Twelfth Five-Year Plan”. Both documents put forward the work objective of “carrying out
                                       pilot carbon emissions trading, establishing voluntary emission reduction mechanisms, and
                                       promoting the construction of a carbon emissions trading market”. In the same year, the
                                       National Development and Reform Commission of China issued the “Notice on Carrying
                                       out Pilot Carbon Emission Trading”, officially approving the seven provinces and cities
                                       of Beijing, Tianjin, Shanghai, Chongqing, Hubei, Guangdong, and Shenzhen to carry out
                                       carbon trading pilots (see Figure 1 for the distribution of pilot areas); in 2013–2014, pilot
                                       projects of carbon trading were successively launched.
Int. J. Environ. Res. Public Health 2022, 19, 1209                                                                              4 of 18

                                        Figure 1. Distribution of CETS pilot areas in China.

                                             In 2014, the National Development and Reform Commission of China issued the
                                       “Interim Measures for the Management of Carbon Emissions Trading”, which set a basic
                                       framework and mechanism for a nationwide carbon trading market, with “quota manage-
                                       ment”, “emissions trading”, “verification and allowance settlement”, “supervision and
                                       management” and many other dimensions.
                                             Different from the CETS design based on the aggregate system generally adopted by
                                       developed economies, China’s CETS is mainly based on an intensity-based system design,
                                       which is essential to reduce the carbon emission intensity of economic activities.
                                             As of July 2021, China’s carbon trading has gone through 7 periods of compliance.
                                       Judging from the statistical data officially released by China, CETS has achieved positive
                                       policy effects, as shown in Table 1 [40]. Statistics show that China’s CETS has exerted certain
                                       policy effects in terms of carbon dioxide emission reduction and economic benefits [24,41].
                                       However, the statistics did not disclose the relevant content of the green development effect
                                       of the pilot policy; and as stated in the introduction, the current research on the effects
                                       of China’s CETS policy ignores the influence of regional spatial linkages on the role of
                                       policies [19].
                                             Above all, the primary purpose of this study is to examine whether CETS can improve
                                       the GTFP of pilot cities under the condition of spatial effect by applying a scientific esti-
                                       mation model and to analyze the internal mechanism of the policy effect. In addition, as
                                       shown in Table 1, there is significant spatial heterogeneity in China’s carbon trading pilot
                                       statistics; that is, there are significant spatial differences among different carbon trading
                                       pilots in terms of industries covered, cumulative trading volume, cumulative trading vol-
                                       ume, and carbon price. Therefore, the analysis of the heterogeneity of CETS policy effects
                                       must incorporate the spatial dimension into the analytical framework, which is another
                                       important research purpose of this study.
Int. J. Environ. Res. Public Health 2022, 19, 1209 5 of 18
Table 1. Current status of the pilot carbon emission trading market.
Cumulative Cumulative Current [Lowest,
Trading
Pilot Area Covered Industries Trading Turnover Highest] Price
Varieties
Volume (100 Million Yuan) (Yuan/Ton)
Heating power, electric
Beijing CO2 power, cement, 0.15 9.04 50.30 [24.00, 102.96]
petrochemical
Steel, fossil, electric power,
thermal power,
Tianjin CO2 0.19 4.08 29.86 [7.00, 62.38]
petrochemical, oil and gas
extraction
Steel, petrochemical,
chemical, electric power,
non-ferrous metals,
Shanghai CO2 building materials, textiles, 0.17 5.18 39.00 [4.21, 49.93]
paper, rubber, chemical
fiber, aviation, airports,
ports, railways, commerce
Electrolytic aluminum,
CO2 , CH4 , titanium alloy, calcium
Chongqing 0.09 0.42 32.67 [1.00, 44.86]
etc. carbide, caustic soda,
cement, steel
Electricity, taxation,
construction,
Shenzhen CO2 0.49 11.80 13.34 [3.12, 122.97]
manufacturing,
transportation
Electricity, cement, steel,
petrochemical, ceramics,
Guangdong CO2 1.68 33.02 43.44 [1.27, 77.00]
textile, paper, non-ferrous
metals
Steel, electricity, cement,
chemicals, petrochemicals,
automobile manufacturing,
non-ferrous metals, glass
Hubei CO2 0.75 17.02 31.81 [9.38, 54.64]
building materials,
papermaking, chemical
fiber, pharmaceuticals, food
and beverages
3. Methodology and Data
3.1. Methodology
We adopt a two-way fixed-effect SDID-SDM model to study the impact of CETS on
GTFP. The combination of SDM and DID models can effectively identify the CETS policy
effects with spatial dimensions [19]. The specific model settings are as follows:
GTFPit = α0 + ρWit GTFPit + α1 DIDit + α2 Wit DIDit + ∑ ( β j controlijt + γ j Wijt controlijt ) + cityi + yeart + ε it (1)
j
where i and t represent the city and year, respectively. GTFPit represents the urban green
total factor productivity, and Wit represents the spatial weight matrix for spatial lag effects,
and DIDit denotes the policy dummy variable of CETS. The control variables are repre-
sented by controlsit . cityi , yeart , and εit represent the city individual fixed effect, time fixed
effect, and the random error term, respectively. According to the basic principles of the
SDID-SDM model, this paper focuses on the estimated coefficients of the DIDit and Wit ×
DIDit after controlling for other factors, which represent the direct and spatial lag impacts
of CETS on urban GTFP.Int. J. Environ. Res. Public Health 2022, 19, 1209 6 of 18
Regarding the explained variables, essentially, GTFP is total factor productivity (TFP)
considering environmental losses (pollution and carbon emissions, etc.); this is obtained
by integrating energy input and environmentally undesired outputs on the basis of the
original TFP. We use the Malmquist-Luenberger (ML) productivity index based on the
slacks-based measure (SBM) directional distance function to measure the urban GTFP as an
explained variable [42]. In the calculation process, the input variables selected in this paper
include capital, labor, and energy consumption. Following the practice of most literature,
this paper takes the capital stock as a proxy variable of capital investment, and specifically
refers to the method of Liu et al. [43] to calculate the urban capital stock and make some
adjustments. Labor input is approximately measured by the number of employees in urban
units at the end of the period. Based on the availability principle, we measure the city’s
energy consumption input with the city’s electricity consumption. Output variables include
expected and undesired outputs. The expected output is expressed as the city’s real GDP
after price deflation for the base period 2005. Undesirable outputs are CO2 emissions,
industrial soot emissions, wastewater emissions, SO2 emissions, and PM2.5.
Based on the calculated GTFP data, we plotted the changing trend of the average GTFP
of the treatment group and the control group from 2004 to 2017, as shown in Figure 2. It is
not difficult to see that before and after the pilot policy, the changing trend of the treatment
group and the control group has changed. Before the implementation of CETS, the change
trends of the two groups were the same, and the first four years after the implementation
of the policy still maintained a certain degree of consistency, and there were significant
differences in 2017. This preliminarily verifies that the treatment group and the control
group meet the parallel trend assumption, and the subsequent empirical analysis will
conduct a more scientific parallel trend test.
Figure 2. Changing trend of average GTFP between the treatment group and the control group.
The key explanatory variable DIDit is measured by Treatit × Postit , where Treatit
represents the city grouping variable and Postit represents the time grouping variable. We
let Treatit = 1 when city i is selected as the pilot area; otherwise, Treatit = 0, and when CETS
t≥t
is implemented in year t0 , then Post|it 0 = 1.
Furthermore, to overcome the endogeneity problem caused by omitted variables when
conducting the CETS policy effect assessment, that is, considering that the differences in
GTFP between the treatment group and the control group before and after the CETS pilot
policy implementation may have potential implications for policy evaluation [19,24], this
paper controls some other variables that may affect urban GTFP, represented by controlsit .
Specifically, it includes economic development level (measured by per capita GDP), pop-Int. J. Environ. Res. Public Health 2022, 19, 1209 7 of 18
ulation size (measured by population density), energy consumption scale (measured by
electricity consumption), and industrial structure (measured by industrial output value
to GDP).
The regional characteristic factors at the province and city level and the time-invariant
factors in a specific year will be controlled by a two-way fixed effect and clustering robust
standard errors at the provincial level [38].
3.2. Samples and Data
As of the end of 2017, in addition to the seven pilot provinces and cities of Beijing,
Tianjin, Shanghai, Chongqing, Hubei, Guangdong, and Shenzhen. Sichuan and Fujian
provinces also established regional carbon markets at the end of 2016. In addition, in
2017, China’s National Development and Reform Commission issued the “National Carbon
Emissions Trading Market Construction Plan (Power Generation Industry)”, which formally
proposed the establishment of a national carbon emissions trading market. To avoid the
interference of other provinces’ policy documents on the identification of regional pilot
policy effects, we choose 2004–2017 as the sample period. Additionally, because of the
heterogeneity of the CETS system design and regional endowments of the pilot provinces
and cities, we use the fixed effect of the city and the fixed effect of the year to control the
heterogeneous interference between the individual and the time level.
Considering the principle of data availability and the consistency of statistical coverage,
when constructing dummy variables for groups, we excluded prefecture-level cities in the
Tibet Autonomous Region, Hong Kong, Macau Special Administrative Region, and Taiwan,
with serious data missing. Finally, 281 prefecture-level cities were selected as research
samples, including 37 cities in the treatment group and 244 cities in the control group.
The data required for empirical analysis mainly include two categories: input and output
variables for measuring urban GTFP and city-level control variables for SDID-SDM analysis.
The above variable data are all from the “China Urban Statistical Yearbook” and “China
Statistical Yearbook” of the corresponding year. The urban CO2 emissions are calculated by
superimposing and summing the carbon emissions of the counties under its jurisdiction.
4. Empirical Results
4.1. Parallel Trend Test
The application of the DID method to evaluate CETS policy effects must meet the
important “parallel trend assumption” [44,45], that is, the treatment group and the control
group of the pilot policy should maintain a consistent change trend before being impacted
by the policy, which is an important prerequisite for judging the effectiveness of SDID.
Therefore, this paper adopts the event analysis method for parallel trend verification, as
shown in Figure 3. It shows that none of the core explanatory variable coefficients before
the CETS pilot policy passed the significance test, and after CETS was implemented, there
was a significant difference between the two groups after a certain lag period. It means
that the changing trend of GTFP in the treatment group and the control group is the same
before the implementation of the policy; that is, it has passed the parallel trend test.
In addition, by observing the estimated coefficients of the core explanatory variables
after the implementation of the policy, we find that the coefficients in the 1–3 years after
the implementation of the CETS pilot policy were not significant, which means that within
the first four years of the policy, CETS did not have an immediate policy effect on the
promotion of urban GTFP.Int. J. Environ. Res. Public Health 2022, 19, 1209 8 of 18
Figure 3. Parallel trend test.
4.2. Benchmark Results
As shown in Table 2, Columns (1) and (2) are the average treatment effect results
estimated by the panel DID model and the SDID-SDM model. Column (3) is the result
of the dynamic treatment effect of each year after the implementation of the pilot policy
estimated by the SDID-SDM model. The results show that after controlling for the two-way
fixed effect of the city’s individual effect and the year-time effect, without considering the
spatial effect, CETS showed a negative inhibitory effect on the GTFP of the pilot cities.
However, after considering the spatial effect, CETS significantly increased the GTFP of the
pilot cities with a coefficient that was significant at the 10% confidence level; at the same
time, it significantly suppressed the growth of GTFP in the surrounding areas, and the
coefficients were all significant at the 1% confidence level. The difference between the two
models is mainly due to the existence of spatial effects. The SDID-SDM model estimates
that the coefficient of the DID term is positive and the coefficient of the spatial lag term is
negative, indicating that the direct effect level CETS has positively improved the GTFP of
the pilot cities. However, the overall effect is negative due to the larger negative spatial
feedback effect, which explains the possible reasons for the different direction from the
panel DID model results.
The dynamic effect analysis result of Column (3) shows that the CETS pilot policy
showed a significant positive promotion effect in the fourth year after the implementation of
the policy. The coefficient is significant at the 1% confidence level, and the promotion effect
is increasing year by year. The impact of the policy on surrounding cities is manifested in
the third year after the implementation of the policy, showing a negative spatial siphon
effect, and the siphoning effect is increasing year by year.
The above benchmark regression results once again confirmed the significant improve-
ment effect of CETS on the GTFP of the pilot cities, which is consistent with the existing
research results [46]. The difference is that this research considers the spatial economic
links between cities and adds the setting of policy spatial effects. The research shows that
although CETS significantly increases the GTFP of the territorial cities, it also produces
a negative spatial siphon effect on the surrounding cities, which is not conducive to the
growth of GTFP in surrounding areas. We believe that this negative spatial siphon effect is
mainly caused by the transfer of high-carbon companies from pilot cities to the surround-
ing areas under policy pressure. It is similar to the “pollution refuge” theory and can be
understood as a “carbon emission refuge”.Int. J. Environ. Res. Public Health 2022, 19, 1209 9 of 18
Table 2. Baseline regression results.
Model Panel-DID SDID-SDM
Variables (1) (2) (3)
−1.235 *** 0.083 *
DID
(−9.85) (1.80)
−0.172 ***
W × DID
(−3.04)
0.028
Treat × year13
(0.33)
0.025
Treat × year14
(0.29)
0.018
Treat × year15
(0.21)
0.125
Treat × year16
(1.46)
0.223 ***
Treat × year17
(2.58)
−0.096
W × treat × year13
(−0.90)
−0.069
W × treat × year14
(−0.65)
−0.027
W × treat × year15
(−0.26)
−0.189 *
W × treat × year16
(−1.78)
−0.489 ***
W × treat × year17
(−4.58)
Control Y Y Y
Year-FE Y Y Y
City-FE Y Y Y
Obs. 3934 3934 3934
R2 0.351 0.112 0.111
Note: DID is short for difference-in-differences; SDID-SDM is short for spatial difference-in-differences Durbin
model; FE is short for fixed effect. The parentheses are the t-values. *** and * represent significant levels at 1% and
10%, respectively.
Since there are spatial interaction terms of dependent variables in the benchmark SDID-
SDM model, the benchmark model setting contains feedback effects between regions, so
the model coefficients estimated by the benchmark regression need to be analyzed through
effect decomposition and summation. Therefore, we report the effect decomposition of the
core explanatory variables in the benchmark model, that is, the estimated coefficients of
direct effects, indirect effects, and total effects. As shown in Table 3, the direct effect of the
CETS policy effect coefficient is significantly positive at the 10% confidence level, and the
indirect effect and the total effect are both significantly negative at the 1% confidence level.
Table 3. Decomposition of the spatial effect of CETS: direct effect, indirect effect, and total effect.
Variable Direct Effect Indirect Effect Total Effect
0.081 ** −0.179 *** −0.098 ***
DID
(1.75) (−3.13) (−3.02)
Note: DID is short for difference-in-differences. The parentheses are the t-values. *** and ** represent significant
levels at 1%, and 5%, respectively.
4.3. Robustness Tests
4.3.1. Placebo Test
Based on the research method of Ren et al. [47], this paper conducts a placebo test
by randomly assigning CETS pilot cities; that is, 37 cities are randomly selected as the
treatment group for each sampling (the original number of the treatment group is 37), andInt. J. Environ. Res. Public Health 2022, 19, 1209 10 of 18
the remaining 244 cities are used as the random control group. We performed 1000 in-
dependent replicates and estimations according to Equation (1). The distribution of the
regression-estimated coefficients for independently repeated experiments is shown in Fig-
ure 4. It is not difficult to find that the distribution of estimated coefficients is concentrated
around the zero point, and the benchmark estimated coefficients in Column (2) of Table 2
are on the edge of the distribution in the independently repeated experiments. It suggests
that the enhanced effect of the CETS pilot policy on GTFP in pilot cities is unlikely to be
driven by other exogenous factors, which means that it passes the placebo test.
Figure 4. (a,b) are, respectively, the distribution diagrams of the coefficients of DID and W × DID on
GTFP in the random sampling estimation results.
4.3.2. PSM-SDID Estimation
CETS has a significant promotion and negative spatial siphon effect on GTFP in pilot
cities and the aforementioned parallel trend test has justified the application of the SDID
method; however, considering that the non-random establishment of CETS pilot areas
may lead to biased estimation results [48], we further adopt the propensity score matching
SDID (PSM-SDID) method to avoid endogenous selection bias. We select urban economic
development level, population size, energy consumption scale, and industrial structure as
matching characteristic variables and then perform logistic regression and kernel matching
to obtain matching samples and estimate them according to Formula (1). The results are
shown in Column (1) of Table 4. It can be found that the coefficients of DIDit and Wit
× DIDit are significant at the 1% level, which indicates that the benchmark regression
estimation results in Table 2 are robust.
4.3.3. The Difference-in Difference-in-Differences (DDD)
A possible problem with the SDID estimation strategy described above is that there
may be other policies in addition to the CETS pilot policy that have inconsistent effects on
GTFP in pilot and non-pilot regions. The interference of these policies can confound the
estimates of the baseline model. For example, the ETS pilot policy has been implemented
in 11 provinces (cities), including Tianjin, Hebei, Shanxi, Inner Mongolia, Jiangsu, Zhejiang,
Henan, Hubei, Hunan, Chongqing, and Shaanxi, since 2007. We control the possible confus-
ing effects of ETS by constructing dummy variables for carbon emissions trading pilots [38]
and then use the difference-in difference-in-differences (DDD) method to overcome this
problem. Column (2) of Table 4 reports the average treatment effect estimated by DDD, and
the results are consistent with the baseline estimates, indicating that the CETS pilot policy
effects estimated by the baseline model are reliable.Int. J. Environ. Res. Public Health 2022, 19, 1209 11 of 18
Table 4. Estimation results in PSM-SDID and effect with ETS.
Model PSM-SDID ETS
Variables (1) (2)
0.140 ***
DID
(2.91)
−0.232 ***
W × DID
(−3.99)
0.145 ***
DDD
(3.03)
−0.233 ***
W × DDD
(−4.02)
Control Y Y
Year-FE Y Y
City-FE Y Y
Obs. 3934 3934
R2 0.123 0.271
Note: DID is short for difference-in-differences; PSM-SDID is short for propensity score matching spatial difference-
in-differences; ETS is short for emissions trading system; DDD is short for difference-in difference-in-differences;
FE is short for fixed effect. The parentheses are the t-values. *** represent significant levels at 1%, respectively.
5. Mechanism Analysis
5.1. Re-Examination of Traditional Mechanisms
As discussed in the introduction, previous studies have shown that CETS will influence
changes in urban-level GTFP through channels such as energy efficiency, low-carbon
technological innovation, and industrial structure. However, these studies often overlook
the important role that spatial effects may play in the influence mechanism. Therefore, we
will empirically re-examine these potential impact mechanisms.
5.1.1. Energy Efficiency Effect
Previous studies focused on analyzing the impact of companies choosing to improve
energy efficiency on GTFP in territorial cities [49], and they ignore the economic efficiency
brought about by local energy efficiency improvements, which will attract companies with
higher energy efficiency in the surrounding areas to migrate to the area. At the same time,
there are still some companies in this area that cannot cover costs even if they improve
energy efficiency. These companies often choose to move to the surrounding areas. The
dual effects of high input and low output jointly produce a positive promotion effect on
the territorial cities and a spatial siphon effect of negative adsorption on the surrounding
areas. We approximate urban energy efficiency as the ratio of urban industrial electricity
consumption to GDP, and the lower the value, the higher the energy efficiency of the city.
Therefore, the estimation result of the prediction model is exactly opposite to the estimation
result of the benchmark regression model. We apply the following model to test the energy
efficiency effect:
GTFPit = α0 + ρWit GTFPit + ∑ ( β j controlijt + γ j Wijt controlijt ) + cityi + yeart + ε it
j (2)
+(α1 DIDit + α2 eeit + α3 DIDit × eeit ) + (δ1 Wit DIDit + δ2 Wit eeit + δ3 Wit ( DIDit × eeit ))
Column (1) in Table 5 reports the estimated results of the energy efficiency effect
identified based on Formula (2). The results in the table show that the coefficients of the
core explanatory variables are significant at the 1% level, and, consistent with the previous
assumption, CETS can improve the energy efficiency of the territorial cities to achieve a
positive effect on the GTFP of the territorial cities and a negative spatial siphon effect on
the surrounding areas.Int. J. Environ. Res. Public Health 2022, 19, 1209 12 of 18
Table 5. Results of the impact mechanism analysis.
Low Carbon Financial
Model Energy Efficiency Industry Structure
Innovation Agglomeration
Variables (1) (2) (3) (4)
−0.177 ***
DID × ee
(−3.69)
0.526 ***
W × DID × ee
(6.20)
0.886 **
DID × lci
(2.24)
−8.628 *
W × DID × lci
(−1.74)
−1.202 ***
DID × str
(−4.19)
2.093 ***
W × DID × str
(3.69)
0.046 ***
DID × fa
(3.21)
−0.092 ***
W × DID × fa
(−3.50)
Control Y Y Y Y
Year-FE Y Y Y Y
City-FE Y Y Y Y
Obs. 3934 3934 3934 3372
R2 0.177 0.117 0.118 0.119
Note: DID is short for difference-in-differences; FE is short for fixed effect. The parentheses are the t-values.
***, **, and * represent significant levels at 1%, 5%, and 10%, respectively.
5.1.2. Low-Carbon Innovation Effect
Similar to energy efficiency, we believe that CETS can achieve a positive, improving
effect on the territorial city and a negative spatial siphon effect on the surrounding area
by promoting the low-carbon innovation of the territorial city [50]. We use the ratio of the
number of low-carbon patents to the total number of patent grants to measure the level
of city-level low-carbon innovation and use the following model to test the low-carbon
innovation effect:
GTFPit = α0 + ρWit GTFPit + ∑ ( β j controlijt + γ j Wijt controlijt ) + cityi + yeart + ε it
j (3)
+(α1 DIDit + α2 lciit + α3 DIDit × lciit ) + (δ1 Wit DIDit + δ2 Wit lciit + δ3 Wit ( DIDit × lciit ))
Column (2) of Table 5 reports the estimation results of the low-carbon innovation effect
identified based on Formula (3). The data in the table show that the coefficients of the
core explanatory variables are significant at the 5% and 10% levels, respectively, and are
consistent with the previous assumptions. CETS can realize the positive promotion effect
on the GTFP of the local city and the negative spatial siphon effect on the surrounding
areas by promoting the low-carbon innovation of the local city.
5.1.3. Industry Structure Effect
When faced with CETS policy pressure, individual companies in pilot cities will often
choose to purchase allowances for carbon emission, improve energy efficiency, low-carbon
technology innovation, and migration based on their emission reduction costs and benefits.
However, no matter which option, there are more enterprise groups in the entire market
environment. For example, if a company buys quotas, it inevitably means that a company
sells quotas. This will form a structural transformation process; that is, under the pressure
of CETS policy, companies will gradually withdraw from high-carbon industries and
transition to green and low-carbon industries. This change in industrial structure will have
a positive impact on urban GTFP. Similarly, previous studies have focused on analyzingInt. J. Environ. Res. Public Health 2022, 19, 1209 13 of 18
the impact of changes in the industrial structure of pilot cities on GTFP in territorial cities
while ignoring the process of entry and exit of enterprises between regions. The dual effects
of high industrial allocation efficiency in and low out have jointly produced a positive
promotion effect on the territorial cities and a spatial siphon effect of negative absorption
on the surrounding areas. We use the proportion of the secondary industry to measure the
city-level industrial structure. Theoretically, the estimation result is exactly opposite to the
estimation result of the benchmark regression model. We adopt the following model to test
the industry structure effect:
GTFPit = α0 + ρWit GTFPit + ∑ ( β j controlijt + γ j Wijt controlijt ) + cityi + yeart + ε it
j (4)
+(α1 DIDit + α2 strit + α3 DIDit × strit ) + (δ1 Wit DIDit + δ2 Wit strit + δ3 Wit ( DIDit × strit )
Column (3) of Table 5 reports the estimated results of the industry structure effect
identified based on Formula (4). The data in the table show that the coefficient of the
core explanatory variable is significant at the 1% level. Consistent with the previous
assumptions, CETS can improve urban GTFP by reducing the proportion of secondary
industry in pilot cities; by increasing the proportion of secondary industries in surrounding
cities, a negative spatial siphon effect is generated.
5.2. Financial Agglomeration Effect
The traditional mechanism analysis mainly focuses on the efficiency and structural
level of the influence mechanism while ignoring that the effect of CETS policy may be
realized through the accumulation of financial capital. When analyzing how CETS affects
urban GTFP through industrial structure, we believe that CETS will guide the structural
transfer of industrial capital. Specifically, when companies adopt green and low-carbon
technological innovations to respond to the pressure to reduce emissions, they will attract
green and low-carbon capital to settle in the pilot city. When companies face the pressure
to reduce emissions and choose to flee the pilot cities, some high-carbon capital will be
withdrawn. This kind of capital entry and exit is related to corporate emission reduction
decisions. It means that CETS may have an impact on the spatial distribution of financial
capital, which, in turn, will affect the spatial allocation efficiency of financial elements and
change the city’s GTFP. We use the location entropy of the financial industry to measure
the level of financial agglomeration at the city level [51]. We apply the following model to
test the financial agglomeration effect:
GTFPit = α0 + ρWit GTFPit + ∑ ( β j controlijt + γ j Wijt controlijt ) + cityi + yeart + ε it
j (5)
+(α1 DIDit + α2 f ait + α3 DIDit × f ait ) + (δ1 Wit DIDit + δ2 Wit f ait + δ3 Wit ( DIDit × f ait ))
Column (4) of Table 5 gives the estimated results of the financial agglomeration angle.
The results show that CETS can achieve the effect of improving the city’s GTFP by increasing
the financial agglomeration of pilot cities, and it produces a negative spatial siphon effect
on the financial agglomeration of surrounding cities, and then produces a negative policy
effect that inhibits GTFP in surrounding areas.
6. Heterogeneity Analysis
Theoretically, the market-based trading of allowances can equalize the marginal abate-
ment costs of various emitters and control emissions at the lowest cost. The key to the
policy effect of CETS is that the carbon price information can truly and accurately reflect
carbon market emissions information, which depends on the implementation of monitor-
ing, reporting, and verification (MRV). Market-oriented policy tools and MRV are both
depend on a relatively free-market economic environment. Therefore, the marketization
level and MRV capacity of carbon trading market pilot cities are important factors that lead
to the difference in the policy effect of CETS on GTFP. In addition, there are significant
differences in energy consumption endowments between resource-based cities rich in coal
and oil and non-resource cities. This endowment difference makes different cities haveInt. J. Environ. Res. Public Health 2022, 19, 1209 14 of 18
different policy effects when facing CETS policy pressure [52]. Moreover, differences in
financial endowments not only affect the investment and financing process of low-carbon
industries but also affect the allocation structure and efficiency of financial capital among
industries. Therefore, we believe that urban financial endowment is also an important
source of heterogeneity affecting policy effects.
We measure the above four heterogeneity factors by the following methods. Firstly, we
divide the provincial marketization data as grouping dummy variables named Mar (cities
in the high-level group mean Mar = 1, and cities in the low group mean Mar = 0) based on
the median line to study the heterogeneity of policy effects that may be brought about by
the level of marketization [19,36,53]. Secondly, we learn from Wang S S et al. (2021) [19]
and use the ratio of provincial environmental administrative penalty cases to total energy
consumption to measure the level of regional environmental enforcement, which is used to
approximate urban MRV capability. We group the ratio by median named Mrv (cities in
high group mean Mrv = 1, and cities in low group mean Mrv = 0). Thirdly, we calculate
the proportion of provincial coal consumption in energy consumption (group proportional
data by median named ECE (cities in the high group mean ECE = 1, and cities in the low
group mean ECE = 0)) to study the policy heterogeneity that energy consumption structure
may bring. Finally, we use the proportion of the total balance of deposits and loans of
financial institutions in the city at the end of the year to the regional GDP to measure the
level of urban financial endowment (group proportional data by median named Fin (cities
in the high group mean Fin = 1, and cities in the low group mean Fin = 0)). For all these
grouping processes, we mainly use provincial data from the year before the pilot policy as
the basis for grouping to avoid possible selection bias.
As shown in Table 6 Columns (1)–(4), we estimated the coefficients of the core ex-
planatory variables under the four heterogeneity groups, namely, marketization level, MRV
capacity, energy consumption structure, and financial endowment. It is not difficult to find
that the coefficients of the DID term and W × DID term, estimated by the four heteroge-
neous sources, are all in the same direction as the baseline regression estimation result. It
shows that the policy effect of CETS’s promotion of GTFP in pilot cities shows significant
heterogeneous characteristics under different marketization levels, environmental law
enforcement efforts, and energy consumption endowments. Moreover, the policy effects
perform better in regions with a high degree of marketization, strong MRV capabilities, a
high proportion of coal consumption, and better financial endowments.
Table 6. Heterogeneity analysis results.
Energy Consumption
Model Marketization Level MRV Capability Financial Endowment
Endowment
Variables (1) (2) (3) (4)
0.956 ***
DID × Mar
(5.25)
−0.289 **
W × DID × Mar
(−1.96)
0.227 ***
DID × Mrv
(2.62)
−0.402 ***
W × DID × Mrv
(−3.64)
0.155 *
DID × ECE
(1.81)
−0.386 ***
W × DID × ECE
(−3.89)
0.049 ***
DID × Fin
(3.41)Int. J. Environ. Res. Public Health 2022, 19, 1209 15 of 18
Table 6. Cont.
Energy Consumption
Model Marketization Level MRV Capability Financial Endowment
Endowment
−0.092 ***
W × DID × Fin
(−3.50)
Control Y Y Y Y
Year-FE Y Y Y Y
City-FE Y Y Y Y
Obs. 3934 3934 3934 3372
R2 0.110 0.117 0.121 0.098
Note: DID is short for difference-in-differences; MRV is short for monitoring reporting and verification; Mar
is short for marketization level; ECE is short for energy consumption endowment; Fin is short for financial
endowment; FE is short for fixed effect. The parentheses are the t-values. ***, **, and * represent significant levels
at 1%, 5%, and 10%, respectively.
7. Discussion and Conclusions
7.1. Discussion
This paper regards the CETS pilot policy as a quasi-natural experiment. Based on panel
data of 281 cities in China from 2004 to 2017, we adopt the SDID-SDM model with two-way
fixed effects to investigate the impact of China’s CETS on urban GTFP. After controlling
the influence of individual fixed effects, time fixed effects, and controlled variables, CETS
has significantly improved GTFP in pilot cities, which is consistent with the conclusions
of existing related research [46]. However, the ignorance of spatial effects in these studies
makes the identification of policy effects biased. We applied the SDID-SDM model to
effectively identify the spatial effects of CETS policies.
Subsequently, we introduced spatial effects in the empirical test of the three influencing
mechanisms in traditional research, namely, energy efficiency, low-carbon innovation, and
industrial structure. While verifying the conclusions of previous studies, the performance
of the influence mechanism at the level of spatial effects was investigated. The decisions
made by the pilot city’s carbon emission companies in the face of CETS policy pressure
not only affect the city’s internal economic micro and macro performance, but it will also
affect GTFP in surrounding areas through enterprises moving in and out, commodity trade
links, and the circulation of resource elements. It is an important source of significant
spatial effects at the level of the impact mechanism. In addition, previous studies have
overlooked the process of spatial allocation of financial capital brought about by changes
in economic structure, which is also an important channel of how CETS affects urban GTFP.
We introduce financial agglomeration to effectively identify the influence mechanism of
this process. Follow-up research can try to start from the perspective of enterprise entry
and exit, analyze the impact of CETS on the location choice of carbon emission companies,
and investigate in-depth whether the impact will promote the improvement of GTFP in
the region.
To thoroughly investigate the source of the heterogeneity of policy effects, we combine
the market-oriented characteristics of the CETS policy, the policy’s high dependence on
the government’s MRV capabilities, and the energy consumption structure of the regions
where the policy is implemented and analyze the heterogeneity of policy effects. Similar
to previous research conclusions, the level of marketization and the government’s MRV
capability are effective guarantees for pilot cities to exert the effects of CETS policies. The
dependence of cities on high-emission energy sources such as coal is more conducive to
CETS’s policy effectiveness. This result, on one hand, confirms that China’s market reform
has achieved certain results and also refutes the doubts of some foreign scholars [38]. It also
shows that the spatial heterogeneity of China’s internal marketization level is a key factor
affecting the effects of CETS policy. On the other hand, it also affirms the growth of the
Chinese government in MRV capabilities; at the same time, it also verifies the key influence
of MRV capability on CETS’s policy effect. In addition, we also investigated the impact
of urban financial endowment on CETS’s policy effects. The results show that financialInt. J. Environ. Res. Public Health 2022, 19, 1209 16 of 18
endowment is also an important source of heterogeneity. Subsequent research can consider
introducing variables related to the green finance index and in-depth analysis of the effect
of green finance on CETS’s policy effectiveness and its internal mechanism.
7.2. Conclusions
In general, our research provides spatial-level test evidence for the role, mechanism,
and heterogeneity of CETS’s impact on urban GTFP. It makes up for the negligence of
previous related studies on the policy spatial effect. In addition, the identification method
of this study can provide a scientific reference for other high-emission developing countries
to carry out similar studies.
Although this research provides evidence of additional econometric analysis for the
government in carbon trading market management decision-making and green devel-
opment research, there are still some directions for improvement. Firstly, our research
object only focused on 281 cities in mainland China and we did not examine the policy
effects, mechanisms, and heterogeneity of carbon trading market policies in other emerging
market economies or developing countries from a spatial dimension, which means there is
a lack of broader empirical arguments. Secondly, although we have introduced financial
agglomeration and financial endowments into the analysis framework, it did not launch
a more in-depth analysis. In addition, we have not compared the pilot policy with the
national carbon market that has been in operation. These will be feasible directions for
follow-up research.
Author Contributions: Conceptualization, G.C. and D.H.; methodology, G.C.; software, G.C.; valida-
tion, G.C. and D.H.; formal analysis, G.C. and D.H.; data curation, G.C. and D.H.; writing—original
draft preparation, G.C.; writing—review and editing, G.C.; visualization, G.C. and D.H.; supervision,
G.C.; project administration, G.C. and D.H.; funding acquisition, G.C. and D.H. All authors have read
and agreed to the published version of the manuscript.
Funding: This research was funded by the Ministry of Education of Humanities and Social Science
Project (No. 17YJCZH063), the Shenzhen Philosophy and Social Sciences Planning 2020 Project
(No. SZ2020B012), and the Characteristic Innovation Project of General Colleges and Universities in
Guangdong Province (No. 2020WTSCX237).
Institutional Review Board Statement: Not applicable.
Informed Consent Statement: Not applicable.
Data Availability Statement: The data presented in this study are available on request from the
corresponding author. The data are not publicly available due to privacy.
Conflicts of Interest: The authors declare no conflict of interest.
References
1. Akadiri, S.S.; Bekun, F.V.; Taheri, E.; Akadiri, A.C. Carbon emissions, energy consumption and economic growth: A causality
evidence. Int. J. Energy Technol. Policy 2019, 15, 320–336. [CrossRef]
2. Gao, Y.; Li, M.; Xue, J.; Liu, Y. Evaluation of effectiveness of China’s carbon emissions trading scheme in carbon mitigation. Energy
Econ. 2020, 90, 104872. [CrossRef]
3. Su, C.W.; Naqvi, B.; Shao, X.F.; Li, J.-P.; Jiao, Z. Trade and technological innovation: The catalysts for climate change and way
forward for COP21. J. Environ. Manag. 2020, 269, 110774. [CrossRef] [PubMed]
4. Lashof, D.A.; Ahuja, D.R. Relative contributions of greenhouse gas emissions to global warming. Nature 1990, 344, 529–531.
[CrossRef]
5. Meinshausen, M.; Meinshausen, N.; Hare, W.; Raper, S.C.; Frieler, K.; Knutti, R.; Frame, D.J.; Allen, M.R. Greenhouse-gas emission
targets for limiting global warming to 2 ◦ C. Nature 2009, 458, 1158–1162. [CrossRef]
6. Wyser, K.; Kjellström, E.; Koenigk, T.; Martins, H.; Doescher, R. Warmer climate projections in EC-Earth3-Veg: The role of changes
in the greenhouse gas concentrations from CMIP5 to CMIP6. Environ. Res. Lett. 2020, 15, 054020. [CrossRef]
7. Shi, X.; Zheng, Y.; Lei, Y.; Xue, W.; Yan, G.; Liu, X.; Cai, B.; Tong, D.; Wang, J. Air quality benefits of achieving carbon neutrality in
China. Sci. Total Environ. 2021, 795, 148784. [CrossRef] [PubMed]
8. Tan, J.; Wang, R. Research on evaluation and influencing factors of regional ecological efficiency from the perspective of carbon
neutrality. J. Environ. Manag. 2021, 294, 113030. [CrossRef]Int. J. Environ. Res. Public Health 2022, 19, 1209 17 of 18
9. Murray, B.C.; Maniloff, P.T. Why have greenhouse emissions in RGGI states declined? An econometric attribution to economic,
energy market, and policy factors. Energy Econ. 2015, 51, 581–589. [CrossRef]
10. Chan, N.W.; Morrow, J.W. Unintended consequences of cap-and-trade? Evidence from the Regional Greenhouse Gas Initiative.
Energy Econ. 2019, 80, 411–422. [CrossRef]
11. Bayer, P.; Aklin, M. The European Union emissions trading system reduced CO2 emissions despite low prices. Proc. Natl. Acad.
Sci. USA 2020, 117, 8804–8812. [CrossRef] [PubMed]
12. Flachsland, C.; Pahle, M.; Burtraw, D.; Edenhofer, O.; Elkerbout, M.; Fischer, C.; Tietjen, O.; Zetterberg, L. How to avoid history
repeating itself: The case for an EU Emissions Trading System (EU ETS) price floor revisited. Clim. Policy 2020, 20, 133–142.
[CrossRef]
13. Choi, Y.; Qi, C. Is South Korea’s emission trading scheme effective? An analysis based on the marginal abatement cost of
coal-fueled power plants. Sustainability 2019, 11, 2504. [CrossRef]
14. Narassimhan, E.; Gallagher, K.S.; Koester, S.; Alejo, J.R. Carbon pricing in practice: A review of existing emissions trading systems.
Clim. Policy 2018, 18, 967–991. [CrossRef]
15. Weng, Q.; Xu, H. A review of China’s carbon trading market. Renew. Sustain. Energy Rev. 2018, 91, 613–619. [CrossRef]
16. Qi, S.; Zhou, C.; Li, K.; Tang, S.-Y. The impact of a carbon trading pilot policy on the low-carbon international competitiveness of
industry in China: An empirical analysis based on a DDD model. J. Clean. Prod. 2021, 281, 125361. [CrossRef]
17. Schneider, L.; La Hoz Theuer, S. Environmental integrity of international carbon market mechanisms under the Paris Agreement.
Clim. Policy 2019, 19, 386–400. [CrossRef]
18. Arimura, T.H.; Abe, T. The impact of the Tokyo emissions trading scheme on office buildings: What factor contributed to the
emission reduction? Environ. Econ. Policy Stud. 2021, 23, 517–533. [CrossRef]
19. Wang, S.S.; Chen, G.; Han, X. An Analysis of the impact of the emissions trading system on the green total factor productivity
based on the spatial difference-in-differences approach: The Case of China. Int. J. Environ. Res. Public Health 2021, 18, 9040.
[CrossRef]
20. Shao, L.; Li, Y.; Feng, K.; Meng, J.; Shan, Y.; Guan, D. Carbon emission imbalances and the structural paths of Chinese regions.
Appl. Energy 2018, 215, 396–404. [CrossRef]
21. Wang, X.C.; Klemeš, J.J.; Wang, Y.; Dong, X.; Wei, H.; Xu, Z.; Varbanov, P. Water-Energy-Carbon Emissions nexus analysis of
China: An environmental input-output model-based approach. Appl. Energy 2020, 261, 114431. [CrossRef]
22. Mi, Z.; Meng, J.; Zheng, H.; Shan, Y.; Wei, Y.-M.; Guan, D. A multi-regional input-output table mapping China’s economic outputs
and interdependencies in 2012. Sci. Data 2018, 5, 180155. [CrossRef] [PubMed]
23. Yang, Z.; Fan, M.; Shao, S.; Yang, L. Does carbon intensity constraint policy improve industrial green production performance in
China? A quasi-DID analysis. Energy Econ. 2017, 68, 271–282. [CrossRef]
24. Hu, Y.; Ren, S.; Wang, Y.; Chen, X. Can carbon emission trading scheme achieve energy conservation and emission reduction?
Evidence from the industrial sector in China. Energy Econ. 2020, 85, 104590. [CrossRef]
25. Wen, F.; Wu, N.; Gong, X. China’s carbon emissions trading and stock returns. Energy Econ. 2020, 86, 104627. [CrossRef]
26. Dai, H.; Xie, Y.; Liu, J.; Masui, T. Aligning renewable energy targets with carbon emissions trading to achieve China’s INDCs: A
general equilibrium assessment. Renew. Sustain. Energy Rev. 2018, 82, 4121–4131. [CrossRef]
27. Zhu, J.; Fan, Y.; Deng, X.; Xue, L. Low-carbon innovation induced by emissions trading in China. Nat. Commun. 2019, 10, 4088.
[CrossRef] [PubMed]
28. Du, K.; Li, J. Towards a green world: How do green technology innovations affect total-factor carbon productivity. Energy Policy
2019, 131, 240–250. [CrossRef]
29. Zhu, B.; Zhang, M.; Huang, L.; Wang, P.; Su, B.; Wei, Y.-M. Exploring the effect of carbon trading mechanism on China’s green
development efficiency: A novel integrated approach. Energy Econ. 2020, 85, 104601. [CrossRef]
30. Dong, F.; Dai, Y.; Zhang, S.; Zhang, X.; Long, R. Can a carbon emission trading scheme generate the Porter effect? Evidence from
pilot areas in China. Sci. Total Environ. 2019, 653, 565–577. [CrossRef]
31. Wu, P.; Jin, Y.; Shi, Y.; Shyu, H. The impact of carbon emission costs on manufacturers’ production and location decision. Int. J.
Prod. Econ. 2017, 193, 193–206. [CrossRef]
32. Wang, X.; Zhang, C.; Zhang, Z. Pollution haven or porter? The impact of environmental regulation on location choices of
pollution-intensive firms in China. J. Environ. Manag. 2019, 248, 109248. [CrossRef]
33. Lu, J.; Li, H. The impact of government environmental information disclosure on enterprise location choices: Heterogeneity and
threshold effect test. J. Clean. Prod. 2020, 277, 124055. [CrossRef]
34. Li, J.; Du, Y.X. Spatial effect of environmental regulation on green innovation efficiency: Evidence from prefectural-level cities in
China. J. Clean. Prod. 2021, 286, 125032. [CrossRef]
35. Karplus, V. China’s CO2 Emissions Trading System: History, Status, and Outlook; Harvard Project on Climate Agreements: Cambridge,
MA, USA, June 2021.
36. Hou, B.; Wang, B.; Du, M.; Zhang, N. Does the SO2 emissions trading scheme encourage green total factor productivity? An
empirical assessment on China’s cities. Environ. Sci. Pollut. Res. 2020, 27, 6375–6388. [CrossRef]
37. Yao, S.; Yu, X.; Yan, S.; Wen, S. Heterogeneous emission trading schemes and green innovation. Energy Policy 2021, 155, 112367.
[CrossRef]You can also read